R E S E A R C H
Open Access
Capturing health and eating status through
a nutritional perception screening
questionnaire (NPSQ9) in a randomised
internet-based personalised nutrition
intervention: the Food4Me study
Rodrigo San-Cristobal
1, Santiago Navas-Carretero
1,2*, Carlos Celis-Morales
3, Katherine M. Livingstone
3,
Barbara Stewart-Knox
4, Audrey Rankin
5, Anna L. Macready
6, Rosalind Fallaize
6, Clare B. O
’
Donovan
7,
Hannah Forster
7, Clara Woolhead
7, Marianne C. Walsh
7, Christina P. Lambrinou
8, George Moschonis
8,
Yannis Manios
8, Miroslaw Jarosz
9, Hannelore Daniel
10, Eileen R. Gibney
7, Lorraine Brennan
7,
Thomas E. Gundersen
11, Christian A. Drevon
12, Mike Gibney
7, Cyril F. M. Marsaux
13, Wim H. M. Saris
13,
Julie A. Lovegrove
6, Lynn J. Frewer
14, John C. Mathers
3, J. Alfredo Martinez
1,2,15,16and on behalf of the Food4Me Study
Abstract
Background:National guidelines emphasize healthy eating to promote wellbeing and prevention of
non-communicable diseases. The perceived healthiness of food is determined by many factors affecting food intake. A positive perception of healthy eating has been shown to be associated with greater diet quality. Internet-based methodologies allow contact with large populations. Our present study aims to design and evaluate a short nutritional perception questionnaire, to be used as a screening tool for assessing nutritional status, and to predict an optimal level of personalisation in nutritional advice delivered via the Internet.
Methods:Data from all participants who were screened and then enrolled into the Food4Me proof-of-principle study (n= 2369) were used to determine the optimal items for inclusion in a novel screening tool, the Nutritional Perception Screening Questionnaire-9 (NPSQ9). Exploratory and confirmatory factor analyses were performed on anthropometric and biochemical data and on dietary indices acquired from participants who had completed the Food4Me dietary intervention (n= 1153). Baseline and intervention data were analysed using linear regression and linear mixed regression, respectively.
(Continued on next page)
* Correspondence:[email protected] 1
Centre for Nutrition Research, Department of Nutrition, Food Science and Physiology, University of Navarra, C/Irunlarrea, 1, 31008 Pamplona, Spain 2CIBER Fisiopatología Obesidad y Nutrición (CIBERobn), Instituto de Salud Carlos III, 28023 Madrid, Spain
Full list of author information is available at the end of the article
(Continued from previous page)
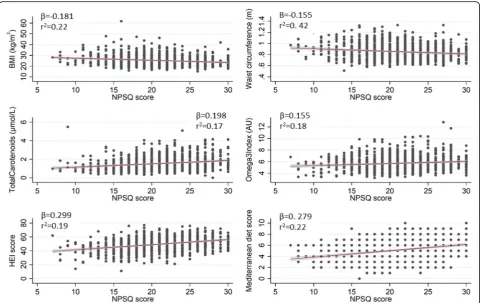
Results:A final model with 9 NPSQ items was validated against the dietary intervention data. NPSQ9 scores were inversely associated with BMI (β=−0.181,p< 0.001) and waist circumference (Β=−0.155,p< 0.001), and positively associated with total carotenoids (β= 0.198,p< 0.001), omega-3 fatty acid index (β= 0.155,p< 0.001), Healthy Eating Index (HEI) (β= 0.299,p< 0.001) and Mediterranean Diet Score (MDS) (β= 0. 279,p< 0.001). Findings from the longitudinal intervention study showed a greater reduction in BMI and improved dietary indices among participants with lower NPSQ9 scores.
Conclusions:Healthy eating perceptions and dietary habits captured by the NPSQ9 score, based on nine questionnaire items, were associated with reduced body weight and improved diet quality. Likewise, participants with a lower score achieved greater health improvements than those with higher scores, in response to personalised advice, suggesting that NPSQ9 may be used for early evaluation of nutritional status and to tailor nutritional advice.
Trial registration:NCT01530139.
Keywords:Food4Me, Personalised nutrition, Survey, Healthy eating index, Mediterranean diet score, NPSQ9,
Nutritional status
Background
A number of national strategies and programs focus on improving lifestyle and dietary habits for the prevention of non-communicable chronic diseases [1], especially those related to weight management [2, 3]. However, the perceived benefit of consuming certain foods is influ-enced by multiple individual factors, which may alter eating habits and dietary patterns. Identification of these factors and dietary patterns is an important challenge for the promotion of well-being and public health [4, 5]. Identification of barriers to the consumption of healthy foods is imperative to the design of effective behaviour change interventions and policies [6]. Moreover, infor-mation on barriers to healthy eating will help identify food-related perceptions that have the potential to nega-tively impact on dietary choices [7].
Perception of food healthiness is determined by numerous factors such as conventional and unconven-tional beliefs [4, 6], as well as consciousness/knowledge of food composition [8]. Such perceptions may affect attitudes towards foods consumption, resulting in under-or over-eating and causing unhealthy changes in body weight [8]. Previous studies have indicated positive asso-ciations between perception of healthy food intake and
diet quality [9–11]. A preceding study on dietary
patterns in a Spanish cohort showed that participants
who presented with “prudent” or “healthy” dietary
patterns reported greater proportions of positive percep-tions of healthy eating than those who exhibited a
“Western” or “compensatory” dietary patterns [5]. Similarly, the perception of healthy eating has been pre-sented by some authors as a plausible predictor of behavioural intentions regarding food choices [12]. Such evidence suggests that a maintained positive perception of healthy intake, alongside other perceived values, might contribute to the adoption of healthy habits and
food choices, including a reduced energy intake where appropriate, during a dietary intervention with persona-lised nutritional advice [13, 14].
Development of tools to assess health status has played an important role in health behaviour research [15]. The relationship between wellbeing and healthy eating is well established, which is the reason why many psychological and public health studies have tried to develop questionnaires aiming to collect information on complex issues like eating behaviour related to the development of chronic diseases such as obesity, diabetes, and cardiovascular events [16, 17]. These questionnaires require the use of representative data and sufficient accuracy before being used as early detection tools.
The current development of worldwide internet-based communications has highlighted the need for short and applicable tools for the screening of large populations [18]. The use of Internet-based platforms allows contact with large numbers of individuals with a good cost effectiveness [19], however such questionnaires would need to be tested in different settings and with large and heterogeneous populations. The present study was a cross-sectional and longitudinal analysis intended to design and validate a short nutritional perception questionnaire. It is anticipated that this screening tool may be used by health professionals to assess percep-tions of eating behaviour and health status with the aim of predicting the optimal level of personalisation in nutritional advice via the internet.
Methods
Study population and study design
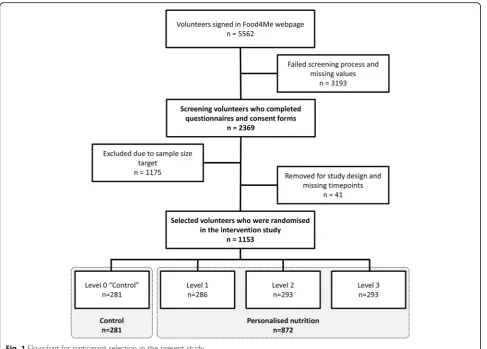
Screening Questionnaire-9 (NPSQ9) design were enrolled from the Food4Me study, which was a randomised con-trolled intervention trial designed to assess the effect of per-sonalised nutrition advice on health-related behaviours across seven European countries [20]. Participants who signed up on the Food4Me webpage (http://www.food4 me.org) and completed the initial screening processes were
selected (n= 2369) for inclusion in the NPSQ9 design.
These processes consisted of signing two informed consent forms if inclusion criteria for taking part in the Food4Me study were met [20], and providing information by answer-ing the screenanswer-ing questionnaires (Table 1), on aspects re-garding socio-demographics, medical history, lifestyle and dietary habits, health and eating self-perception, as well as responses to a validated Food Frequency Questionnaire (FFQ) [21, 22]. Volunteers selected for inclusion in the intervention and who completed the questionnaires at
baseline and at 6 months (n= 1153), were used for the
sub-sequent validation study and for association analyses with different dietary indices (Fig. 1). During the study, the vol-unteers were randomly assigned to one of four intervention groups receiving different types of personalised nutrition
advice: Level 0 – control group – conventional
non-personalised nutrition advice; Level 1–personalised advice
based on dietary data; Level 2 –personalised advice based
on dietary and phenotypic data; and Level 3–personalised
advice based on dietary, phenotypic, and genotypic data. For the analysis of the effects of personalised nutrition ad-vice, volunteers from Levels 1, 2, and 3, were pooled to evaluate the effects of personalising the nutritional advice, without taking into account the type of feedback provided.
Item selection
Data obtained from the questionnaire, specifically designed within the Food4Me study, and related to diet-ary habits, health perception, eating perception, and nutrition self-efficacy were used for the analyses. This
questionnaire contained Likertscale questions related to
Nutrition Self-efficacy [23], Health locus of control [24],
Self-report Habit Index[25, 26], andDietary food choice/ habits(Additional file 2: Table S1).
Socio-demographic questions, self-reported height and weight [27], the validated Food4Me FFQ [21, 22, 28], and biochemical values of dried blood spots [29], were analysed for associations with the scores obtained from the screening stage. These questionnaire items were coded and used to create a reduced aggregate score.
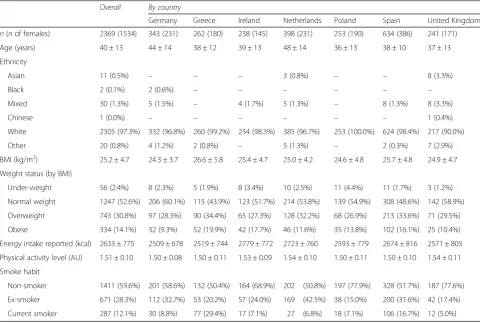
Table 1Characteristics of overall sample and by country
Overall By country
Germany Greece Ireland Netherlands Poland Spain United Kingdom
n(nof females) 2369 (1534) 343 (231) 262 (180) 238 (145) 398 (231) 253 (190) 634 (386) 241 (171)
Age (years) 40 ± 13 44 ± 14 38 ± 12 39 ± 13 48 ± 14 36 ± 13 38 ± 10 37 ± 13
Ethnicity
Asian 11 (0.5%) – – – 3 (0.8%) – – 8 (3.3%)
Black 2 (0.1%) 2 (0.6%) – – – – – –
Mixed 30 (1.3%) 5 (1.5%) – 4 (1.7%) 5 (1.3%) – 8 (1.3%) 8 (3.3%)
Chinese 1 (0.0%) – – – – – – 1 (0.4%)
White 2305 (97.3%) 332 (96.8%) 260 (99.2%) 234 (98.3%) 385 (96.7%) 253 (100.0%) 624 (98.4%) 217 (90.0%)
Other 20 (0.8%) 4 (1.2%) 2 (0.8%) – 5 (1.3%) – 2 (0.3%) 7 (2.9%)
BMI (kg/m2) 25.2 ± 4.7 24.3 ± 3.7 26.6 ± 5.8 25.4 ± 4.7 25.0 ± 4.2 24.6 ± 4.8 25.7 ± 4.8 24.9 ± 4.7
Weight status (by BMI)
Under-weight 56 (2.4%) 8 (2.3%) 5 (1.9%) 8 (3.4%) 10 (2.5%) 11 (4.4%) 11 (1.7%) 3 (1.2%)
Normal weight 1247 (52.6%) 206 (60.1%) 115 (43.9%) 123 (51.7%) 214 (53.8%) 139 (54.9%) 308 (48.6%) 142 (58.9%)
Overweight 743 (30.8%) 97 (28.3%) 90 (34.4%) 65 (27.3%) 128 (32.2%) 68 (26.9%) 213 (33.6%) 71 (29.5%)
Obese 334 (14.1%) 32 (9.3%) 52 (19.9%) 42 (17.7%) 46 (11.6%) 35 (13.8%) 102 (16.1%) 25 (10.4%)
Energy intake reported (kcal) 2633 ± 775 2509 ± 678 2519 ± 744 2779 ± 772 2723 ± 760 2593 ± 779 2674 ± 816 2571 ± 805
Physical activity level (AU) 1.51 ± 0.10 1.50 ± 0.08 1.50 ± 0.11 1.53 ± 0.09 1.54 ± 0.10 1.50 ± 0.11 1.50 ± 0.10 1.54 ± 0.11
Smoke habit
Non-smoker 1411 (59.6%) 201 (58.6%) 132 (50.4%) 164 (68.9%) 202 (50.8%) 197 (77.9%) 328 (51.7%) 187 (77.6%)
Ex-smoker 671 (28.3%) 112 (32.7%) 53 (20.2%) 57 (24.0%) 169 (42.5%) 38 (15.0%) 200 (31.6%) 42 (17.4%)
Current smoker 287 (12.1%) 30 (8.8%) 77 (29.4%) 17 (7.1%) 27 (6.8%) 18 (7.1%) 106 (16.7%) 12 (5.0%)
Dietary assessment
For participants included in the randomization interven-tion study, diet quality indices were calculated at baseline (t0), 3 months (t3) and 6 months (t6), to assess the effect of personalised nutrition advice on dietary intake. Healthy Eating Index-2010 (HEI-2010) was calculated as described by Guenther et al. [30] according to consumption of food groups estimated using the FFQ. The Mediterranean Diet Score (MDS) was calculated using the PREDIMED 14-item screening tool [31]. Finally, Nutrient Adequacy Ratio (NAR), as described elsewhere [32], was estimated for the following nutrients: protein, carbohydrates, total fat, saturated fat, monounsaturated fatty acids (MUFA), poly-unsaturated fatty acids (PUFA), omega-3 fatty acids, salt, fiber, calcium, iron, vitamin A, folate, thiamine, riboflavin,
vitamin B12, and vitamin C, after the personalised
nutrition intervention [33]. The NAR was specifically calculated for each nutrient, and the recommended intake values established in the intervention were used as the reference. Subsequently, the reported intake of each nutri-ent was computed as a percnutri-entage of the corresponding reference value, establishing levels of attainment. For some specific nutrients only under-consumption was
considered inadequate, while for those nutrients in which excessive intake may also be considered inadequate, over-consumption was also taken into account. The Mean Adequacy Ratio (MAR) was a measure of overall diet adequacy including the mean of all the NAR components. For both NAR and MAR a score of 100% represented the ideal adequacy of intake reported, showing neither reduced nor excessive consumption.
Chemical validation of intakes of fatty acids and of carotenoids using analysis of dried blood spots
Dietary fatty acid markers were determined via gas liquid chromatography combined with flame ionisation detection (GLC-FID) by Vitas Ltd. (www.vitas.no) as described previously [34]. Carotenoids were determined using high performance liquid chromatography with UV detection (HPLC-UV) on dried blood spots (DBS) cards with an appropriate stabilizer impregnated onto the DBS paper [35].
Statistical analyses
To determine items for inclusion in the final NPSQ9 scale, the questions previously coded (Additional file 2: Table S1) were analysed through an exploratory factor
analysis with the “least squares estimation” method and
“varimax rotation”, to include the maximum amount of
variance from the categorical variables.
Secondly, to test the suitability of the data used for the factor analysis, the Kaiser-Meyer-Olkin Criterion [36] and Bartlett’s test of sphericity [37] were performed. Scree plot and Eigen values higher than 1 were used for the selection of the factors to be included in the NPSQ9. By this method it was possible to collect the highest proportion of variance. For each factor, a step-wise selection (removing and rerunning the analysis) of the items was applied. Sub-sequently, the items presenting a factor loading greater than 0.3 for the model were selected and included in the aggregate score, which was calculated by summing the coded values of each question, thus providing a plausible range of scores from 0 to 30 (NPSQ9 score).
The internal reliability of the score items was evaluated by a Cronbach alpha analysis. Finally, a confirmatory fac-tor analysis (CFA) was performed by means of structural equation modelling (SEM). To identify correlated unique-ness in the obtained factor model, modification of indices was checked, and goodness-of-fit indices were estimated. The resulting NPSQ9 score was used in the Food4Me par-ticipants who had been randomised to the personalised nutrition intervention (Fig. 1), in order to validate the results obtained with the exploratory analysis performed in the screening population. Model robustness was also tested by applying the model in different subgroups
classi-fied by sex and age (<45 years or ≥45 years) from the
randomised volunteers.
A linear regression model adjusted for continuous var-iables (age, and physical activity) and categorical vari-ables (sex, country, socio-economic status and smoking habits) was performed to test the association between the NPSQ9 score and anthropometrical characteristics, biochemical values, and diet quality indices (MDS and HEI) in the screening population. Furthermore, linear mixed regression models, adjusted also by age, sex, country, physical activity, socio-economic status and smoking habits, were used to analyse potential trends in variables categorised by tertiles of NSPQ9 score within the participants randomised in the Food4Me interven-tion. To analyse the effect of personalised nutrition advice during the intervention on the obtained NPSQ9 score, time-point and level of personalised advice inter-actions were included in the previously described mixed models for estimating the variation of each dependent variable on each tertile of the NPSQ9 score.
For descriptive analyses, differences between groups were assessed by chi-square for categorical variables, and by analysis of variance (ANOVA) adjusted for age, sex, country, physical activity, socio-economic status and smoking habits for continuous variables. All statistical
analyses were performed using STATA statistical
software (Stata IC version 12.0, StataCorp, College
Station, TX, USA), and p values lower than 0.05 were
considered significant.
Results
Descriptive statistics among recruiting centres showed dif-ferences regarding population characteristics (Table 1). Exploratory factor analysis using an iterative process, carried out on the 2369 volunteers and including 22 questions from the screening questionnaire (Table S1, in Additional file 2), revealed a total of nine items with factor loadings higher than 0.3 after varimax rotation (Table 2).
The Kaiser-Meyer-Olkin Criterion was 0.83 and Bartlett’s
test of sphericity was highly significant (p< 0.001), indicat-ing suitability of the results.
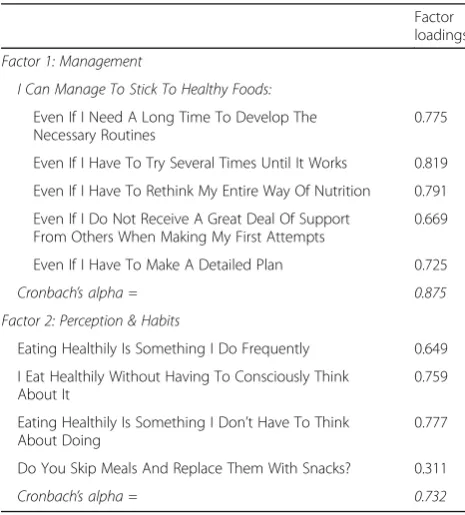
The nine items were aggregated into two groups (or
factors) that were named“Management”and“Perception
& Habits” respectively, to reflect the items included in
each. The“Management”factor included items reflecting
the self-reported capacity of the volunteers to select healthy foods, and the effort required to achieve healthy eating habits. The“Perception & Habits”factor included items related to the effort of selecting healthy foods, and one item involving substitution of meals with snacks. The correlation between the estimated factor scores and factors (factor determinacies coefficient) were higher than 0.978 for both factors. The analysis of internal
consistency showed an acceptable Cronbach’s alpha of
0.792 for overall items, whereas the alpha values for each factor were 0.875 and 0.732, respectively (Table 2).
Table 2Exploratory factor analysis for questionnaire item selection
Factor loadings
Factor 1: Management
I Can Manage To Stick To Healthy Foods:
Even If I Need A Long Time To Develop The Necessary Routines
0.775
Even If I Have To Try Several Times Until It Works 0.819
Even If I Have To Rethink My Entire Way Of Nutrition 0.791
Even If I Do Not Receive A Great Deal Of Support From Others When Making My First Attempts
0.669
Even If I Have To Make A Detailed Plan 0.725
Cronbach’s alpha = 0.875
Factor 2: Perception & Habits
Eating Healthily Is Something I Do Frequently 0.649
I Eat Healthily Without Having To Consciously Think About It
0.759
Eating Healthily Is Something I Don’t Have To Think About Doing
0.777
Do You Skip Meals And Replace Them With Snacks? 0.311
Furthermore, results obtained in the exploratory ana-lyses were confirmed by the CFA with the corresponding items (Figure S1, in Additional file 3). The goodness-of-fit values for the two factors model after the inclusion of four pairwise correlated errors showed acceptable ranges over the whole screening sample: RMSEA (0.037; 90%
CI: 0.029–0.044), CFI (0.992). When the resulting model
was applied to the sample of randomised volunteers, the results exhibited a satisfactory value for goodness of fit:
RMSEA (0.031; 90% CI: 0.018–0.043), CFI (0.994). These
results were also consistent when the model was carried out in categorised subsamples for sex and age: RMSEA
(0.028; 90% CI: 0.012–0.040), CFI (0.994) and RMSEA
(0.032; 90% CI: 0.019–0.044), CFI (0.992), respectively.
Differences in the screening sample characteristics were observed when volunteers were categorised into tertiles of NPSQ9 score (Table 3). Lower BMI values were observed in volunteers with a high NPSQ9 score, and physical activity level was lower for the volunteers in the first tertile. Regarding food consumption, the indi-viduals ranked in the first tertile reported greater energy intake and higher intake of sweets & snacks, whereas there was an increased intake of cereal, egg, fruit, and vegetables in the upper tertiles. An association study within the randomised participants was carried out to evaluate previous results obtained at baseline on the anthropometrical, biochemical and diet quality indices (Fig. 2). Negative relationships were found for
anthropo-metrical variables, showingβ-values of−0.18 for BMI (p
< 0.001) and −0.16 (p< 0.001) for waist circumference, whereas biochemical and dietary indices showed a
positive association with β-values of 0.2 (p< 0.001) and
0.16 (p< 0.001) for total carotenoids and omega acid-3
fatty index, respectively, as well as 0.3 (p< 0.001) and
0.28 (p< 0.001) for HEI and MDS, respectively.
The trends during the intervention study (Table 4) showed significant reduction in BMI, waist circumference, plasma concentrations of glucose, cholesterol, total carot-enoids, and MAR, whereas omega-3 fatty acid index, HEI and MDS were enhanced during the intervention. Differ-ences in trends between tertiles 1 and 2 were observed in waist circumference and plasma glucose, whereas total carotenoids showed significant differences between tertiles 1 and 3. Furthermore, HEI and MAR exhibited differences in trends between the higher and lower tertile (Table 4). Despite the differences in trends during the intervention, the participants in tertile 3 maintained lower BMI and waist circumference, and higher levels of carotenoids and of omega-3 fatty acid index in blood, along with higher scores for HEI and MDS.
The effect of personalised nutrition advice on anthropo-metrical and dietary quality is shown in Fig. 3. Interestingly, a significant reduction in BMI was found for participants with low NPSQ9 scores receiving personalised advice as compared to the control group (only receiving general
advice) at t3 (Δt0-t3: β=−0.23, 95%CI =−0.43 to
−0.03, ρ= 0.025) and t6 (Δt0-t6: β=−0.27, 95%CI =
−0.52 to −0.02, ρ= 0.038). Furthermore, significant
effects were observed for the diet quality indices: an
increase for HEI at short-term, 3 months (Δt0-t3: β=
2.81, 95%CI = 1.06 to 4.66, ρ= 0.002), and also for
MDS at both short and long-term, 6 months (Δt0-t3:
Table 3Dietary characteristics of screening sample by Nutritional Perception Screening Questionnaire-9 (NPSQ9) tertiles
Tertile 1 (Low)
(Score 4–19)
Tertile 2 (Medium)
(Score 20–23)
Tertile 3 (High)
(Score 24–30)
ρ† ρ‡
n(nof women) 934 (478) 805 (546) 630 (506) 0.005§
Age (years) 40 ± 12 41 ± 14 40 ± 13 0.069 0.408
Physical activity level (AU) 1.49 ± 0.10a 1.52 ± 0.10b 1.53 ± 0.10b <0.001 <0.001
BMI (kg/m2) 26.4 ± 5.2a 25.0 ± 4.5b 23.9 ± 3.8c <0.001 <0.001
Energy intake reported (kcal/day) 2723 ± 801a 2571 ± 733b 2577 ± 775b <0.001 <0.001
Cereal (g/day) 42.9 ± 72.4a 58.4 ± 104.4b 64.9 ± 91.6b <0.001 <0.001
Dairy products (g/day) 360.9 ± 254.6 374.2 ± 285.4 385.2 ± 284.3 0.540 0.303
Eggs (g/day) 32.3 ± 37.9a 30.9 ± 32.4a 37.5 ± 49.2b 0.012 0.013
Fats & Spreads (g/day) 21.2 ± 17.3 19.8 ± 14.9 20.3 ± 18.8 0.236 0.636
Fruit (g/day) 257.2 ± 237.6a 320.1 ± 248.6b 380.3 ± 301.4c <0.001 <0.001
Meat & Fish (g/day) 201.9 ± 119.4 187.0 ± 116.2 199.6 ± 139.8 0.358 0.476
Soups & sauces (g/day) 94.7 ± 76.4 97.8 ± 79.3 97.6 ± 88.1 0.082 0.051
Sweets & snacks (g/day) 121.3 ± 93.9a 100.1 ± 83.1b 82.0 ± 69.7c <0.001 <0.001
Vegetables (g/day) 188.1 ± 117.4a 229.1 ± 163.6b 282.6 ± 186.5c <0.001 <0.001
BMIBody Mass Index,AUArbitrary Units.†ANOVA for least squared values adjusted by age, sex, country, smoking habits, and physical activity with Bonferroni post-hoc expressed by superscript letters; differences in letters show differences between groups withp-value < 0.05.§
p-value for Chi-square test of distribution.
β= 0.33, 95%CI = 0.01 to 0.65, ρ= 0.045; Δt0-t6: β=
0.47, 95%CI = 0.13 to 0.81, ρ= 0.007; respectively).
Discussion
The main novelty of this study was the development of a screening tool based on health and eating status, through
self-perception questions. Despite the numerous question-naires developed in the last years, the combination of aware-ness items with the capacity of predicting health and dietary
outcomes has not been properly addressed so far [38–40].
This tool used items from the Food4Me screening
questionnaire, which was validated to collect
Fig. 2Association between Nutritional Perception Screening Questionnaire-9 (NPSQ9) Score with BMI, HEI score, total carotenoids in blood and Omega-3 fatty acid index in blood. All associations were highly significant (p< 0.001)
Table 4Linear trend prediction through follow-up (0, 3 and 6 months) for changes by NPSQ9 tertiles of randomised volunteers
Tertile 1 (Low) Tertile 2 (Medium) Tertile 3 (High) ρ† ρ‡
Score 7–19 20–23 24–30 – –
n(women) 443 (258) 402 (237) 308 (174) 0.799§ –
BMI (kg/m2) −0.16 ± 0.02*** −0.15 ± 0.02*** −0.12 ± 0.02*** 0.934 0.340
Waist circumference (m) −0.004 ± 0.001*** −0.007 ± 0.001*** −0.006 ± 0.001*** 0.024 0.197
Glucose (mmol/L) −0.10 ± 0.02***
−0.16 ± 0.02***
−0.12 ± 0.02*** 0.046 0.472
Total colesterol (mmol/L) −0.08 ± 0.02***
−0.09 ± 0.02***
−0.05 ± 0.02* 0.658 0.351
Total carotenoids (μmol/L) −0.01 ± 0.01 −0.02 ± 0.01*
−0.05 ± 0.02** 0.257 0.030
Omega3 index (AU) 0.09 ± 0.02*** 0.12 ± 0.02*** 0.10 ± 0.03*** 0.289 0.713
HEI score (AU) 1.75 ± 0.18*** 1.13 ± 0.16*** 1.05 ± 0.19*** 0.012 0.008
MDS (AU) 0.21 ± 0.03*** 0.15 ± 0.03*** 0.12 ± 0.04** 0.201 0.070
MAR (%) −1.84 ± 0.18***
−1.10 ± 0.16***
−1.12 ± 0.18*** 0.003 0.006
BMIBody Mass Index,AUArbitrary Units,HEIHealthy Eating Index,MDSMediterranean Diet Score,MARMean Adequacy Ratio.p-values for linear trend represented by*
forp-value <0.05;**
forp-value < 0.01;***
forp-value < 0.001
†p-value for contrast of linear trend between Tertile1 and Tertile2;‡p-value for contrast of linear trend between Tertile1 and Tertile3;§
information relating to personalised nutrition [13]. Simi-larly, previous studies have sought to capture the infor-mation collected by validated questionnaires through reduced factor structure providing new reliable scales [40, 41] or validating this new factor structure in other
populations or subsamples [42–44].
Indeed, a previous study using the Spanish screening cohort of the Food4Me study has indicated that some of the items present in the questionnaires were related to specific dietary patterns [5]. In that study, significant ifferences were observed in the perceptions of healthy eating habits between participants who were
character-ized by “Western” and “Compensatory” dietary patterns
compared to participants reporting “Prudent” and
“Healthy” dietary patterns. Differences were also found in habits that have previously been found to be related
to the development of obesity, such as the frequency of eating fried foods, or the frequency of skipping meals
with snacks [45–47], which form part of the NPSQ9’s
“Perception & habits”factor.
Our findings support the usefulness of emerging statis-tical tools, such as factor structure analysis and criterion validity, to reduce the number of questions related to perceptions of healthy eating habits. The questionnaires used for the development of the present screening tool were selected and adapted for the Food4Me study to evaluate the psychological determinants of acceptance of personalised nutrition [13], self-reported dietary intake [21, 22, 28], and self-reported anthropometrical mea-surements [27]. In this context, these statistical tools have been used to analyse the dimensions of new
ques-tionnaires [41, 48], and for validation in other
populations [40, 49]. However, the use of these tools also enables the reduction of dimensions within question-naires, accounting for the maximum variance in the low-est number of factors [25, 40]. Previous studies have validated shortened questionnaires by relating responses to eating behaviour [19], emphasising the importance of perceptions of healthy eating and providing valuable tools to screen large populations [18, 50]. Furthermore, one of the most common limitations of questionnaires developed Ad Hoc is the uncertainty of reproducibility, and it is important that the new screening tool is repro-ducible when used across different population groups. For these reasons, we tested the robustness of the model in different subgroups in our own population.
Regarding the selection of questions to be included in the NPSQ9, some comments are needed, as during the factor analysis and selection work, some potentially con-troversial issues arose. Regarding Factor 2, two
appar-ently similar questions were included: “I Eat Healthily
Without Having to Consciously Think About It” and
“Eating Healthily is Something I Don’t Have To Think
About Doing”. However, the correlation was not strong
between them, which may be explained through the ana-lysis of acquired habits and habit acquisition [26]. In this
sense, “Conscious thinking” would refer to an acquired
habit, where active intention is not involved, while in the
second question, the “thinking of doing” implies an
active intention from the subjects’side on changing or
acquiring a new habit [26], assuming that the
partici-pant’s intention, when registering in the Food4Me study,
was to improve health through dietary change.
Regarding another question included in the Factor 2
group (“Healthy Factor”), related to Meal skipping and
snacking (“Do You Skip Meals and Replace Them With
Snacks?”), it must be noted that meal skipping and
replacing meals by snacks is not a healthy behaviour. Indeed, not doing these actions is associated with health-ier dietary habits, and relates to energy balance and micronutrient adequacy [51, 52]. Thus this item was included but with the score inversely coded, giving the highest score in this item to those subjects who never or almost never skip meals.
In the present research, an association was found between high NPSQ9 scores and anthropometric measure-ments, biochemical values and diet quality indices, in line with previous information [41, 53, 54]. Other studies also reported a relationship between body weight and percep-tions related to appetite [49]. Some authors found associa-tions between body weight and behavioural questionnaires linked with the presence of specific gene variants related to appetite regulation in adults [55] as well as children [56]. Heritability of satiety and responsiveness to food suggest that genetics may influence some aspects related to eating behaviours and may also alter metabolic pathways [57].
A possible reason for the relationship between NPSQ9 score and healthy body weight could be that individuals with better scores showed more frequent consumption of fish, vegetables and fruit as observed in the analysis of MDS components (Additional file 2: Table S2). Reported intake of fish was associated with higher NPSQ9 scores, and the results were validated by the omega-3 fatty acid index in blood [58, 59].
Fruit and vegetable consumption was confirmed by the measure of total carotenoid concentration in blood at baseline [60, 61]. Preceding studies have shown that people with healthy eating perceptions show increased consumption of vegetables and fruit and higher diet quality indices, independently of socio-economic status, suggesting that healthy perception is representative of good nutrition [9]. Estimation of fruit and vegetable intake by short questionnaires has been widely studied
by numerous researchers [62–64], also using the
tele-phone [54, 65] or Internet [66]. In the present study, we used on-line contact, an approach in which the possibil-ity of reaching large populations to promote healthier behaviours is notably increased, given the feasibility of using the internet worldwide [67], and the benefits and reliability of this approach [27, 29].
Analysis of the results from the intervention study showed high improvement in HEI for participants with low NPSQ9 scores. These individuals with a good perception of healthy eating showed greater capacity for, and willingness to, improve their diet [68]. Our results suggest that a score of 20 or less may be used as a cut-off to identify individuals with high risk of nutritional imbalance, although further analysis would be required.
Results from the Food4Me study [64–66] demonstrated
that personalised nutritional advice, based on self-reported information, led to improvement in partici-pants’dietary quality indices [69–71].
In the current investigation, participants’ reported
intakes of fish, fruit and vegetables were validated by the biochemical measurements of omega-3 fatty acid index and total carotenoids in blood. The main limitation of the present work is the absence of repeated measures for the screening questionnaire, which would have allowed us to carry out a test/ re-test analysis to ensure repeat-ability of the results amongst the participants. Further research in this knowledge area is still needed, in order to demonstrate the efficacy and reproducibility of NPSQ9 as a screening tool and to determine robust cut-off values. Furthermore, it will also be necessary to de-termine whether online nutritional advice achieves dietary changes that are sustainable in the long-term.
Conclusions
which could be used in health evaluation for early adaptation to healthy eating. Moreover, individuals with a low NPSQ9 score made greater improvements to their
diet during the intervention with personalised
nutritional advice provided on-line. Our results suggest that scores on the NPSQ9, with nine questionnaire items related to perception of healthy eating, could be used as
a screening tool by dieticians and other health
professionals to quickly estimate nutritional status and predict the appropriate level of personalisation in the nutritional advice.
Additional files
Additional file 1:CONSORT CHECKLIST. (DOC 217 kb)
Additional file 2: Table S1.Set of all the questions included in the Item selection analysis.Table S2.Analysis of differences in MDS components by tertiles of NPSQ9 at baseline. (DOCX 25 kb)
Additional file 3:Figure S1.Flow diagram of the confirmatory factor analysis of selected items of Nutritional Perception Screening Questionnaire (NPSQ9) in the randomised sample. (PPTX 188 kb)
Abbreviations
ANOVA:Analysis of variance; BMI: Body Mass Index; CFA: Confirmatory factor analysis; CFI: Comparative Fit Index; FFQ: Food Frequency Questionnaire; HEI: Healthy Eating Index; MAR: Mean Adequacy Ratio; MDS: Mediterranean Diet Score; MUFA: Monounsaturated fatty acids; NAR: Nutrient Adequacy Ratio; NPSQ: Nutritional Perception Screening Questionnaire;
PUFA: Polyunsaturated fatty acids; RMSEA: Root Mean Square of Approximation; SEM: Structural equation modelling
Acknowledgements
Sharron Kuznesof, Arnout R.H. Fischer, Aleksandra Berezowska, Ivo vander Lans, Maria Daniel Vaz de Almeida, Bruno Oliveira, Rui Poínhos, Marian Raley, Maresa Duffy, Karen Orr, Jenny Robinson are gratefully acknowledged for developing the questionnaires included in the Food4Me Study.
Paul Miller from the Department of Modern Language (University of Navarra) is also acknowledged for the English revision of the manuscript.
Funding
The Food4Me project has received funding from the European Union’s Seventh Framework Programme for research, technological development and demonstration (grant agreement no. 265494).
The research leading to these results has received funding from“la Caixa” Banking Foundation through a grant for the PhD work of Rodrigo San-Cristobal.
Availability of data and materials
Requests for data and material should be directed to the study director Professor Mike Gibney ([email protected]) and/or Professor John Mathers, ([email protected]).
Authors’contributions
Author responsibilities were as follows: RS-C and SN-C drafted the paper and performed the statistical analysis for the manuscript. JAM was the responsible of Spanish centre of intervention. MG, JCM, JAM, SNC, CCM, MCW, ERG, LB, WHMS, HD, LJF, BSK, CAD, JAL, YM, and MJ, contributed to the research design. RSC, SNC, KML, AR, CFMM, CO’D, HF, CW, ALM, RF, GM, CPL and TEG conducted the intervention. KML and ALM, checked for correct English grammar and vocabulary in the last revised version of the manuscript. All authors contributed to a critical review of the manuscript during the writing process. All authors approved the final version to be published.
Ethics approval and consent to participate
All procedures performed in the study were in accordance with the ethical standards of the corresponding research committees of each of the seven
participating centres, and with the 1964 Helsinki declaration and its later amendments or comparable ethical standards.
Informed consent was obtained from all individual participants included in the study.
The Research Ethics Committees evaluating the study protocol were those with the appropriate authority in each study site: University College Dublin, Ireland; University of Maastricht, Netherlands; Universidad de Navarra, Spain; Harokopio University, Greece; The University of Reading, United Kingdom; National Food and Nutrition Institute, Poland; Technische Universitaet Muenchen, German.
Being the study coordinator Ireland, the relevant Health Authority in Food4Me study was the Research Ethics Committee of Ireland.
Consent for publication Not applicable
Competing interests
CAD is cofounder, board member, stock-owner and consultant for Vitas Ltd. (www.vitas.no) performing the dried blood spot (DBS) analyses. TEG is cofounder, stock-owner and CEO of Vitas.
Publisher’s Note
Springer Nature remains neutral with regard to jurisdictional claims in published maps and institutional affiliations.
Author details
1Centre for Nutrition Research, Department of Nutrition, Food Science and Physiology, University of Navarra, C/Irunlarrea, 1, 31008 Pamplona, Spain. 2CIBER Fisiopatología Obesidad y Nutrición (CIBERobn), Instituto de Salud Carlos III, 28023 Madrid, Spain.3Human Nutrition Research Centre, Institute of Cellular Medicine, Newcastle University, Newcastle Upon Tyne NE1 7RU, UK. 4
School of Psychology, University of Bradford, West Yorkshire BD71DP, UK. 5Northern Ireland Centre for Food and Health, University of Ulster, Coleraine BT52 1SA, UK.6Hugh Sinclair Unit of Human Nutrition and Institute for Cardiovascular and Metabolic Research, University of Reading, Reading RG6 6AA, UK.7UCD Institute of Food and Health, UCD School of Agriculture and Food Science, University College Dublin, Belfield, Dublin 4, Republic of Ireland.8Department of Nutrition and Dietetics, Harokopio University of Athens, 17671 Athens, Greece.9Institute of Food and Nutrition (IZZ), 02-903 Warsaw, Poland.10ZIEL Research Center of Nutrition and Food Sciences, Biochemistry Unit, Technische Universität München, 85354 Munich, Germany. 11Vitas Ltd., Oslo Science Park, Gaustadalléen 21, 0349 Oslo, Norway. 12Department of Nutrition, Institute of Basic Medical Sciences, Faculty of Medicine, University of Oslo, 0317 Oslo, Norway.13Department of Human Biology, NUTRIM School for Nutrition and Translational Research in Metabolism, Maastricht University Medical Centre, Maastricht 6200 MD, The Netherlands.14Food and Society Group, Newcastle University, Newcastle Upon Tyne NE1 7RU, UK.15Instituto de Investigaciones Sanitarias de Navarra (IDisNa), 31008 Pamplona, Spain.16Instituto Madrileño de Estudios Avanzados (IMDEA) Alimentacion, Madrid, Spain.
Received: 30 June 2017 Accepted: 23 October 2017
References
1. European Parliament, Council. Corrigendum to regulation (EC) No 1924/ 2006 of the European Parliament and of the council of 20 December 2006 on nutrition and health claims made on foods. Off J Eur Union. 2007;12:16. 2. Krebs-Smith SM, Kris-Etherton P. How does MyPyramid compare to other
population-based recommendations for controlling chronic disease? J Am Diet Assoc. 2007;107:830–7. doi:10.1016/j.jada.2007.02.016.
3. Fung TT, Pan A, Hou T, Chiuve SE, Tobias DK, Mozaffarian D, et al. Long-term change in diet quality is associated with body weight change in men and women. J Nutr. 2015;145:1850–6. doi:10.3945/jn.114.208785
4. Provencher V, Jacob R. Impact of perceived healthiness of food on food choices and intake. Curr Obes Rep. 2016;5:65–71. doi:10.1007/ s13679-016-0192-0.
6. Spence M, Barbara M, Livingstone E, Hollywood LE, Gibney ER, O’briene SA, et al. A qualitative study of psychological, social and behavioral barriers to appropriate food portion size control. Int J Behav Nutr Phys Act. 2013;10:1. doi:10.1186/1479-5868-10-92.
7. Kearney M, Gibney MJ, Martinez JA, de Almeida MD, Friebe D, Zunft HJ, et al. Perceived need to alter eating habits among representative samples of adults from all member states of the European Union. Eur J Clin Nutr. 1997;51 Suppl 2:S30–5.
8. Carels RA, Harper J, Konrad K. Qualitative perceptions and caloric estimations of healthy and unhealthy foods by behavioral weight loss participants. doi:10.1016/j.appet.2005.12.002.
9. Aggarwal A, Monsivais P, Cook AJ, Drewnowski A. Positive attitude toward healthy eating predicts higher diet quality at all cost levels of supermarkets. J Acad Nutr Diet. 2014;114:266–72. doi:10.1016/j.jand.2013.06.006. 10. Lê J, Dallongeville J, Wagner A, Arveiler D, Haas B, Cottel D, et al. Attitudes
toward healthy eating: a mediator of the educational level–diet relationship. Eur J Clin Nutr. 2013;67:808–14. doi:10.1038/ejcn.2013.110.
11. Beydoun MA, Wang Y. How do socio-economic status, perceived economic barriers and nutritional benefits affect quality of dietary intake among US adults? Eur J Clin Nutr. 2008;62:303–13. doi:10.1038/sj.ejcn.1602700. 12. Dowd K, Burke KJ. The influence of ethical values and food choice
motivations on intentions to purchase sustainably sourced foods. Appetite. 2013;69:137–44. doi:10.1016/j.appet.2013.05.024.
13. Poínhos R, van der Lans IA, Rankin A, Fischer ARH, Bunting B, Kuznesof S, et al. Psychological determinants of consumer acceptance of personalised nutrition in 9 European countries. PLoS One. 2014;9:e110614. doi:10.1371/ journal.pone.0110614.
14. Martinez JA, Navas-Carretero S, Saris WHM, Astrup A. Personalized weight loss strategies-the role of macronutrient distribution. Nat Rev Endocrinol. 2014;10:749–60. doi:10.1038/nrendo.2014.175.
15. Kaput J, Ordovas JM, Ferguson L, Van Ommen B, Rodriguez RL, Allen L, et al. Horizons in nutritional science the case for strategic international alliances to harness nutritional genomics for public and personal health. Br J Nutr. 2017;94:22–4. doi:10.1079/BJN20051585.
16. Hu FB. Dietary pattern analysis: a new direction in nutritional epidemiology. Curr Opin Lipidol. 2002;13:3–9.
17. Medina-RemÓn A, Kirwan R, Lamuela-Raventós RM, Estruch R. Dietary patterns and the risk of obesity, type 2 diabetes mellitus, cardiovascular diseases, asthma, and mental health problems. Crit Rev Food Sci Nutr. 2016; doi:10.1080/10408398.2016.1158690.
18. Pot GK, Richards M, Prynne CJ, Stephen AM. Development of the eating choices index (ECI): a four-item index to measure healthiness of diet. Public Health Nutr. 17:2660–6. doi:10.1017/S1368980013003352.
19. Yaroch AL, Tooze J, Thompson FE, Blanck HM, Thompson OM, Colón-Ramos U, et al. Evaluation of three short dietary instruments to assess fruit and vegetable intake: the National Cancer Institute’s food attitudes and behaviors survey. J Acad Nutr Diet. 2012;112:1570–7. doi:10.1016/j.jand.2012.06.002.
20. Celis-Morales C, Livingstone KM, Marsaux CFM, Forster H, O’Donovan CB, Woolhead C, et al. Design and baseline characteristics of the Food4Me study: a web-based randomised controlled trial of personalised nutrition in seven European countries. Genes Nutr. 2015;10:450. doi:10.1007/s12263-014-0450-2. 21. Fallaize R, Forster H, Macready AL, Walsh MC, Mathers JC, Brennan L, et al.
Online dietary intake estimation: reproducibility and validity of the Food4Me food frequency questionnaire against a 4-day weighed food record. J Med Internet Res. 2014;16:e190. doi:10.2196/jmir.3355. 22. Forster H, Fallaize R, Gallagher C, O’Donovan CB, Woolhead C, Walsh MC,
et al. Online dietary intake estimation: the Food4Me food frequency questionnaire. J Med Internet Res. 2014;16:e150. doi:10.2196/jmir.3105. 23. Schwarzer R, Renner B. Social-cognitive predictors of health behavior: action
self-efficacy and coping self-efficacy. Health Psychol. 2000;19:487–95. doi:10. 1037/0278-6133.19.5.487.
24. Gebhardt WA. The revised health hardiness inventory (RHHI-24): psychometric properties and relationship with self-reported health and health behavior in two Dutch samples. Health Educ Res. 2001;16:579–92. doi:10.1093/her/16.5.579.
25. Honkanen P, Olsen SO, Verplanken B. Intention to consume seafood—the importance of habit. Appetite. 2005;45:161–8. doi:10.1016/j.appet.2005.04.005. 26. Verplanken B, Orbell S. Reflections on past behavior: a self-report index of
habit strength1. J Appl Soc Psychol. 2003;33:1313–30. doi:10.1111/j.1559-1816.2003.tb01951.x.
27. Celis-Morales C, Livingstone KM, Woolhead C, Forster H, O’Donovan CB, Macready AL, et al. How reliable is internet-based self-reported identity, socio-demographic and obesity measures in European adults? Genes Nutr. 2015;10:28. doi:10.1007/s12263-015-0476-0.
28. Marshall SJ, Livingstone KM, Celis-Morales C, Forster H, Fallaize R, O’Donovan CB, et al. Reproducibility of the online Food4Me food-frequency questionnaire for estimating dietary intakes across Europe. J Nutr. 2016;146: 1068–75. doi:10.3945/jn.115.225078.
29. Hoeller U, Baur M, Roos FF, Brennan L, Daniel H, Fallaize R, et al. Application of dried blood spots to determine vitamin D status in a large nutritional study with unsupervised sampling: the Food4Me project. Br J Nutr. 2016; 115:202–11. doi:10.1017/S0007114515004298.
30. Guenther PM, Casavale KO, Reedy J, Kirkpatrick SI, Hiza HABB, Kuczynski KJ, et al. Update of the healthy eating index: HEI-2010. J Acad Nutr Diet. 2013; 113:569–80. doi:10.1016/j.jand.2012.12.016.
31. Estruch R, Ros E, Salas-Salvadó J, Covas M-I, Corella D, Arós F, et al. Primary prevention of cardiovascular disease with a Mediterranean diet. N Engl J Med. 2013;368:1279–90. doi:10.1056/NEJMoa1200303.
32. Hatloy A, Torheim LE, Oshaug A. Food variety–a good indicator of nutritional adequacy of the diet? A case study from an urban area in Mali, West Africa. Eur J Clin Nutr. 1998;52:891–8.
33. Forster H, Walsh MC, O’Donovan CB, Woolhead C, McGirr C, Daly E, et al. A dietary feedback system for the delivery of consistent personalized dietary advice in the web-based multicenter Food4Me study. J Med Internet Res. 2016;18:e150. doi:10.2196/jmir.5620.
34. Albani V, Celis-Morales C, Marsaux CFM, Forster H, O’Donovan CB, Woolhead C, et al. Exploring the association of dairy product intake with the fatty acids C15:0 and C17:0 measured from dried blood spots in a
multipopulation cohort: findings from the Food4Me study. Mol Nutr Food Res. 2016;60:834–45. doi:10.1002/mnfr.201500483.
35. Markussen MS, Veierød MB, Sakhi AK, Ellingjord-Dale M, Blomhoff R, Ursin G, et al. Evaluation of dietary patterns among Norwegian postmenopausal women using plasma carotenoids as biomarkers. Br J Nutr. 2015;113:672–82. doi:10.1017/S0007114514004103.
36. Kaiser HF. A second generation little jiffy. Psychometrika. 1970;35:401–15. doi:10.1007/BF02291817.
37. Bartlett MS. A note on the multiplying factors for various chi-square approximations. J R Stat Soc. 1954;16:296–8. doi:10.2307/2984057. 38. Nguyen G, Gambashidze N, Ilyas SA, Pascu D. Validation of the safety attitudes
questionnaire (short form 2006) in Italian in hospitals in the northeast of Italy. BMC Health Serv Res. 2015;15:284. doi:10.1186/s12913-015-0951-8. 39. Kaiser MJ, Bauer JM, Ramsch C, Uter W, Guigoz Y, Cederholm T, et al.
Validation of the mini nutritional assessment short-form (MNA®-SF): a practical tool for identification of nutritional status. J Nutr Heal Aging. 2009; 13:782–8. doi:10.1007/s12603-009-0214-7.
40. Maïano C, Morin AJS, Lanfranchi M-C, Therme P. The eating attitudes test-26 revisited using exploratory structural equation modeling. J Abnorm Child Psychol. 2013;41:775–88. doi:10.1007/s10802-013-9718-z.
41. Koslowsky M, Scheinberg Z, Bleich A, Mark M, Apter A, Danon Y, et al. The factor structure and criterion validity of the short form of the eating attitudes test. J Pers Assess. 1992;58:27–35. doi:10.1207/s15327752jpa5801_3. 42. JovičićAĐ. Healthy eating habits among the population of Serbia: gender
and age differences. J Health Popul Nutr. 2015;33:76–84.
43. Liao Y, Liu T, Cheng Y, Wang J, Deng Y, Hao W, et al. Changes in eating attitudes, eating disorders and body weight in Chinese medical university students. Int J Soc Psychiatry. 2013;59:578–85. doi:10.1177/0020764012445862. 44. Cebolla A, Barrada JR, van Strien T, Oliver E, Baños R. Validation of the Dutch
eating behavior questionnaire (DEBQ) in a sample of Spanish women. Appetite. 2014;73:58–64. doi:10.1016/j.appet.2013.10.014.
45. Pendergast FJ, Livingstone KM, Worsley A, McNaughton SA. Correlates of meal skipping in young adults: a systematic review. Int J Behav Nutr Phys Act. 2016;13:125. doi:10.1186/s12966-016-0451-1.
46. Nicklas TA, O’Neil CE, Fulgoni VL III. Snacking patterns, diet quality, and cardiovascular risk factors in adults. BMC Public Health. 2014;14:388. doi:10. 1186/1471-2458-14-388.
47. Gardner B, de Bruijn G-J, Lally P. A systematic review and meta-analysis of applications of the self-report habit index to nutrition and physical activity behaviours. Ann Behav Med. 2011;42:174–87. doi:10.1007/s12160-011-9282-0. 48. Naughton P, Mccarthy SN, Mccarthy MB. The creation of a healthy eating
49. Hunot C, Fildes A, Croker H, Llewellyn CH, Wardle J, Beeken RJ. Appetitive traits and relationships with BMI in adults: development of the adult eating behaviour questionnaire. Appetite. 2016;105:356–63. doi:10.1016/j.appet. 2016.05.024.
50. Bully P, Sanchez A, Grandes G, Pombo H, Arietalenizbeaskoa MS, Arce V, et al. Metric properties of the“prescribe healthy life”screening questionnaire to detect healthy behaviors: a cross-sectional pilot study. BMC Public Health. 2016;16:1228. doi:10.1186/s12889-016-3898-8.
51. McCrory MA. Meal skipping and variables related to energy balance in adults: a brief review, with emphasis on the breakfast meal. Physiol Behav. 2014;134:51–4. doi:10.1016/j.physbeh.2014.05.005.
52. Leech RM, Livingstone KM, Worsley A, Timperio A, McNaughton SA. Meal frequency but not snack frequency is associated with micronutrient intakes and overall diet quality in Australian men and women. J Nutr. 2016;146: 2027–34. doi:10.3945/jn.116.234070.
53. Kliemann N, Beeken RJ, Wardle J, Johnson F. Development and validation of the self-regulation of eating behaviour questionnaire for adults. Int J Behav Nutr Phys Act. 2016;13:87. doi:10.1186/s12966-016-0414-6.
54. Staser KW, Zollinger TW, Saywell RM, Kunapareddy S, Gibson PJ, Caine VA. Dietary behaviors associated with fruit and vegetable consumption, Marion County, Indiana, 2005. Prev Chronic Dis. 2011;8:A66.
55. Vega JA, Salazar G, Hodgson MI, Cataldo LR, Valladares M, Obregón AM, et al. Melanocortin-4 receptor gene variation is associated with eating behavior in Chilean adults. Ann Nutr Metab. 2015;68:35–41. doi:10.1159/000439092. 56. Valladares M, Domínguez-Vásquez P, Obregón AM, Weisstaub G, Burrows R,
Maiz A, et al. Melanocortin-4 receptor gene variants in Chilean families: association with childhood obesity and eating behavior. Nutr Neurosci. 2010;13:71–8. doi:10.1179/147683010X12611460763643.
57. Carnell S, Haworth CMA, Plomin R, Wardle J. Genetic influence on appetite in children. Int J Obes. 2008;32:1468–73. doi:10.1038/ijo.2008.127. 58. Andersen LF, Solvoll K, Drevon CA. Very-long-chain n-3 fatty acids as
biomarkers for intake of fish and n-3 fatty acid concentrates. Am J Clin Nutr. 1996;64:305–11.
59. Dahl L, Mæland CA, Bjørkkjær T. A short food frequency questionnaire to assess intake of seafood and n-3 supplements: validation with biomarkers. Nutr J. 2011;10:127. doi:10.1186/1475-2891-10-127.
60. Bowen PE, Garg V, Stacewicz-Sapuntzakis M, Yelton L, Schreiner RS. Variability of serum Carotenoids in response to controlled diets containing six servings of fruits and vegetables per day. Ann N Y Acad Sci. 1993;691: 241–3. doi:10.1111/j.1749-6632.1993.tb26182.x.
61. Greene GW, Resnicow K, Thompson FE, Peterson KE, Hurley TG, Hebert JR, et al. Correspondence of the NCI fruit and vegetable screener to repeat 24-H recalls and serum carotenoids in behavioral intervention trials. J Nutr. 2008;138:200S–4S.
62. Wright J, Sherriff J, Mamo J, Scott J. Validity of two new brief instruments to estimate vegetable intake in adults. Nutrients. 2015;7:6688–99. doi:10.3390/ nu7085305.
63. Thompson FE, Midthune D, Subar AF, Kahle LL, Schatzkin A, Kipnis V. Performance of a short tool to assess dietary intakes of fruits and vegetables, percentage energy from fat and fibre. Public Health Nutr. 2004; 7:1097–105. doi:10.1079/PHN2004642.
64. Thompson FE, Subar AF, Smith AF, Midthune D, Radimer KL, Kahle LL, et al. Fruit and Vegetable Assessment. J Am Diet Assoc. 2002;102:1764–72. doi:10. 1016/S0002-8223(02)90379-2.
65. Serdula M, Coates R, Byers T, Mokdad A, Jewell S, Chávez N, et al. Evaluation of a brief telephone questionnaire to estimate fruit and vegetable consumption in diverse study populations. Epidemiology. 1993;4:455–63. 66. Plaete J, De Bourdeaudhuij I, Crombez G, Steenhuyzen S, Dejaegere L,
Vanhauwaert E, et al. The reliability and validity of short online questionnaires to measure fruit and vegetable intake in adults: the fruit test and vegetable test. PLoS One. 2016;11:e0159834. doi:10.1371/journal.pone.0159834. 67. Stewart-Knox B, Rankin A, Kuznesof S, Poínhos R, Vaz de Almeida MD,
Fischer A, et al. Promoting healthy dietary behaviour through personalised nutrition: technology push or technology pull? Proc Nutr Soc. 2015;74:171–6. doi:10.1017/S0029665114001529.
68. Livingstone KM, Celis-Morales C, Lara J, Woolhead C, O’Donovan CB, Forster H, et al. Clustering of adherence to personalised dietary recommendations and changes in healthy eating index within the Food4Me study. Public Health Nutr. 2016;19:3296–305. doi:10.1017/ S1368980016001932.
69. Celis-Morales C, Livingstone KM, Marsaux CFM, Macready AL, Fallaize R, O’Donovan CB, et al. Effect of personalized nutrition on health-related behaviour change: evidence from the Food4me European randomized controlled trial. Int J Epidemiol. 2016; doi:10.1093/ije/dyw186.
70. Celis-Morales C, Marsaux CF, Livingstone KM, Navas-Carretero S, San-Cristobal R, Fallaize R. et al., Can genetic-based advice help you lose weight? Findings from the Food4Me European randomized controlled trial. 2017;105:1204–13. doi:10. 3945/ajcn.116.145680.
71. Latimer AE, Williams-Piehota P, Katulak NA, Cox A, Mowad L, Higgins ET, et al. Promoting fruit and vegetable intake through messages tailored to individual differences in regulatory focus. Ann Behav Med. 2008;35:363–9. doi:10.1007/s12160-008-9039-6.
• We accept pre-submission inquiries
• Our selector tool helps you to find the most relevant journal
• We provide round the clock customer support
• Convenient online submission
• Thorough peer review
• Inclusion in PubMed and all major indexing services
• Maximum visibility for your research
Submit your manuscript at www.biomedcentral.com/submit