Open Access
Research
Changes in accessibility and preferences predict children's future
fruit and vegetable intake
Elling Bere*
1,2and Knut-Inge Klepp
1,2Address: 1Department of Nutrition, Faculty of Medicine, University of Oslo, Norway and 2Department of Nutrition, Box 1046 Blindern, 0316 Oslo,
Norway
Email: Elling Bere* - [email protected]; Knut-Inge Klepp - [email protected] * Corresponding author
Abstract
Background: Most children eat fewer fruits and vegetables than recommended. To be able to design effective interventions, understanding the aetiology of the behaviour is important. Accessibility and preferences have shown to be strong correlates of fruit and vegetable intake in several cross-sectional studies. The aim of this study was to identify predictors of future fruit and vegetable intake and to explore longitudinal patterns of interactions between accessibility and preferences.
Methods: Data presented are based on baseline (September 2001) and follow-up (May/June 2002) surveys of 20 control schools in the Norwegian intervention study Fruits and Vegetables Make the Marks. A total of 816 pupils (77%) completed both baseline and follow-up questionnaires. The average age of the sample at baseline was 11.8 years. The research instrument assessing potential predictor variables was guided by Social Cognitive Theory, and included Accessibility at home, Accessibility at school, Modelling, Intention, Preferences, Self-Efficacy and Awareness of the 5-a-day recommendations. Multiple regression analyses were performed.
Results: All independent variables (measured at baseline) were significantly correlated to future fruit and vegetable intake (measured at follow-up). When reported fruit and vegetable intake at baseline (past intake) was included in this model, the effect of the other independent variables diminished. Together with past intake, the observed change in the independent variables from baseline to follow-up explained 43% of the variance in the reported intake at follow-up. Past intake remained the strongest predictor, but changes in accessibility at home and at school, as well as changes in preferences for fruits and vegetables, also explained significant amounts of the variance in fruit and vegetable intake at follow-up. In addition, baseline accessibility was found to moderate the relationship between change in preferences and change in intake.
Conclusion: Change in accessibility and preferences appear to be important predictors of future fruit and vegetable intake among school children. Interventions should focus on strategies to modify these factors.
Published: 10 October 2005
International Journal of Behavioral Nutrition and Physical Activity 2005, 2:15 doi:10.1186/1479-5868-2-15
Received: 03 December 2004 Accepted: 10 October 2005
This article is available from: http://www.ijbnpa.org/content/2/1/15
© 2005 Bere and Klepp; licensee BioMed Central Ltd.
Background
Most children eat fewer fruits and vegetables than recom-mended. To be able to design effective interventions, in order to increase fruit and vegetable consumption, it is critical to understand the aetiology of the behaviour. An intervention should aim at changing the strongest deter-minants of the behaviour, in order to be successful [1].
Behavioural theories, like Social Cognitive Theory (SCT) [2], provide frameworks for understanding health behav-iour and can guide the selection of potential determinants [3]. SCT is extensively used when children's fruit and veg-etable intake is the behavioural outcome, and it served as the theoretical framework for four out of five multi-com-ponent intervention studies recently reviewed [4].
Several factors have been suggested as determinants of children's fruit and vegetable intake [5]. Among these fac-tors, accessibility and preferences have been most strongly correlated to intake in several studies [6-8]. These studies have, however, been conducted using cross-sectional designs. This is a limitation as cross-sectional relation-ships could be due to a third antecedent, cannot state cau-sality, and the relationships could be functionally different in longitudinal studies [1]. Longitudinal studies are therefore highly requested in order to prospectively investigate such relationships [1,6,8].
Adolescent fruit and vegetable intake declines with increasing age, but has shown to be stable with respect to the relative intake between individuals [9]. Lien and col-leagues [10] reported that the only significant variable in a longitudinal study investigating the variance in fruit and vegetable intake (at age 21) was past intake (at age 15). Eight percent of the variance in fruit and vegetable intake at age 21 was explained by fruit and vegetable intake at age 15 for boys, and 26% (low SES) and 20% (high SES) for girls [10]. Changes in determinants must, however, explain the variance in future fruit and vegetable intake, in addition to the variance explained by past intake, as the change from past to future intake has to be explained. A change in intake is indeed the ultimate goal for an intervention.
The aim of the present study was to identify predictors of future fruit and vegetable intake, to assess whether these factors predicted future fruit and vegetable intake when controlling for past intake, and to assess whether changes in these factors over time were related to future intake and to the change in intake over time. In addition, a secondary aim was to explore longitudinal patterns of interactions between accessibility and preferences.
Methods
Sample and procedure
Data presented are based on the baseline (September 2001) and follow-up (May/June 2002) surveys of the 20 control schools in the intervention project Fruits and Veg-etables Make the Marks (FVMM). These schools were ran-domly selected from two Norwegian counties, Hedmark and Telemark, and all 6 th and 7 th graders in each school were invited to participate. All schools were public schools, as are most schools in Norway. Informed consent was sought from the children and their parents prior to the study. Ethical approval and research clearance was obtained from The National Committees for Research Ethics in Norway and from The Norwegian Social Science Data Services.
A survey questionnaire was completed by the pupils in the classroom in the presence of a trained project worker. One school-lesson (45 minutes) was used to complete the questionnaire. Out of 1065 eligible pupils, 896 com-pleted the baseline questionnaire. A total of 816 (77%) also completed the follow-up questionnaire: 406 boys and 410 girls (444 6 th graders and 372 7 th graders). The average age of the sample at baseline was 11.8 years.
Instrument
A questionnaire to measure the children's fruit and vege-table intake and potential predictors of intake was devel-oped as part of the FVMM project. Repeated pre-testing, a test-retest study [11,12] and a validation study [11] of the questionnaire were conducted prior to the baseline survey.
The questionnaire items assessing potential predictors were guided by SCT. SCT postulates that behaviour (here fruit and vegetable intake) is a result of environmental and personal factors, but it also states that all three sets of factors affect each other in constant reciprocal relation-ships [2]. The following factors were measured:
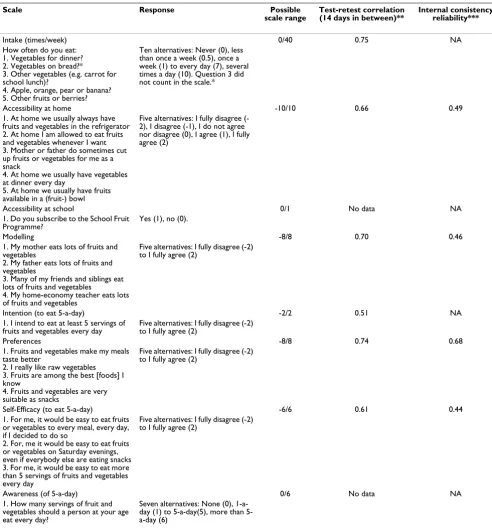
Table 1: Questionnaire items, response alternatives, and reliability coefficients (test-retest correlation and internal consistency reliability) of fruit and vegetable intake and the SCT variables assessed in the FVMM study.
Scale Response Possible
scale range
Test-retest correlation (14 days in between)**
Internal consistency reliability***
Intake (times/week) 0/40 0.75 NA
How often do you eat: 1. Vegetables for dinner? 2. Vegetables on bread?*
3. Other vegetables (e.g. carrot for school lunch)?
4. Apple, orange, pear or banana? 5. Other fruits or berries?
Ten alternatives: Never (0), less than once a week (0.5), once a week (1) to every day (7), several times a day (10). Question 3 did not count in the scale.*
Accessibility at home -10/10 0.66 0.49
1. At home we usually always have fruits and vegetables in the refrigerator 2. At home I am allowed to eat fruits and vegetables whenever I want 3. Mother or father do sometimes cut up fruits or vegetables for me as a snack
4. At home we usually have vegetables at dinner every day
5. At home we usually have fruits available in a (fruit-) bowl
Five alternatives: I fully disagree (-2), I disagree (-1), I do not agree nor disagree (0), I agree (1), I fully agree (2)
Accessibility at school 0/1 No data NA
1. Do you subscribe to the School Fruit Programme?
Yes (1), no (0).
Modelling -8/8 0.70 0.46
1. My mother eats lots of fruits and vegetables
2. My father eats lots of fruits and vegetables
3. Many of my friends and siblings eat lots of fruits and vegetables
4. My home-economy teacher eats lots of fruits and vegetables
Five alternatives: I fully disagree (-2) to I fully agree (2)
Intention (to eat 5-a-day) -2/2 0.51 NA
1. I intend to eat at least 5 servings of fruits and vegetables every day
Five alternatives: I fully disagree (-2) to I fully agree (2)
Preferences -8/8 0.74 0.68
1. Fruits and vegetables make my meals taste better
2. I really like raw vegetables 3. Fruits are among the best [foods] I know
4. Fruits and vegetables are very suitable as snacks
Five alternatives: I fully disagree (-2) to I fully agree (2)
Self-Efficacy (to eat 5-a-day) -6/6 0.61 0.44
1. For me, it would be easy to eat fruits or vegetables to every meal, every day, if I decided to do so
2. For, me it would be easy to eat fruits or vegetables on Saturday evenings, even if everybody else are eating snacks 3. For me, it would be easy to eat more than 5 servings of fruits and vegetables every day
Five alternatives: I fully disagree (-2) to I fully agree (2)
Awareness (of 5-a-day) 0/6 No data NA
1. How many servings of fruit and vegetables should a person at your age eat every day?
Seven alternatives: None (0), 1-a-day (1) to a-1-a-day(5), more than 5-a-day (6)
* Some Norwegians have vegetables on their sandwiches, but usually in small amounts. Therefore, this question was not included in the intake scale. The question was included in the questionnaire so that the participants should not include their vegetables on bread in the 'other vegetables' question.
** Intake: Spearman's r From Andersen and colleagues [11], all other scales: Pearson's r from Bere and Klepp [12]. *** Cronbach's alpha: From Bere and colleagues [6].
A total of seven potentially mediating factors were meas-ured; three environmental and four personal. All ques-tionnaire items included in these seven scales are provided in Table 1, including response alternatives, scale ranges and psychometric properties (test retest correlation and internal consistency reliability [6,11,12]. The envi-ronmental factors were Accessibility at home, Accessibility at school and Modelling. The personal factors were Inten-tion (to eat day), Preferences, Self-Efficacy (to eat 5-a-day) and Awareness (of the 5-a-day recommendation). All scales except Awareness and Accessibility at school included one to five statements with response alternatives ranging from 'I fully disagree' to 'I fully agree.' Awareness (of the 5-a-day recommendation) was measured by one question: 'How many servings of fruit and vegetables should a person your age eat every day?' This question had seven response alternatives ranging from 'None' to 'More than 5 a day.' Accessibility at school was a dichotomous variable assessing whether the pupils subscribed to the Norwegian School Fruit Programme or not. As few Nor-wegian elementary schools have canteens, the only acces-sible fruits and vegetables in most Norwegian schools are through this programme. This programme offers pupils a piece of fruit or a carrot every day at the cost of NOK 2.50 per day (€ 0.30) [13]. All Norwegian elementary schools are offered the chance to participate in this programme. If the school participates, fruit and vegetables are available to the pupils, but it is not accessible to them unless they subscribe to the programme. As the Norwegian School Fruit Programme started in October 2001 in Hedmark and Telemark, no pupils subscribed at baseline (Septem-ber 2001). Thus, the baseline score for all pupils was zero.
Statistics
Missing values on any item were substituted with the mean value for the remaining group on the respective item, if more than 50% of the scale items were answered. A total of 214 pupils had one or more missing values sub-stituted. Multiple regression assumptions regarding
nor-mality, linearity and homoscedasticity were found to be acceptable, and therefore parametric statistics were used. Multiple regressions were performed to determine the explained variance of the children's fruit and vegetable intake and of the change in intake. Pearson's correlation coefficients (r) and standardized regression coefficients (beta) are given for each independent variable. In addi-tion, the unique amount of variance in intake explained by an independent variable is given by the square of the semi-partial correlation (sri2) [14,15]. The square of the multiple correlation (= explained variance) is given by the multiple correlation (R2) and the adjusted multiple corre-lation (adj. R2).
The effect of potential interactions between baseline val-ues of Preferences (dicotomised) and the change in Acces-sibility at home (positive or negative (including 0)), and baseline values of Accessibility at home (dicotomised) and change in Preferences (positive (including 0) or neg-ative) and change in fruit and vegetable intake was assessed by including the respective cross-product terms into linear regression models. These models did also include the dicotomised change in Accessibility or the dicotomised change in Preferences respectively.
Paired sample t-tests were used in the attrition analyses. All analyses were conducted using SPSS version 12.
Results
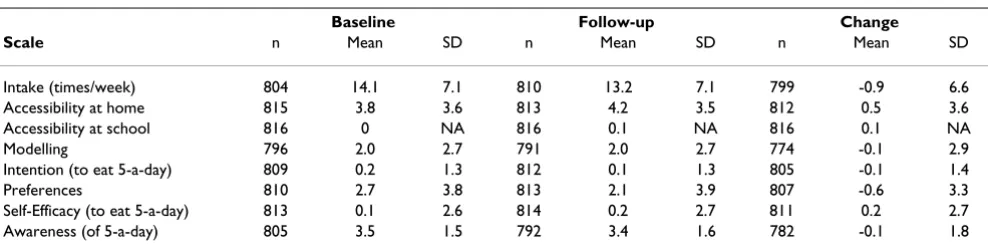
Mean values of intake and the SCT constructs at baseline and follow-up, as well as change scores are presented in Table 2.
Correlates of intake cross-sectionally
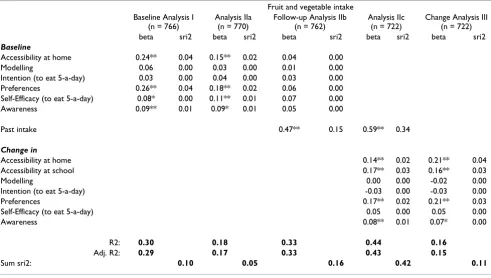
Cross-sectionally, Accessibility at home and Preferences were most strongly correlated to intake (r = 0.43 and 0.45, respectively) (Table 3). At baseline, the independent vari-ables explained 29% (adj. R2) of the variance in intake at baseline (Table 4, analysis I).
Table 2: Baseline, follow-up and change mean scores and standard deviations (SD) of the variables assessed.
Baseline Follow-up Change
Scale n Mean SD n Mean SD n Mean SD
Intake (times/week) 804 14.1 7.1 810 13.2 7.1 799 -0.9 6.6
Accessibility at home 815 3.8 3.6 813 4.2 3.5 812 0.5 3.6
Accessibility at school 816 0 NA 816 0.1 NA 816 0.1 NA
Modelling 796 2.0 2.7 791 2.0 2.7 774 -0.1 2.9
Intention (to eat 5-a-day) 809 0.2 1.3 812 0.1 1.3 805 -0.1 1.4
Preferences 810 2.7 3.8 813 2.1 3.9 807 -0.6 3.3
Self-Efficacy (to eat 5-a-day) 813 0.1 2.6 814 0.2 2.7 811 0.2 2.7 Awareness (of 5-a-day) 805 3.5 1.5 792 3.4 1.6 782 -0.1 1.8
Prediction of future intake
All independent variables (measured at baseline) were sig-nificantly correlated to future intake (measured at follow-up) (Table 3). These variables explained 17% of the vari-ance in the pupils' fruit and vegetable intake at follow-up, with Modelling and Intention as the only non-significant variables (Table 4, analysis IIa). Overall, 5% (sum sri2) of the variance was explained by unique contribution to the explanation, while the remaining 12% was shared vari-ance by two or more concepts. Accessibility at home and Preferences contributed most of the unique variance explained (explaining 2% each).
When reported fruit and vegetable intake at baseline (past intake) was included in the model, none of the other base-line variables remained significant (Table 4, analysis IIb). This model explained 33% of future fruit and vegetable intake. A model with past intake as the only independent variable explained 32% of the variance in future intake (data not shown).
In addition to past intake, the change in the independent variables explained 43% of the variance of follow-up intake, almost all by unique contribution by; past intake (35%), change in Accessibility at home (2%), change in Accessibility at school (3%), change in Preferences (2%) and change in Awareness (1%) (Table 4, analysis IIc).
Correlates of change in intake
The changes in the independent variables were all signifi-cantly correlated to the change in intake (Table 3), and they explained 15% of the variance in the change in intake between baseline and follow-up, with Accessibility at home, Accessibility at school, Preferences and Awareness being significant (Table 4, analysis III). Overall, 11% of the variance was explained by unique contribution to the explanation. Accessibility at home, Accessibility at school and Preferences contributed most of the unique variance explained (4%, 3% and 3%, respectively).
Interaction analyses
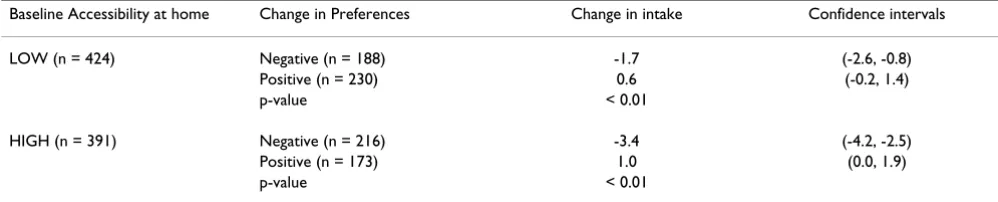
The cross-product of baseline Preferences and change in Accessibility at home was not significant when introduced in the model (p = 0.29). The cross-product of baseline Accessibility and change in Preferences was significant (p = 0.03), and therefore the relationship between change in Preferences and change in intake are presented in Table 5, stratified by baseline Accessibility at home. Table 5 shows that the difference in change in intake between those with positive and negative changes in Preferences was much greater among those with a high baseline Accessibility at home than those with a low accessibility (4.4 vs. 2.3 times/week).
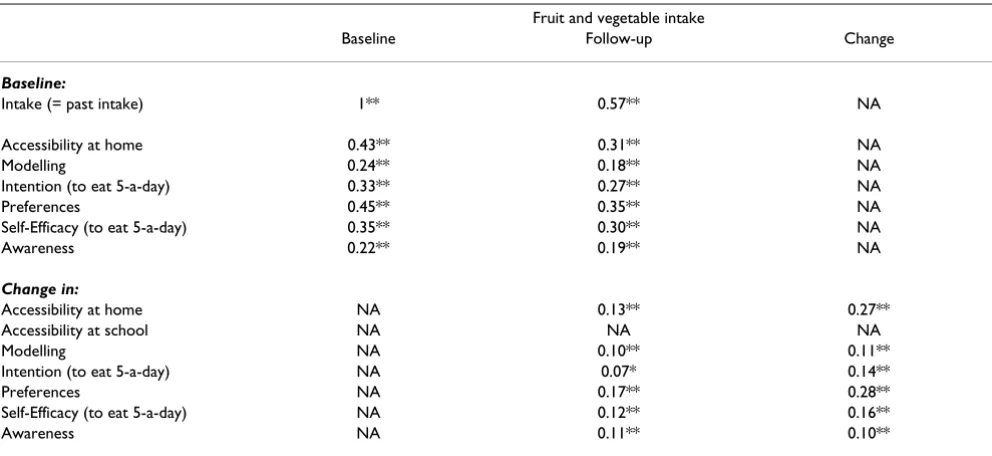
Table 3: Correlation (Pearson's r) between the SCT variables (baseline and change scores) and fruit and vegetable intake (baseline, follow-up and change scores).
Fruit and vegetable intake
Baseline Follow-up Change
Baseline:
Intake (= past intake) 1** 0.57** NA
Accessibility at home 0.43** 0.31** NA
Modelling 0.24** 0.18** NA
Intention (to eat 5-a-day) 0.33** 0.27** NA
Preferences 0.45** 0.35** NA
Self-Efficacy (to eat 5-a-day) 0.35** 0.30** NA
Awareness 0.22** 0.19** NA
Change in:
Accessibility at home NA 0.13** 0.27**
Accessibility at school NA NA NA
Modelling NA 0.10** 0.11**
Intention (to eat 5-a-day) NA 0.07* 0.14**
Preferences NA 0.17** 0.28**
Self-Efficacy (to eat 5-a-day) NA 0.12** 0.16**
Awareness NA 0.11** 0.10**
NA = not applicable * p < 0.05
Attrition analyses
No significant differences were seen between the cohort participants (n = 816) and the baseline-only participants (n = 80) for any of the variables assessed in this study. The pupils with scores on all scales assessed (n = 722, same sample as analyses IIc and III) had higher Preferences than those without follow-up data or without scores on all scales (n = 174, p = 0.05). Of the pupils with scores on all scales, those without missing data (n = 508) did not show different scores on any of the scales compared to pupils with one or more missing values replaced (N = 214).
Discussion
These results from the FVMM project show that changes in Accessibility (at home and at school) and Preferences were correlated to changes in intake, and that these changes explained some of the variance of follow-up fruit and vegetable intake, when controlling for past intake. This suggests that these factors play a role as potential mediators in future intervention studies.
Prospectively, the change in SCT factors explained 15% of the change in intake, and together with past intake, 43% of the variance in future intake. We are not aware of any other studies assessing the prospective nature of fruit and
vegetable predictors in children, and this is more explained variance than what has been reported for adults [16]. The present study contributes to the literature by showing that longitudinal relationships exist between accessibility, preferences and fruit and vegetable intake. Longitudinal relationships are necessary, but however, not a sufficient premise for causality.
While it is a prerequisite that fruits and vegetables are available and accessible, it is not necessarily sufficient to ensure high intake. A recent review of environmental interventions to promote fruit and vegetable consump-tion among youth in school settings reported only three stand-alone environmental interventions [4]. Only one of them was a stand-alone availability study, assessing the effect of a Danish pilot project of a school fruit and vege-table subscription programme [17]. The subscription programme increased 6–10 year old children's intake of fruit among both subscribing and non-subscribing pupils at the intervention schools, with about 0.4 pieces/school day, compared to control schools. The two other stand-alone environmental studies reported significant effects of lowering prices of fruit and vegetable on pupil purchases [18], and of a multi-environmental strategy [19]. In addi-tion, a number of multi-component fruit and vegetable
Table 4: Multiple regressions of fruit and vegetable intake (baseline, follow-up and change) by the SCT variables (baseline and change) including the standardized regression coefficients (beta) and the semi-partial correlation (sri2).
Fruit and vegetable intake Baseline Analysis I
(n = 766)
Analysis IIa (n = 770)
Follow-up Analysis IIb (n = 762)
Analysis IIc (n = 722)
Change Analysis III (n = 722) beta sri2 beta sri2 beta sri2 beta sri2 beta sri2 Baseline
Accessibility at home 0.24** 0.04 0.15** 0.02 0.04 0.00
Modelling 0.06 0.00 0.03 0.00 0.01 0.00
Intention (to eat 5-a-day) 0.03 0.00 0.04 0.00 0.03 0.00 Preferences 0.26** 0.04 0.18** 0.02 0.06 0.00 Self-Efficacy (to eat 5-a-day) 0.08* 0.00 0.11** 0.01 0.07 0.00 Awareness 0.09** 0.01 0.09* 0.01 0.05 0.00
Past intake 0.47** 0.15 0.59** 0.34
Change in
Accessibility at home 0.14** 0.02 0.21** 0.04
Accessibility at school 0.17** 0.03 0.16** 0.03
Modelling 0.00 0.00 -0.02 0.00
Intention (to eat 5-a-day) -0.03 0.00 -0.03 0.00
Preferences 0.17** 0.02 0.21** 0.03
Self-Efficacy (to eat 5-a-day) 0.05 0.00 0.05 0.00
Awareness 0.08** 0.01 0.07* 0.00
R2: 0.30 0.18 0.33 0.44 0.16
Adj. R2: 0.29 0.17 0.33 0.43 0.15
Sum sri2: 0.10 0.05 0.16 0.42 0.11
and multi-behavioural (including fruit and vegetables) interventions were included in this review [4]. These stud-ies did not separately evaluate the availability/accessibility component, and unfortunately, the effect of that compo-nent cannot be stated. More recently, we have evaluated the effect of free participation in the Norwegian School Fruit Programme [13]. Seventh-graders at nine elementary schools were given a piece of fruit or a carrot every school day for a school year for free, and the pupils' mean intake of fruit and vegetables at school increased by about 0.9 portions compared to control pupils [13]. Offering free fruit at school can be seen as increasing the accessibility of fruit and vegetables at school, and this increased accessi-bility clearly led to increased intake. Increasing accessibil-ity is theoretically simple; just offer children fruit and vegetables – at school or at home.
Food preferences have been suggested as determinants for food intake [20], including fruit and vegetable intake [6,8]. Previous research suggests that children's dislike of foods can be transformed into liking of foods with repeated tasting or 'exposure' to those foods [21,22]. It has also been reported that children's food preferences are often guided by taste alone, while food choices of adults also tend to be influenced by nutritional beliefs and atti-tudes toward weight and dieting [20]. However, a few studies have reported that children's preferences for and consumption of disliked vegetables were enhanced when children had opportunities to observe peers selecting and eating those foods, and that adults can also be effective in increasing fruit and vegetable intake by encouraging chil-dren to try new foods [23]. We are, however, not aware of any intervention studies that have increased children's or adolescents' fruit and vegetable intake through increased preferences.
In the present study we also found an interaction between baseline accessibility at home and the relationship between change in preferences and change in intake, indi-cating that baseline accessibility mediate this relationship. For those with high baseline accessibility, changes in
pref-erences were related to significantly larger changes in intake than for those with low baseline accessibility, indi-cating again that high access to fruits and vegetables are extremely important for a sufficient fruit and vegetable intake. This result is in line with previously cross-section-ally reported interactions between accessibility and prefer-ences. Neumark-Stainer et al. [8] found that, in a group of adolescents (mean age 14.9 years), preferences was more related to intake for those with higher levels of accessibil-ity. For those with the lowest accessibility, preferences were not related to intake. Similarly, Cullen and col-leagues [7] found in a group of 4–6 graders that among those with low preferences, both availability and accessi-bility were significant in explaining the variance in fruit and vegetable intake. For those with high preferences, only availability was significant. This again indicates that those with lower preferences need a higher access to fruit and vegetables in order to eat sufficient amounts of fruit and vegetables.
In addition to changes in Accessibility and Preferences, change in Awareness of the 5-a-day recommendations contributed significantly to the explanation of the variance in future fruit and vegetable intake. A change in Awareness also contributed significantly to the explana-tion of variance in the change in intake. Recently, Rey-nolds and colleagues [24] showed that a similar scale was a significant mediator in the High 5 Alabama intervention study (an increase in Awareness explained 9.8% of the increase observed in fruit and vegetable intake). It has also been reported from several countries that several people are not aware of national fruit and vegetable recommen-dations [25-28]. Thus, our results are encouraging, and relevant information about existing 5-a-day recommenda-tions should be included in future intervention studies.
The strength of this study is that it includes a prospective cohort of a rather large random sample of schools. There are, however, also some limitations with the present study. The study was geographically confined to two of Norway's 19 counties. As Norway is a rather
homogene-Table 5: Changes in fruit and vegetable intake (times/week) related to changes in Preferences, stratified by baseline Accessibility at home
Baseline Accessibility at home Change in Preferences Change in intake Confidence intervals
LOW (n = 424) Negative (n = 188) -1.7 (-2.6, -0.8)
Positive (n = 230) 0.6 (-0.2, 1.4)
p-value < 0.01
HIGH (n = 391) Negative (n = 216) -3.4 (-4.2, -2.5)
Positive (n = 173) 1.0 (0.0, 1.9)
ous country, we believe the results are likely to be general-izable to the other counties. A second limitation is the validity of the intake measure as this scale showed a rather low correlation with the validation method [11]. How-ever, the correlation was not lower than found in other studies of same age pupils, and the scale showed good test-retest reliability. A third limitation is that the follow-up period was only 8–9 months. In such a short time span, large changes in fruit and vegetable intake can not be expected. A small change in intake will be a limiting factor for observing relations between change in intake and its determinants. However, due to an age-related decline in fruit and vegetable intake previously observed in Norway [9] and elsewhere in Europe [29], as well as seasonal variations in Norway, the average change in intake was -0.9 times/week (Table 2). Finally, when using observational data, prospective relationships can, as for cross-sectional studies, be due to a third antecedent. Thus we can still not state causality.
Conclusion
Changes in Accessibility and Preferences and Awareness were significantly correlated to changes in reported fruit and vegetable intake, and as hypothesised, these changes also explained added variance in future fruit and vegetable intake when adjusting for past intake. Baseline accessibil-ity was a moderator of the relationship between change in preferences and change in intake. These results point to the potential role of these factors, especially accessibility, as mediators in future fruit and vegetable interventions.
Competing interests
The author(s) declare that they have no competing interests.
Authors' contributions
EB collected and analysed the data and drafted the manu-script. KIK conceived the study, participated in its design and coordination, and provided critical revision of the paper. Both authors have read and approved the final manuscript.
Acknowledgements
This study was funded by the Norwegian Research Council.
References
1. Baranowski T, Lin LS, Wetter DW, Resnicow K, Hearn MD: Theory as mediating variables: why aren't community interventions working as desired? Ann Epidemiol 1997, 7:S89-S95.
2. Bandura A: Social foundations for thought and action: A social cognitive theory Inglewood Cliffs, NJ: Prentice Hall; 1986.
3. MacKinnon DP: Analysis of mediating variables in prevention and intervention research. NIDA Res Monogr 1994, 139:127-153. 4. French SA, Staples G: Environmental interventions to promote vegetable and fruit consumption among youth in school settings. Prev Med 2003, 37:393-610.
5. Baranowski T, Cullen KW, Baranowski J: Psychosocial correlates of dietary intake: Advancing dietary intervention. Annu Rev Nutr 1999, 19:17-40.
6. Bere E, Klepp K-I: Correlates of fruit and vegetable intake among young adolescents – parental and self-reports. Public Health Nutr 2004, 7:991-999.
7. Cullen KW, Baranowski T, Owens E, Marsh T, Rittenberry L, de Moor C: Availability, accessibility, and preferences for fruit, 100% fruit juice, and vegetables influence children's dietary behavior. Health Educ Behav 2003, 30:615-626.
8. Neumark-Sztainer D, Wall M, Perry C, Story M: Correlates of fruit and vegetable intake among adolescents. Findings from Project EAT. Prev Med 2003, 37:198-208.
9. Lien N, Lytle LA, Klepp K-I: Stability in consumption of fruit, vegetables, and sugary foods in a cohort from age 14 to age 21. Prev Med 2001, 33:217-226.
10. Lien N, Jacobs DR Jr, Klepp K-I: Exploring predictors of eating behaviour among adolescents by gender and socio-economic status. Public Health Nutr 2002, 5:671-681.
11. Andersen LF, Bere E, Kolbjørnsen N, Klepp K-I: Validity and repro-ducibility of self-reported intake of fruit and vegetable among 6 th graders. Eur J Clin Nutr 2004, 58:771-777.
12. Bere E, Klepp K-I: Reliability of parental and self-reported determinants of fruit and vegetable intake among 6 th graders. Public Health Nutr 2004, 7:353-356.
13. Bere E, Veierød MB, Klepp K-I: The Norwegian School Fruit Pro-gramme: evaluating paid vs. no-cost subscriptions. Prev Med
2005, 41:463-470.
14. Hankins M, French D, Horne R: Statistical guidelines for studies of the theory of reasoned action and the theory of planned behaviour. Psychol Health 2000, 15:151-161.
15. Tabachnick BG, Fidell LS: Multiple Regression. In Using Multivariate Statistics 4th edition. Edited by: Tabachnick BG, Fiedell LS. Needham Heights, MA: Allyn & Bacon; 2001:110-130.
16. Kvaavik E, Lien N, Tell GS, Klepp K-I: Psychosocial predictors of eating habits among adults in their mid-30s: The Oslo Youth Study follow-up 1991–1999. IJBNPA in press.
17. Eriksen K, Haraldsdottir J, Pederson R, Flyger HV: Effect of a fruit and vegetable subscription in Danish schools. Public Health Nutr 2002, 6:57-63.
18. French SA, Story M, Jeffery RW, Snyder P, Eisenberg M, Sidebottom A, Murray D: Pricing strategy to promote fruit and vegetable purchase in high school cafeterias. J Am Diet Assoc 1997,
97:1008-1010.
19. Perry CL, Bishop DB, Taylor GL, Davis M, Story M, Gray C, et al.: A randomized school trial of environmental strategies to encourage fruit and vegetable consumption among children.
Health Educ Behav 2004, 31:65-76.
20. Drewnowski A: Taste preferences and food intake. Annu Rev Nutr 1997, 17:237-253.
21. Birch LL, Fisher JO: Development of eating behaviors among children and adolescents. Pediatrics 1998, 101:539-549. 22. Wardle J, Cooke LJ, Gibson EL, Sapochnik M, Sheiham A, Lawson M:
Increasing children's acceptance of vegetables; a rand-omized trial of parent-led exposure. Appetite 2003, 40:155-162. 23. Birch LL: Development of food preferences. Annu Rev Nutr 1999,
19:41-62.
24. Reynolds KD, Bishop DB, Chou C-P, Xie B, Nebeling L, Perry CL:
Contrasting mediating variables in two 5-a-day nutrition intervention programs. Prev Med 2004, 39:882-893.
25. Krebs-Smith SM, Cook A, Subar AF, Cleveland L, Friday J: US adults' fruit and vegetable intakes, 1989 to 1991: a revised baseline for the Healthy People 2000 objective. Am J Public Health 1995,
85:1623-1629.
26. Lechner L, Brug J, DeVries H: Misconceptions of fruit and vege-table consumption: Differences between objective and sub-jective estimation of intake. J Nutr Educ 1997, 29:313-320. 27. Parmenter K, Waller J, Wardle J: Demographic variation in
nutri-tion knowledge in England. Health Educ Res 2000, 15:163-174. 28. Bere E: Increasing school-children's intake of fruit and vegetables: Fruits
and Vegetables Make the Marks. Phd thesis University of Oslo: Depart-ment of Nutrition; 2004.