R E S E A R C H
Open Access
Effectiveness of a universal parental
support programme to promote health
behaviours and prevent overweight
and obesity in 6-year-old children in
disadvantaged areas, the Healthy School
Start Study II, a cluster-randomised
controlled trial
Gisela Nyberg
1,2*, Åsa Norman
1, Elinor Sundblom
1,2, Zangin Zeebari
1,2and Liselotte Schäfer Elinder
1,2Abstract
Background:There is increasing evidence for the effectiveness of parental support programmes to promote healthy behaviours and prevent obesity in children, but only few studies have been conducted among groups with low socio-economic status. The aim of this study was to develop and evaluate the effectiveness of a parental support programme to promote healthy dietary and physical activity habits and to prevent overweight and obesity in six-year-old children in disadvantaged areas.
Methods:A cluster-randomised controlled trial was carried out in disadvantaged areas in Stockholm. Participants were six-year-old children (n= 378) and their parents. Thirty-one school classes from 13 schools were randomly assigned to intervention (n= 16) and control groups (n= 15). The intervention lasted for 6 months and included: 1) Health information for parents, 2) Motivational Interviewing with parents and 3) Teacher-led classroom activities with children. Physical activity was measured by accelerometry, dietary intake and screen time with a questionnaire, body weight and height were measured and BMI standard deviation score was calculated. Measurements were conducted at baseline, post-intervention and at 5months follow-up. Group effects were examined using Mixed-effect Regression analyses adjusted for sex, parental education and baseline values.
Results:Fidelity to all three intervention components was satisfactory. Significant intervention effects were found regarding consumption of unhealthy foods (p= 0.01) and unhealthy drinks (p= 0.01). At follow-up, the effect on intake of unhealthy foods was sustained for boys (p= 0.03). There was no intervention effect on physical activity. Further, the intervention had no apparent effect on BMI sds for the whole sample, but a significant difference between groups was detected among children who were obese at baseline (p= 0.03) which was not sustained at follow-up.
(Continued on next page)
* Correspondence:[email protected]
1Department of Public Health Sciences, Karolinska Institutet,
Tomtebodavägen 18 A, 171 77 Stockholm, Sweden
2Centre for Epidemiology and Community Medicine, Stockholm County
Council, Box 1497171 29 Solna, Sweden
(Continued from previous page)
Conclusions:The Healthy School Start study shows that it is possible to influence intake of unhealthy foods and drinks and weight development in obese children by providing individual parental support in a school context. However, the effects were short-lived. Therefore, the programme needs to be prolonged and/or intensified in order to obtain stronger and sustainable effects. This study is an important contribution to the further development of evidence-based parental support programmes to prevent overweight and obesity in children in disadvantaged areas.
Keywords:Physical activity, Diet, Sedentary behaviour, Accelerometer, BMI, Intervention, Socio-economic status, Parental education, Motivational interviewing, Pre-school class
Background
Insufficient physical activity and poor dietary habits are im-portant lifestyle factors causing chronic diseases worldwide, including obesity [1]. Studies show that health-related be-haviours [2–4] and obesity [5] track from childhood to ado-lescence and adulthood. This might lead to serious health consequences later in life, such as metabolic disturbances, type-2 diabetes, cardiovascular diseases, certain cancers and impaired mobility [6]. Furthermore, children of obese parents often develop a similar weight pattern, and low socio-economic status (SES) is one of the strongest determinants [7].
In Sweden, as in many high income countries, there are large social inequalities in dietary habits, physical activity and prevalence of obesity to the disadvantage of children from families with low SES [8, 9]. Children liv-ing in deprived areas have approximately three times greater risk of becoming obese than children living in af-fluent areas [8, 10], pointing to the importance of social factors. Therefore, interventions targeting health-related behaviours and obesity should focus on both social and environmental determinants and start from an early age. Parents and factors in the home environment are im-portant for children’s dietary habits [11–14] and physical activity [15–18]. Moreover, lower SES is associated with poorer eating habits [19]. A Swedish study shows that already from grade 2 (age 8), there are clear differences in eating habits depending on the parents’ educational background [20]. In contrast, most studies done among young children, find no association between parental SES and physical activity [16, 21].
In order to reach all children, irrespective of family background, schools are the preferred setting for health promotion. The effectiveness of school-based programmes can be enhanced by including a parental component [22]. In recent years, evidence has been accumulating for parental support programmes to promote healthy dietary and physical activity habits in school children [23–25]. Furthermore, a number of successful parental support programmes with [26] or without a school component suggest greater effectiveness the lower the age of the par-ticipating child [27]. A review about parental involvement in efforts to improve children’s diet concluded that most
interventions used indirect methods such as sending home newsletters, but that direct approaches such as group education were more likely to be effective [24]. A review of parental support interventions targeting chil-dren’s health behaviours showed that individual counsel-ling with parents was effective in improving children’s dietary habits but less effective in increasing physical activity [27]. The review also showed that in minority groups and groups with low SES, intensive parental sup-port given in group educational settings is promising, but low participation and attrition remain a challenge. More-over, few studies had used an individual counselling approach with parents in disadvantaged groups.
Young children have a limited cognitive capacity for decision making and therefore rely on care-givers. It has been suggested that parental self-efficacy (PSE) impacts child behaviour both directly and indirectly via parenting practices and behaviours, and that PSE may be an appro-priate target for intervention [28]. One way to improve PSE could be through Motivational Interviewing (MI), a method used to support behaviour change [29]. There is evidence that MI may improve dietary and physical activ-ity habits in adults and enhance weight loss in overweight and obese patients [30–32]. Little is yet known of the effectiveness of MI as a way of influencing parents to improve health related behaviours of their children, but studies suggest that MI may increase parents’ understand-ing of their children’s weight problems and their motiv-ation to improve their children’s health habits [33, 34]. MI has also been suggested as a strategy to support construct-ive parenting skills in general [35].
The aim of this study was to evaluate the effectiveness of the 6-month Healthy School Start parental support programme targeting dietary habits, physical activity and body weight of six-year-old children in families with low socio-economic status in the school context.
Methods
cluster-randomised controlled trial with waiting-list control group. The unit of randomisation was pre-school class. Schools were chosen from low income areas in a municipality in Stockholm County, Sweden, with the highest prevalence of overweight and obesity among children in the county [38]. These areas are characterised by a high proportion of foreign-born citizens. This study involved 378 six-year-old children in pre-school class.
Figure 1 shows participant recruitment and retention. Of the 15 eligible schools (n= 801 children) in three low-income areas, 13 schools and 31 pre-school classes partici-pated. All families who had children in these classes were invited to participate in the study. The classes were randomly assigned to intervention (n= 16) or waiting-list control group (n= 15) after baseline measurement. Each class was assigned a number which was drawn randomly from a basket by an independent person in the presence of the research team. Every other school class was assigned to the intervention group. The children were re-cruited in August to September 2012, the intervention started in October and lasted for six months (2012–2013). Pre-school class is not compulsory in Sweden but 90–95 % of all six-year-old children attend.
Written consent was collected from all parents of par-ticipating children. The study was approved by the
Regional Ethical Review Board in Stockholm, Sweden (2012/877–31/5) on the 14thof June, 2012. The trial has been registered: ISRCTN39690370.
Theory
It is widely recommended that programme design should be based on theory [39] where a theoretical framework supports the identification of the causal chain and possible mediators. Social cognitive theory (SCT) explains behav-iour as a reciprocal interaction between person, behavbehav-iour, and environmental factors [40, 41]. A central construct in SCT is self-efficacy, a person’s belief in his or her ability to successfully perform a certain action. In this programme we targeted parental self-efficacy (PSE), which refers to a parents’ belief in his or her own ability to perform spe-cific action for example serving vegetables to each meal eaten at home. Other important constructs in the SCT, relevant for our intervention, are observational learning, behavioural capability, outcome expectations and self-regulation. In this programme PSE, parental knowledge, attitude, preference, care and control, role modelling and willingness to change were identified as potential media-tors of change regarding children’s dietary and physical activity habits and weight development. Based on this ana-lysis, three intervention components were defined and
materials developed according to the steps of intervention research relevant to this study [42]. The intervention com-ponents were: 1) A brochure with health information tar-geting parental knowledge; 2) Motivational interviewing targeting parental self-efficacy, willingness to change and care and control; and 3) classroom activities targeting chil-dren’s knowledge, attitudes and preferences and indirectly parental role modelling. A study protocol has been pub-lished describing this in more detail [37].
Intervention components
Health information
A brochure was developed based on a literature review [43] with the aim of increasing parental knowledge re-garding how to promote children’s healthy dietary and physical activity habits. The brochure contains facts and advice for parents within seven areas: 1) parental feeding practices; 2) healthy food and family meal times; 3) physical activity; 4) sweets, snacks, ice-cream and soft drinks; 5) fruit and vegetables; 6) physical inactivity, screen time, and commercials; 7) sleep. The brochure is written in basic, easy-to-read Swedish with many illus-trations. The brochure was translated into Arabic and Somali, the two most common languages in the inter-vention area and checked by two Arabic and Somali speaking persons and thereafter revised. The brochure was sent home to parents. Group meetings were offered once at each school, giving parents an opportunity to discuss the content of the brochure with two research assistants.
Motivational interviewing
MI was used to target PSE to support healthy eating and physical activity for the child, parental care and control, and stimulate parental willingness to change. MI is a client-centred, goal-oriented communication style de-signed to strengthen personal motivation for a specific behaviour change [29]. In MI, self-efficacy is a central part of motivation and is therefore focusing on ensuring that a person has high self-efficacy for changing a spe-cific behaviour.
Parents in the intervention group were offered two in-dividual sessions of MI without the presence of the child. Two MI counsellors performed the sessions, which lasted for approximately 45 min. The parents met the same MI counsellor both times. During the first MI session, the parents used an agenda-setting tool to choose a target behaviour involving their child’s diet or physical activity that they wanted to change. This behav-iour was subsequently explored together with the MI counsellor and the parent set a goal related to the target behaviour to work on at home until the second MI ses-sion, which served as a follow-up. The second session was offered either face-to-face or over the telephone at
the parent’s choice. The MI sessions provide the most intense parental support and are therefore hypothesised to be the component of the Healthy School Start inter-vention with greatest impact on outcome.
Classroom activities
The aim of the classroom component was to increase chil-dren’s knowledge, influence their attitudes and prefer-ences, and indirectly support parental role modelling. A teacher’s manual and a workbook for children were devel-oped to facilitate the classroom activities, which were related to the different areas in the brochure sent home to parents. The materials were developed together with teachers and inspired by earlier school interventions [44, 45]. Before the start of the intervention, the work-books were read and commented on by eleven parents of grade 1 children in two of the participating schools. The manuals were tested by four teachers in the par-ticipating schools.
The children were exposed to ten 30-min teacher-led sessions. The teachers were provided with a tool-box containing culturally appropriate images of common food products such as baklava, olives and bulgur wheat, and used the teaching manual for each session. After most sessions, the children were given homework to dis-cuss and complete together with their parents. Back in the classroom, the teachers and children summarised the homework, so that each theme was repeated.
Control classes were offered the entire programme after the follow-up measurements were completed.
Implementation strategies
The following implementation strategies were used: Schools: The principals in each school signed a con-tract with the research group specifying the obligations and commitments of the schools and the research team.
MI counsellors: The two MI counsellors had training and professional experience of MI and met a satisfactory level of MI competence according to the Motivational Interviewing Treatment Integrity (MITI 3.0) Code [46] at the time of recruitment. The counsellors received additional training and were supervised nine times dur-ing the intervention by a member of the Motivational Interviewing Network of Trainers and part of the re-search team (ÅN). Supervision focused on the counsel-lors’ experiences and difficulties when performing MI with the parents and also included systematic feedback and MITI-coding on audiotaped MI sessions.
Parents: Parents were informed about the project at the first regular information meeting in school. When the intervention had started, an additional meeting was offered at each school for parents in the intervention group, where they could discuss issues related to diet and physical activity.
Outcome evaluation
Data were collected at baseline between August and September 2012 (T1), directly after the intervention be-tween April and May 2013 (T2) and at follow-up five months after the intervention, between September and October 2013 (T3).
Physical activity by accelerometry
Physical activity was objectively assessed using accelero-metry (GT3X+, Actigraph, LCC, Pensacola, USA). This method has been used in many studies to measure phys-ical activity in children and is considered valid and reli-able [47, 48]. The accelerometers were worn on a belt at the right hip for seven consecutive days. The children were instructed to wear the monitors during waking hours and to remove them for activities involving water.
The software ActiLife Data Analysis, version 6.5.2., was used to analyse the accelerometer data. Physical ac-tivity was assessed between 7 am and 9 pm and was cal-culated for the whole week and during weekends. Children who provided at least 500 min of activity regis-tration per day for a minimum of two days, including at least one weekend day, were included in the analyses. Data were defined as non-wear time and excluded if se-quences showed 10 or more consecutive minutes of zero counts. The epoch length was set to 15 s. The threshold for sedentary intensity was defined as all activity below 100 cpm [49, 50], moderate to vigorous intensity was de-fined as all activity above 2000 cpm. The threshold for moderate intensity corresponds to a walking pace of about 4 km/h (3 METS) in children [51].
Health behaviours by parent report
Dietary indicators (fruit, vegetables and energy-dense products), physical activity habits, sedentary behaviour and sleep were measured through a validated parent-proxy questionnaire, the Eating and Physical Activity Questionnaire (EPAQ) [52], which was translated into Swedish and to some extent adapted to a Swedish context. Parents were asked to recall the child’s intake of selected indicator foods (snacks, sweets/chocolate, ice-cream, cakes/buns/cookies, fruits, vegetables, soft drink, flavoured milk and fruit juice) the previous weekday. For each food item the parent marked the number of serv-ings on a scale with 7 categories: 0, 0.5, 1, 2, 3, 4, 5. For drink items the categories were: 0, 1, 2, 3, 4, 5, 6 or more servings. Servings were defined as: drinks = 1.5 dl,
vegetables = e.g. 2 dl grated carrots/cabbage or a big tomato or 2–3 broccoli stalks, fruit = e.g. a small apple or about 10 grapes, snacks = 1.5 dl crisps or cheese doodles, sweets = about 1.5 dl of sweets or 4 pieces from a chocolate bar, cakes = a small bun or 5 small biscuits, ice-cream = a small popsicle stick or 1 dl ice-cream. The questionnaire has previously been validated against 24-h dietary recall in two to five-year-old children and showed significant Spearman rank correlations for different items ranging from 0.57 to 0.88 [52]. The Swedish language in the ques-tionnaire was pre-tested by eleven parents of grade 1 children in two of the participating schools and the language was simplified where necessary. The EPAQ was distributed by mail to the parents and only avail-able in Swedish. Parents were offered help to fill in the questionnaires on one occasion at each school.
Anthropometry
Height, weight and waist circumference measurements were performed in schools by two trained research assistants according to standardised procedures [37]. BMI was calculated as weight (kg) divided by height (m) squared. Overweight and obesity were defined according to the International Obesity Task Force rec-ommendations [53]. BMI standard deviation score (BMI sds) was calculated according to a Swedish ref-erence standard [54].
Socio-economic status
Area of residence and parental educational level were used as indicators of SES [55, 56]. The study was con-ducted in three areas in Stockholm County with low em-ployment and low educational level. These areas are also targeted specifically by the government to support socio-economic development [57]. Parental educational level was self-reported and the highest level of education attained by either of the parents was used as an indicator of SES. The variable was dichotomised with low educa-tion corresponding to primary and secondary school (≤12 years of schooling) and high (>12 years of school-ing) corresponding to third level education.
Region of birth
Parents were also asked to indicate their region of birth as “Sweden/the Nordic region”, “Europe” or “Outside Europe”. It was also possible to specify the country.
Process evaluation
workbooks and also documented how much time they had spent on each session. Fidelity to MI was measured through coding of sessions. All MI sessions were audio-recorded and each counsellor had eight sessions coded according to MITI 3.0 [46] by reliable coders at a uni-versity coding lab (MIC-Lab, Stockholm). Mean values on the MI behaviours measured by the MITI were calcu-lated for each MI counsellor and compared to threshold values for acceptable delivery of MI.
The teachers in the control classes were continuously asked to document if they had engaged in any organised healthy lifestyle activities during the intervention, in order to monitor possible contamination.
Statistical analyses
Descriptive data at baseline were analysed using the SPSS 22.0 software package (Chicago, Illinois, USA). Significance-testing for differences between intervention and control group at baseline was performed through in-dependent sample t-test or Chi-square/Mann-Whitney U-Test. All children who had agreed to participate in the intervention were included in the analysis on an intention to treat basis. Analyses were also performed per protocol where families participating in one or two MI session were compared to the control group.
Prior to analyses, half-servings of the dietary indicators were slightly modified to fit a Poisson distribution by merging half-servings with single-servings. A sensitivity analysis was performed where half-servings were merged with zero-servings, with no differences in results. We also created aggregated variables indicating unhealthy foods (snacks, sweets/chocolate, ice-cream, cakes/buns/ cookies), healthy foods (fruit and vegetables) and un-healthy drinks (soft drink, flavoured milk and fruit juice above one serving) to analyse food patterns. When ag-gregating the separate variables we used the original values, containing half-servings, in order to retain as much information as possible. After aggregation, an adjustment of the half-servings was made by merging them with the closest upper discrete value. Sensitivity as-sessment was performed by merging half-servings with the closest lower discrete value, which gave similar results. School class was used as unit of randomisation and therefore Mixed-effect Regression analyses [58] with two levels (individual and school class) were undertaken to estimate the intervention effects. For continuous out-comes (total physical activity during the week and week-end (TPA), time spent in moderate to vigorous physical activity during the week and weekend (MVPA), time spent sedentary during the week and weekend, screen time, BMI sds) Mixed Linear Regression was performed. For count outcomes (servings of juice, soft drink, flavoured milk, vegetables, snacks, fruits, sweets, cakes and ice-cream consumed on the previous day) Mixed
Poisson Regression was performed. The statistical soft-ware MLwiN (version 2.31, 2014, Bristol University) was used. Level of significance was set to p < 0.05.
In order to detect significant changes between the groups after the intervention and to see if the changes were maintained at follow-up we compared the measure-ment at baseline (T1) to the measuremeasure-ment after the inter-vention (T2) and then compared T1 with the follow up measurement (T3). At the latter analysis, we excluded those individuals who did not have values at T2 in order to perform both comparisons (T1-T2 and T1-T3) on the same individuals.
We first tested a crude model for all outcomes at T2 or T3 with group as the predictor and adjusted for base-line values of the relevant outcome. In a second step, sex and parental education were added to the model. Interaction between group and sex or group and paren-tal education were tested and analyses were stratified if significant interaction terms were found. Regarding physical activity (TPA, MVPA and time spent sedentary) outcomes were also adjusted for accelerometer monitor wear time. In the case of sedentary outcomes (week and weekend) the outcomes were adjusted for MVPA during the same period [59]. Since 80.4 % of the parents were born outside the Nordic region, we also tested the models by adjusting for region of birth (a dichotomous variable: Nordic/outside Nordic). Region of birth was not significant in any of the analyses and was therefore not used in the final models. Lastly, a random intercept for school class clustering was tested to detect differ-ences between the clusters. To assess the fit of the model, we compared−2 Log Likelihood values between the model with fixed main effects and the model where the random intercept was included. A sensitivity analysis was undertaken for significant outcomes (unhealthy foods and unhealthy drinks, cakes/buns/cookies, and BMI sds) where baseline values were imputed for miss-ing data at T2 or T3.
The power calculation for this study was based on the assumption of an average 20 % increase of physical activ-ity assessed by accelerometry in the intervention group. The estimated sample size was calculated for a two-sided test with the significance level of 0.05 and power was set to 90 % using a sample size calculator for cluster randomised trials [60]. The calculation showed that 12 school classes with a participation rate of 60 % in each class, approximately 144 children in total, were needed to detect a 20 % increase in physical activity between the intervention and control groups.
Results
Families classified as having low parental education comprised 47.1 % of the total sample. Of all the parents, 80.4 % were born outside of the Nordic region with Iraq, Eritrea, Somalia, Iran and Turkey as the most common countries of birth.
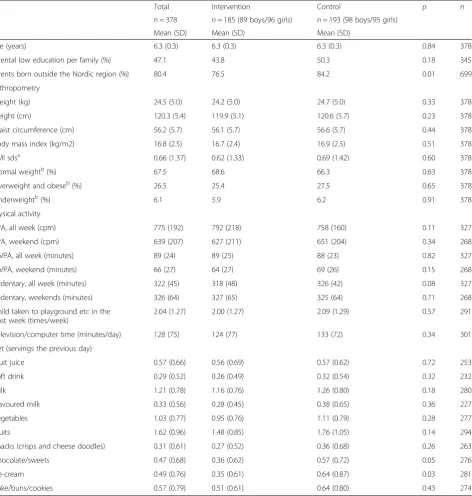
Table 1 shows descriptive data and results of inde-pendent sample t-test and Chi-square-test at baseline.
There were no significant baseline differences be-tween the groups, except for intake of ice-cream, chocolate and sweets; with children in the control group consuming significantly more than those in the intervention group. Also, the proportion of parents born outside of the Nordic region was higher in the control group.
Table 1Descriptive characteristics of children at baseline categorised by intervention and control group
Total Intervention Control p n
n= 378 n= 185 (89 boys/96 girls) n= 193 (98 boys/95 girls)
Mean (SD) Mean (SD) Mean (SD)
Age (years) 6.3 (0.3) 6.3 (0.3) 6.3 (0.3) 0.84 378
Parental low education per family (%) 47.1 43.8 50.3 0.18 345
Parents born outside the Nordic region (%) 80.4 76.5 84.2 0.01 699
Anthropometry
Weight (kg) 24.5 (5.0) 24.2 (5.0) 24.7 (5.0) 0.33 378
Height (cm) 120.3 (5.4) 119.9 (5.1) 120.6 (5.7) 0.23 378
Waist circumference (cm) 56.2 (5.7) 56.1 (5.7) 56.6 (5.7) 0.44 378
Body mass index (kg/m2) 16.8 (2.5) 16.7 (2.4) 16.9 (2.5) 0.51 378
BMI sdsa 0.66 (1.37) 0.62 (1.33) 0.69 (1.42) 0.60 378
Normal weightb(%) 67.5 68.6 66.3 0.63 378
Overweight and obeseb(%) 26.5 25.4 27.5 0.65 378
Underweightb(%) 6.1 5.9 6.2 0.91 378
Physical activity
TPA, all week (cpm) 775 (192) 792 (218) 758 (160) 0.11 327
TPA, weekend (cpm) 639 (207) 627 (211) 651 (204) 0.34 268
MVPA, all week (minutes) 89 (24) 89 (25) 88 (23) 0.82 327
MVPA, weekend (minutes) 66 (27) 64 (27) 69 (26) 0.15 268
Sedentary, all week (minutes) 322 (45) 318 (48) 326 (42) 0.08 327
Sedentary, weekends (minutes) 326 (64) 327 (65) 325 (64) 0.71 268
Child taken to playground etc in the past week (times/week)
2.04 (1.27) 2.00 (1.27) 2.09 (1.29) 0.57 291
Television/computer time (minutes/day) 128 (75) 124 (77) 133 (72) 0.34 301
Diet (servings the previous day)
Fruit juice 0.57 (0.66) 0.56 (0.69) 0.57 (0.62) 0.72 253
Soft drink 0.29 (0.52) 0.26 (0.49) 0.32 (0.54) 0.32 232
Milk 1.21 (0.78) 1.16 (0.76) 1.26 (0.80) 0.18 280
Flavoured milk 0.33 (0.56) 0.28 (0.45) 0.38 (0.65) 0.36 227
Vegetables 1.03 (0.77) 0.95 (0.76) 1.11 (0.79) 0.28 277
Fruits 1.62 (0.96) 1.48 (0.85) 1.76 (1.05) 0.14 294
Snacks (crisps and cheese doodles) 0.31 (0.61) 0.27 (0.52) 0.36 (0.68) 0.26 263
Chocolate/sweets 0.47 (0.68) 0.36 (0.62) 0.57 (0.72) 0.05 276
Ice-cream 0.49 (0.76) 0.35 (0.61) 0.64 (0.87) 0.03 281
Cake/buns/cookies 0.57 (0.79) 0.51 (0.61) 0.64 (0.80) 0.43 274
p= between intervention and control groups
BMI sdsbody mass index standard deviation score,TPAtotal physical activity,cpmcounts per minute,MVPAmoderate to vigorous physical activity
a
Defined according to Karlberg et al. 2001
b
Diet
The parental response rate to the questionnaire measur-ing dietary intake ranged from 78 to 60 % for the differ-ent items at baseline, between 75 and 59 % at T2 and between 72 and 59 % at T3. At baseline 70 % of the par-ticipating children consumed at least 2 servings of fruit and vegetables daily at home. Forty percent of the chil-dren consumed at least one serving of unhealthy foods daily, at baseline.
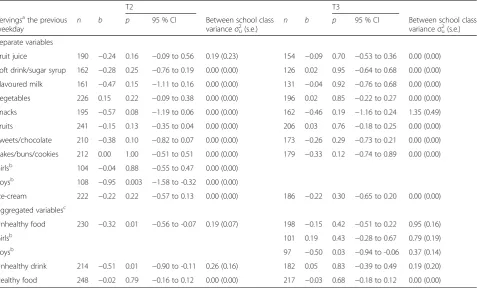
Regarding intake of indicator foods, we found signifi-cant intervention effects on outcomes related to intake of unhealthy foods and drinks (Table 2). At T2 the inter-vention group had a significantly lower intake of un-healthy foods (aggregated variable: snacks, ice-cream, cookies and sweets) (p= 0.01). This effect was sustained in boys at T3 (p= 0.03). Intake of unhealthy drinks (ag-gregated variable: soft drink, flavoured milk and fruit juice above 1 serving) at T2 was significantly lower in
the intervention group (p= 0.01) compared to the con-trol group. This effect was not sustained at T3.
When each indicator food was assessed separately, an interaction effect with group and sex was found regard-ing intake of cakes/buns/cookies: boys in the interven-tion group had significantly lower intake at T2 compared to boys in the control group (p= 0.003). The differences were no longer significant at T3.
We noted a trend towards lower intake of all separate unhealthy food and drink outcomes in the intervention at T2, although none of them were significant. This trend was still visible at T3 for unhealthy foods but not for unhealthy drinks.
Regarding intake of healthy foods (aggregated variable: fruit and vegetables) we saw no significant differences between intervention and control groups either on the aggregated variable or the separate outcomes for fruit and vegetables.
Table 2Effects of intervention on dietary intake of indicator foods at T2 and T3
T2 T3
Servingsathe previous
weekday n b p
95 % CI Between school class varianceσu2(s.e.)
n b p 95 % CI Between school class
varianceσu2(s.e.)
Separate variables
Fruit juice 190 −0.24 0.16 −0.09 to 0.56 0.19 (0.23) 154 −0.09 0.70 −0.53 to 0.36 0.00 (0.00)
Soft drink/sugar syrup 162 −0.28 0.25 −0.76 to 0.19 0.00 (0.00) 126 0.02 0.95 −0.64 to 0.68 0.00 (0.00)
Flavoured milk 161 −0.47 0.15 −1.11 to 0.16 0.00 (0.00) 131 −0.04 0.92 −0.76 to 0.68 0.00 (0.00)
Vegetables 226 0.15 0.22 −0.09 to 0.38 0.00 (0.00) 196 0.02 0.85 −0.22 to 0.27 0.00 (0.00)
Snacks 195 −0.57 0.08 −1.19 to 0.06 0.00 (0.00) 162 −0.46 0.19 −1.16 to 0.24 1.35 (0.49)
Fruits 241 −0.15 0.13 −0.35 to 0.04 0.00 (0.00) 206 0.03 0.76 −0.18 to 0.25 0.00 (0.00)
Sweets/chocolate 210 −0.38 0.10 −0.82 to 0.07 0.00 (0.00) 173 −0.26 0.29 −0.73 to 0.21 0.00 (0.00)
Cakes/buns/cookies 212 0.00 1.00 −0.51 to 0.51 0.00 (0.00) 179 −0.33 0.12 −0.74 to 0.89 0.00 (0.00)
Girlsb 104 −0.04 0.88 −0.55 to 0.47 0.00 (0.00)
Boysb 108 −0.95 0.003 −1.58 to -0.32 0.00 (0.00)
Ice-cream 222 −0.22 0.22 −0.57 to 0.13 0.00 (0.00) 186 −0.22 0.30 −0.65 to 0.20 0.00 (0.00)
Aggregated variablesc
Unhealthy food 230 −0.32 0.01 −0.56 to -0.07 0.19 (0.07) 198 −0.15 0.42 −0.51 to 0.22 0.95 (0.16)
Girlsb 101 0.19 0.43 −0.28 to 0.67 0.79 (0.19)
Boysb 97 −0.50 0.03 −0.94 to -0.06 0.37 (0.14)
Unhealthy drink 214 −0.51 0.01 −0.90 to -0.11 0.26 (0.16) 182 0.05 0.83 −0.39 to 0.49 0.19 (0.20)
Healthy food 248 −0.02 0.79 −0.16 to 0.12 0.00 (0.00) 217 −0.03 0.68 −0.18 to 0.12 0.00 (0.00)
Results of Mixed Poisson Regression adjusted for sex, parental education and baseline value
b= Regression coefficient (beta),p= between intervention and control groups, CI = 95 % confidence interval
a
Serving sizes (examples below) Drinks = 1.5 dl
Vegetables = 2 dl grated carrots/cabbage or a big tomato or 2-3 broccoli stalks Fruits = a small apple or a bunch of grapes (about 10)
Snacks = 1.5 dl of crisps or cheese doodles
Sweets = about 1.5 dl of sweets or 4 pieces from a chocolate bar Cakes = a small bun or 5 small biscuits
Ice-cream = a small popsicle stick or 1 dl ice-cream
b
Stratified analysis due to interaction effect (group × sex)
c
Aggregated variables: unhealthy foods (snacks, sweets/chocolate, ice-cream, cakes/buns/cookies), healthy foods (fruit and vegetables) and unhealthy drinks (soft drink, flavoured milk and fruit juice above one serving)
All effects regarding intake of indicator foods at T2, un-healthy foods (aggregated variable), unun-healthy drinks (ag-gregated variable), as well as the interaction effect on boys regarding cakes/buns/cookies (separate variable), were sus-tained in the sensitivity analyses after imputation of missing values. The same was true for the interaction effect on boys’ intake of unhealthy foods (aggregated variable) at T3.
No interaction effects between group and parental education were found for any of the dietary outcomes.
Physical activity
The number of children who fulfilled the required level of at least 2 days (including one weekend day) of valid accel-erometer data was 327 at baseline, 294 at T2 and 290 at T3. At baseline 290 (89 %) children reached 60 min of MVPA.
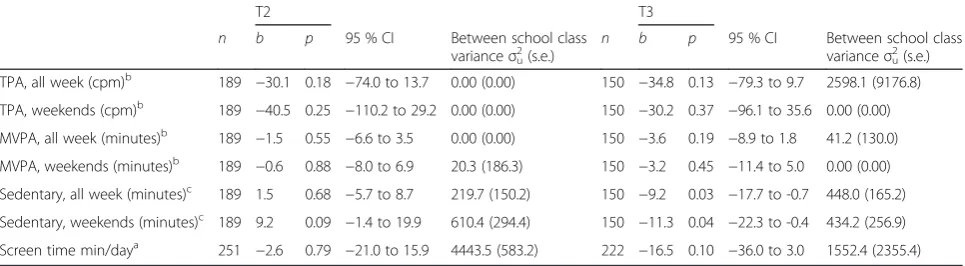
As shown in Table 3, no significant intervention effect was detected on any of the measurements of physical ac-tivity (TPA, MVPA, time spent sedentary and screen time) at T2.
At T3, significant intervention effects were detected in terms of time spent sedentary: the intervention group was sedentary 9.2 min less during the entire week (p= 0.03) and 11.3 min less during the weekend (p= 0.04). However, these effects were not sustained in the sensitivity analysis.
No interaction effects between group and parental edu-cation or group and sex were found for any of the physical activity outcomes.
BMI
Measurements on height, weight and waist circumfer-ence were performed on all (378) children at baseline, 359 at T2 and 345 at T3. There were no significant dif-ferences in BMI status in drop-outs between interven-tion and control group.
No significant intervention effect was detected for BMI sds at T2 or T3 (Table 4). However, a stratified analysis on weight status showed a significant intervention effect on
children categorised as obese at baseline (n= 41). Children in the intervention group had significantly lower BMI sds (-0.21 BMI sds) at T2 (p= 0.03) compared to obese chil-dren in the control group. This effect was stable in the sensitivity analysis but not sustained at T3 although the direction was still negative.
No interaction effects between group and parental education or group and sex were found regarding BMI.
Per protocol analyses
Analyses including only families participating in 1 (n= 147) or both MI sessions (n= 86) compared to the control group gave essentially the same results as presented above.
Process evaluation
All parents who attended the first MI session said they had read the brochure. Eleven group meetings with par-ents were undertaken where 45 parpar-ents participated.
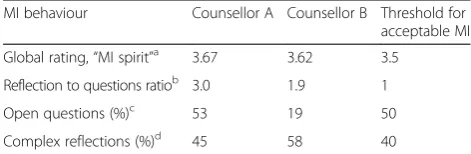
The first MI session was performed with 146 parents (79 %) of whom 65 % were mothers, 31 % were fathers and 4 % participated as a couple. In the second session, 86 of the initial 146 parents participated. The level of MI delivered by the MI counsellors was satisfactory and is presented in Table 5.
In the 13 classes which reported their work with the classroom component, teachers spent on average 33 min on each lesson, ranging from 20 to 150 min. Eleven clas-ses performed all 10 lessons, 4 clasclas-ses performed 9 les-sons, and 1 class performed 8 lessons. Regarding the home assignments in the work book, 12 of the 16 inter-vention classes completed all 9 of the assignments, 1 class completed 8 assignments and 3 classes completed 1 to“a few”of the home assignments. However, the data do not show whether the assignments were completed at home, as intended, or at school.
As documented by teachers, control classes did not conduct any other organised healthy lifestyle activities in the control classes.
Table 3Effects of the intervention on physical activity levels at T2 and T3
T2 T3
n b p 95 % CI Between school class varianceσu
2
(s.e.)
n b p 95 % CI Between school class varianceσu
2
(s.e.)
TPA, all week (cpm)b 189
−30.1 0.18 −74.0 to 13.7 0.00 (0.00) 150 −34.8 0.13 −79.3 to 9.7 2598.1 (9176.8) TPA, weekends (cpm)b 189
−40.5 0.25 −110.2 to 29.2 0.00 (0.00) 150 −30.2 0.37 −96.1 to 35.6 0.00 (0.00) MVPA, all week (minutes)b 189
−1.5 0.55 −6.6 to 3.5 0.00 (0.00) 150 −3.6 0.19 −8.9 to 1.8 41.2 (130.0) MVPA, weekends (minutes)b 189
−0.6 0.88 −8.0 to 6.9 20.3 (186.3) 150 −3.2 0.45 −11.4 to 5.0 0.00 (0.00) Sedentary, all week (minutes)c 189 1.5 0.68
−5.7 to 8.7 219.7 (150.2) 150 −9.2 0.03 −17.7 to -0.7 448.0 (165.2) Sedentary, weekends (minutes)c 189 9.2 0.09
−1.4 to 19.9 610.4 (294.4) 150 −11.3 0.04 −22.3 to -0.4 434.2 (256.9) Screen time min/daya 251
−2.6 0.79 −21.0 to 15.9 4443.5 (583.2) 222 −16.5 0.10 −36.0 to 3.0 1552.4 (2355.4)
Results of Mixed Linear Regression adjusted fora
sex, parental education, baseline value,b
monitor wear timec
and MVPA
b= Regression coefficient (beta),p= between intervention and control groups, CI = 95 % confidence interval
Discussion
This study evaluated the effectiveness of the Healthy School Start parental support programme to promote healthy dietary habits and physical activity in children from families with low SES and a high proportion of foreign-born citizens. The results show an intervention effect on outcomes related to intake of unhealthy foods and drinks. There was no intervention effect on physical activity and BMI sds for the whole group. However, BMI sds decreased significantly among obese children. The decrease in consumption of unhealthy foods among boys was sustained at 5 months follow-up. Fidelity to the programme was satisfactory for all three intervention components although only 79 % of the parents partici-pated in the first MI session and 47 % in the second.
Diet
Our results showed a significantly decreased intake of unhealthy food and drinks by children in the interven-tion group. At follow-up, this effect was sustained for
boys. No effect was found on fruit or vegetable intake. This may be explained by high intake at baseline, when 70 % of the children consumed at least two servings per day of fruit and vegetables at home, which is in line with official recommendations. As many as 40 % of the chil-dren reported a daily intake of unhealthy foods at base-line and it is therefore encouraging that the intervention was effective in targeting this problem. A systematic review of parental support interventions has confirmed that children’s dietary habits can be improved through parental counselling but that attrition is a problem in low SES groups [27].
Previous studies have used MI counselling with par-ents to improve children’s diet, but most have targeted overweight or obese children. In an Italian study, 372 families with overweight or obese children aged 4–7 years received six MI sessions delivered by pediatricians over one year. A non-significant reduction in unhealthy dietary intake (desserts, fried food, sweetened snacks/ candy and sweetened drinks) in the intervention group was detected [61]. No monitoring of MI fidelity was reported in this study. The High Five for Kids trial [62] included 465 parents of overweight or obese two-to-seven-year-old children. The intervention group received four MI sessions delivered by nurses, and three add-itional supportive telephone calls over one year. There was a non-significant trend towards decreasing intake of fast food and sweetened beverages in the intervention group compared to the control group.
Both studies using MI counselling targeting over-weight or obese children, included three or more MI sessions and families did not have low SES, whereas in our study all children were included of which about half of the families had a low educational background. Des-pite the difference regarding the target group, our results are similar to those previous studies, using MI, including our first trial of this programme where we also found an effect on diet but not on physical activity [36]. This leads us to conclude that MI with parents, together with
Table 4Effects of the intervention on BMI sds at T2 and T3
T2 T3
n b p 95 % CI Between school class varianceσu2(s.e.)
n b p 95 % CI Between school class varianceσu2(s.e.)
BMI sdsa 332 −0.03 0.46 −0.1 to 0.1 0.00 (0.00) 318 0.013 0.79 −0.1 to 0.1 0.08 (0.04) BMI sdsain overweight/obeseb
children at T1
84 −0.02 0.75 −0.2 to 0.1 0.02 (0.10) 82 0.02 0.85 −0.2 to 0.2 0.14 (0.02)
BMI sdsain overweightbchildren at T1 47 0.12 0.23 −0.1 to 0.3 0.11 (0.02) 47 0.13 0.22 −0.1 to 0.3 0.13 (0.03)
BMI sdsain obesebchildren at T1 37 −0.21 0.03 −0.4 to -0.02 0.00 (0.00) 35 −0.05 0.79 −0.4 to 0.3 0.26 (0.06)
Results of Mixed Linear Regression adjusted for sex, parental education and baseline value
b= Regression coefficient (beta),p= between intervention and control groups, CI = 95 % confidence interval Subjects are dependent observations between T1 and T2 and between T1 and T3
a
Defined according to Karlberg et al. 2001
b
Defined according to Cole et al. 2012
Table 5Fidelity to MI during intervention
MI behaviour Counsellor A Counsellor B Threshold for acceptable MI
Global rating,“MI spirit”a 3.67 3.62 3.5 Reflection to questions ratiob 3.0 1.9 1
Open questions (%)c 53 19 50
Complex reflections (%)d 45 58 40
MI consistent behaviour of the MI counsellor in relation to thresholds for acceptable MI
Values are means of MI counsellor behaviour during MI sessions
a
Holistic evaluation of counsellors expression of MI spirit (equal collaboration with client about the change + evoking client speech about the change + supporting client’s autonomy regarding the change)
b
Frequency count of counsellor behaviour regarding the specific MI technique reflections in relation to questions; ratio between the total number of questions and reflections stated by the counsellor
c
Frequency count of counsellor behaviour regarding questions; percentage of open questions posed by the counsellor
d
information and practical activities, seems to be effective in improving children’s diet in areas of low SES and with a high proportion of foreign born citizens.
Physical activity and sedentary behaviour
In this study we did not find significant intervention ef-fects on any of the physical activity outcomes. This lack of effect is not surprising considering that at baseline 89 % of all children in the study were sufficiently active according to international recommendations, engaging in at least 60 min of MVPA per day. Other studies using individual counselling have shown contrasting results [63, 64]. In a Finnish study, parents received counselling once a year over three years and the results showed positive effects on physical activity [64]. In con-trast, in another study, face-to-face counselling during 6 months in the home did not result in changes in physical activity or sedentary behaviour [63]. This lack of effect is in line with our study, which also had dur-ation of six months.
Apart from the satisfactory level of physical activity among the children at baseline, the lack of effect could also be due to the short duration of the intervention. The reason for choosing a relatively short intervention period of six months was the waiting-list control design of the study, where the control classes were promised to receive the intervention after the follow-up measure-ments were finished one year later. Our results are in line with our systematic review [27] where we found that it is difficult to increase children’s physical activity through parental support programmes.
Studies using MI as the counselling method have shown contrasting results regarding physical activity. In a 5-month controlled study with nine-year-old chil-dren of which a majority had normal weight, parents received 3 MI sessions with additional telephone calls as part of a multicomponent intervention [65]. The intervention also included extra physical activity in school and activities for both children and parents, including group discussions of dietary habits and physical activity. Fidelity to MI was not monitored and physical activity was measured through self-report in interviews with parents. A significant increase in phys-ical activity was reported in the intervention group compared to the control group. Similar results were found in two other studies which both targeted over-weight and obese children in primary care [61, 66]. However, only one of the studies reported MI fidelity [66]. Another study using MI showed no significant differences in physical activity between intervention and control groups [62].
Thus, use of MI either as a single method or as part of a complex intervention, does not have equally convin-cing results on physical activity as on diet. The studies
that did find a positive intervention effect were mostly obesity management studies, where children probably had relatively low activity levels at baseline.
BMI
Our results showed no difference between the interven-tion and control groups for weight development after the intervention. However, among obese children (n= 41), BMI sds differed significantly between the intervention and control group post-intervention. Parental support interventions to prevent overweight and obesity can be effective [23, 26], especially if of high intensity and this is true even in groups with low SES [67–69]. However, non-participation and attrition is a problem to be addressed.
Several studies have used MI either as a single method or as part of a complex intervention, but again fidelity is seldom reported. The study by Centis et al [65], using MI counselling, showed a significant decrease in BMI sds between the intervention and the control group in mainly normal weight children. In addition to MI, par-ents received weekly telephone calls providing support and additional nutrition information, which probably fa-cilitated the change processes. Several MI interventions targeting children with weight problems have failed to detect any significant decreases in BMI [61, 66, 70]. However, the High Five for Kids Trial [62] targeting overweight and obese children found positive interven-tion effects where BMI sds decreased among girls and children in families with low SES. The BMI2-trial involv-ing 633 parents of overweight children aged 2–8 years found significantly lower BMI in the most intense MI group compared to controls at 2-years follow-up [71]. MI fidelity was monitored during MI training, but not during the intervention. In contrast, another trial in overweight or obese children using MI with parents and additional telephone support had no such effect [72]. However, this was a preliminary study only including 60 children which may explain the lack of significant ef-fects. Therefore, the decrease in BMI sds seen in our study among overweight or obese children is encour-aging, even though the effect was transient. We believe that increasing the duration of all the intervention com-ponents and the number of MI sessions might yield stronger and more sustainable effects.
Strengths and weaknesses of the study
Second, it has a high quality cluster-randomised controlled design, a relatively large sample size, and we used objective assessment of physical activity, sedentary behaviour and anthropometry. Third, we evaluated the process of all three intervention components, and found that it was satisfac-tory, although only 46 % of the parents participated in both MI sessions. Monitoring MI fidelity is particularly import-ant, and this was done by reliable coders using a valid and reliable instrument.
The fact that MI was delivered by members of the re-search team with high MI competence constitutes a strength in terms of internal validity, but a limitation in terms of external validity, as school nurses do not pres-ently have this competence. Another limitation was the parental questionnaire, including diet, which has not been validated for the specific target group. Self-report might lead to under reporting of unhealthy behaviours and over reporting of healthy behaviours due to social desirability. Furthermore, the children’s usual diets might have been captured more accurately if repeated recalls had been per-formed. We also faced a high proportion of missing values in questionnaire responses regarding dietary intake and screen time which may have biased the results. We per-formed a sensitivity analysis in order to account for this which however did not essentially change the results. There may also have been a selection bias in the sample of families, with low participation of families where Swedish is not spoken. Finally, even though we checked for con-tamination in control classes at school, we cannot exclude the possibility that contamination has taken place in the home environment, which would tend to weaken the effects of the programme.
Implications for future research
Changes in dietary intake and weight development in chil-dren with obesity in our study were significant and com-parable to other studies. The intervention showed no effect on physical activity outcomes. There are several lessons to be learnt from this and our previous evaluation [36] of the Healthy School Start programme. Since changes in behaviours and formation of habits can take a long time and effects are short-lived, the programme might benefit from being extended from pre-school class to the first year of school to get stronger intervention effects and to maintain the effects long-term. Regarding the MI component, reminders could perhaps be con-ducted in the form of telephone calls as done in other studies [62, 65, 66]. The programme might also have been more successful if focus had been on one specific behav-iour. Furthermore, cultural diversity in diet and physical activity might have influenced the effect of the interven-tion. Also, in a prevention study similar to this one, par-ents often refused to label a concern about diet or physical activity as a problem, but rather as something
needing a minor adjustment [73]. It might therefore be necessary to fine tune the use of MI according to the parent’s culturally based expectations on health communi-cation and to their views of the target behaviour both when eliciting and when providing information with a preventive purpose. The process evaluation of the HSS programme with teachers and parents [74] suggests that a better tailoring of intervention components to partici-pants’needs and capabilities may increase engagement in the intervention, which could potentially lead to better outcomes.
Achieving sustainability of a programme like this one requires integration into school routines. Delivering the intervention through the school health care services could be suitable as they are an ideal structure for reach-ing all children and their families independent of social background.
Conclusion
The Healthy School Start Study shows that it is possible to influence unhealthy dietary intake and weight develop-ment in children from families with low SES and a high proportion of foreign-born citizens by providing individual parental support in a school context. However, the posi-tive effects were short-lived. Therefore, the programme probably needs to be prolonged and/or intensified in order to obtain stronger and more sustainable effects, which can be justified based on the principle of proportional univer-salism. This study may therefore be an important contri-bution to the further development of evidence-based parental support programmes to prevent overweight and obesity in children in disadvantaged areas.
Competing interests
The authors declare that they have no competing interests.
Authors’contributions
GN, LSE, ES and ÅN developed the study design. ÅN, GN and ZZ performed the statistical analyses. GN and ÅN drafted the manuscript. All authors provided critical feedback, contributed to the writing of the manuscript and approved the final manuscript.
Acknowledgements
We want to thank all the families and teachers who participated in this intervention.
This study was funded by Stockholm County Council Public Health Fund, the Martin Rind Foundation and the Sven Jerring Foundation.
Received: 3 June 2015 Accepted: 6 January 2016
References
1. Lim SS, Vos T, Flaxman AD, Danaei G, Shibuya K, Adair-Rohani H, et al. A comparative risk assessment of burden of disease and injury attributable to 67 risk factors and risk factor clusters in 21 regions, 1990–2010: a systematic analysis for the Global Burden of Disease Study 2010. Lancet. 2013;380(9859): 2224–60.
3. Craigie AM, Lake AA, Kelly SA, Adamson AJ, Mathers JC. Tracking of obesity-related behaviours from childhood to adulthood: a systematic review. Maturitas. 2011;70(3):266–84.
4. Telama R. Tracking of physical activity from childhood to adulthood: a review. Obes Facts. 2009;2(3):187–95.
5. Singh AS, Mulder C, Twisk JW, van Mechelen W, Chinapaw MJ. Tracking of childhood overweight into adulthood: a systematic review of the literature. Obes Rev. 2008;9(5):474–88.
6. Wabitsch M. Overweight and obesity in European children: definition and diagnostic procedures, risk factors and consequences for later health outcome. Eur J Pediatr. 2000;159 Suppl 1:S8–13.
7. Parsons TJ, Power C, Logan S, Summerbell CD. Childhood predictors of adult obesity: a systematic review. Int J Obes Relat Metab Disord. 1999;23 Suppl 8:S1–107.
8. Moraeus L, Lissner L, Yngve A, Poortvliet E, Al-Ansari U, Sjoberg A. Multi-level influences on childhood obesity in Sweden: societal factors, parental determinants and child’s lifestyle. Int J Obes (Lond). 2012;36(7):969–76. 9. Magnusson MB, Hulthen L, Kjellgren KI. Obesity, dietary pattern and physical
activity among children in a suburb with a high proportion of immigrants. J Hum Nutr Diet. 2005;18(3):187–94.
10. Sundblom E, Petzold M, Rasmussen F, Callmer E, Lissner L. Childhood overweight and obesity prevalences levelling off in Stockholm but socioeconomic differences persist. Int J Obes (Lond). 2008;32(10):1525–30. 11. Rasmussen M, Krolner R, Klepp KI, Lytle L, Brug J, Bere E, et al. Determinants
of fruit and vegetable consumption among children and adolescents: a review of the literature. Part I: Quantitative studies. Int J Behav Nutr Phys Act. 2006;3:22.
12. Ventura AK, Birch LL. Does parenting affect children’s eating and weight status? Int J Behav Nutr Phys Act. 2008;5:15.
13. Collins C, Duncanson K, Burrows T. A systematic review investigating associations between parenting style and child feeding behaviours. J Hum Nutr Diet. 2014;27(6):557–68.
14. Vollmer RL, Mobley AR. Parenting styles, feeding styles, and their influence on child obesogenic behaviors and body weight. A review. Appetite. 2013; 71:232–41.
15. Davison KK, Cutting TM, Birch LL. Parents’activity-related parenting practices predict girls’physical activity. Med Sci Sports Exerc. 2003;35(9):1589–95. 16. Ferreira I, van der Horst K, Wendel-Vos W, Kremers S, van Lenthe FJ, Brug J.
Environmental correlates of physical activity in youth - a review and update. Obes Rev. 2007;8(2):129–54.
17. Seabra AC, Seabra AF, Mendonca DM, Brustad R, Maia JA, Fonseca AM, et al. Psychosocial correlates of physical activity in school children aged 8–10 years. Eur J Public Health. 2013;23(5):794–8.
18. Verloigne M, Van Lippevelde W, Maes L, Brug J, De Bourdeaudhuij I. Family-and school-based correlates of energy balance-related behaviours in 10– 12-year-old children: a systematic review within the ENERGY (EuropeaN Energy balance Research to prevent excessive weight Gain among Youth) project. Public Health Nutr. 2012;15(8):1380–95.
19. Mullie P, Clarys P, Hulens M, Vansant G. Dietary patterns and socioeconomic position. Eur J Clin Nutr. 2010;64(3):231–8.
20. Elinder LS, Heinemans N, Hagberg J, Quetel AK, Hagstromer M. A participatory and capacity-building approach to healthy eating and physical activity- SCIP-school: a 2-year controlled trial. Int J Behav Nutr Phys Act. 2012;9:145. 21. Sallis JF, Prochaska JJ, Taylor WC. A review of correlates of physical activity
of children and adolescents. Med Sci Sports Exerc. 2000;32(5):963–75. 22. Summerbell CD, Waters E, Edmunds LD, Kelly S, Brown T, Campbell KJ.
Interventions for preventing obesity in children. Cochrane database of systematic reviews (Online). 2005;3:CD001871.
23. Golley RK, Hendrie GA, Slater A, Corsini N. Interventions that involve parents to improve children's weightrelated nutrition intake and activity patterns -what nutrition and activity targets and behaviour change techniques are associated with intervention effectiveness? Obes Rev. 2011;12(2):114–30. 24. Hingle MD, O'Connor TM, Dave JM, Baranowski T. Parental involvement in
interventions to improve child dietary intake: a systematic review. Prev Med. 2010;51(2):103–11.
25. O'Connor TM, Jago R, Baranowski T. Engaging parents to increase youth physical activity a systematic review. Am J Prev Med. 2009;37(2):141–9. 26. Hendrie GA, Brindal E, Corsini N, Gardner C, Baird D, Golley RK. Combined
home and school obesity prevention interventions for children: what behavior change strategies and intervention characteristics are associated with effectiveness? Health Educ Behav. 2012;39(2):159–71.
27. Kader M, Sundblom E, Elinder LS. Effectiveness of universal parental support interventions addressing children's dietary habits, physical activity and bodyweight: A systematic review. Prev Med. 2015;77:52–67.
28. Jones TL, Prinz RJ. Potential roles of parental self-efficacy in parent and child adjustment: a review. Clin Psychol Rev. 2005;25(3):341–63.
29. Miller WR, Rollnick S. Motivational interviewing: Helping people change. 3rd ed. New York: Guilford Press; US; 2013.
30. Armstrong MJ, Mottershead TA, Ronksley PE, Sigal RJ, Campbell TS, Hemmelgarn BR. Motivational interviewing to improve weight loss in overweight and/or obese patients: a systematic review and meta-analysis of randomized controlled trials. Obes Rev. 2011;12(9):709–23.
31. Martins RK, McNeil DW. Review of motivational interviewing in promoting health behaviors. Clin Psychol Rev. 2009;29(4):283–93.
32. Hardcastle SJ, Taylor AH, Bailey MP, Harley RA, Hagger MS. Effectiveness of a motivational interviewing intervention on weight loss, physical activity and cardiovascular disease risk factors: a randomised controlled trial with a 12-month post-intervention follow-up. Int J Behav Nutr Phys Act. 2013;10:40. 33. Dawson AM, Brown DA, Cox A, Williams SM, Treacy L, Haszard J, et al. Using
motivational interviewing for weight feedback to parents of young children. J Paediatr Child Health. 2014;50(6):461–70.
34. Schwartz RP, Hamre R, Dietz WH, Wasserman RC, Slora EJ, Myers EF, et al. Office-based motivational interviewing to prevent childhood obesity: a feasibility study. Arch Pediatr Adolesc Med. 2007;161(5):495–501. 35. Williams AA, Wright KS. Engaging families through motivational interviewing.
Pediatr Clin North Am. 2014;61(5):907–21.
36. Nyberg G, Sundblom E, Norman A, Bohman B, Hagberg J, Elinder LS. Effectiveness of a universal parental support programme to promote healthy dietary habits and physical activity and to prevent overweight and obesity in 6-year-old children: the healthy school start study, a cluster-randomised controlled trial. PLoS One. 2015;10(2), e0116876.
37. Nyberg G, Sundblom E, Norman A, Elinder LS. A healthy school start - parental support to promote healthy dietary habits and physical activity in children: design and evaluation of a cluster-randomised intervention. BMC Public Health. 2011;11:185.
38. Årsrapport barnhälsovården (Annual report on child health care). Stockholm: Stockholms Läns Landsting 2013.
39. Haynos AF, O'Donohue WT. Universal childhood and adolescent obesity prevention programs: review and critical analysis. Clin Psychol Rev. 2012; 32(5):383–99.
40. Baranowski T, Perry C, Parcel G. How individuals, environments, and health behavoir interact: Social cognitive theory. In: Glanz KRB, Lewis FM, editors. Health Behaviour and Health Education. Theory, Research, and Practice. San Francisco: Jossey-Bass; 2002.
41. Bandura A. Social Foundations of Thought and Action: A Social Cognitive Theory. NJ: Prentice-Hall: Englewood Cliffs; 1986.
42. Fraser M, Richman J, Galinsky M, Day S. Intervention Research. New York: Oxford University Press; 2009.
43. von Haartman F, Sundblom E, Schafer EL. Föräldrastöd Till Hälsosamma Matvanor och Fysisk Aktivitet - en Kunskapsöversikt (Parental Support for Healthy Dietary Habits and Physical Activity - a Review). Karolinska Institutets folkhälsoakademi: Stockholm; 2009.
44. Johnson CC, Osganian SK, Budman SB, Lytle LA, Barrera EP, Bonura SR et al. CATCH: family process evaluation in a multicenter trial. Health Educ Q. 1994; Suppl 2:S91-106.
45. Bayer O, von Kries R, Strauss A, Mitschek C, Toschke AM, Hose A, et al. Short- and mid-term effects of a setting based prevention program to reduce obesity risk factors in children: a cluster-randomized trial. Clin Nutr. 2009;28(2):122–8.
46. Moyers T, Martin, T, Manuel, JK, Miller, WR, Ernst, D. Revised Global Scales: Motivational Interviewing Treatment Integrity 3.1.1 (MITI 3.1.1). University of New Mexico Center on Alcoholism, Substance Abuse and Addictions (CASAA). Accessed 17 Feb. 2014.
47. de Vries S, Bakker I, Hopman-Rock M, Hirasing R, van Mechelen W. Clinimetric review of motion sensors in children and adolescents. J Clin Epidemiol. 2006; 59(7):670–80.
48. Sherar LB, Griew P, Esliger DW, Cooper AR, Ekelund U, Judge K, et al. International children's accelerometry database (ICAD): design and methods. BMC Public Health. 2011;11:485.
50. Ridgers ND, Salmon J, Ridley K, O'Connell E, Arundell L, Timperio A. Agreement between activPAL and ActiGraph for assessing children's sedentary time. Int J Behav Nutr Phys Act. 2012;9:15.
51. Trost SG, Ward DS, Moorehead SM, Watson PD, Riner W, Burke JR. Validity of the computer science and applications (CSA) activity monitor in children. Med Sci Sports Exerc. 1998;30(4):629–33.
52. Bennett CA, de Silva-Sanigorski AM, Nichols M, Bell AC, Swinburn BA. Assessing the intake of obesity-related foods and beverages in young children: comparison of a simple population survey with 24 h-recall. Int J Behav Nutr Phys Act. 2009;6:71.
53. Cole TJ, Lobstein T. Extended international (IOTF) body mass index cut-offs for thinness, overweight and obesity. Pediatr Obes. 2012;7(4):284–94. 54. Karlberg J, Luo ZC, Albertsson-Wikland K. Body mass index reference values
(mean and SD) for Swedish children. Acta Paediatr. 2001;90(12):1427–34. 55. Galobardes B, Shaw M, Lawlor DA, Lynch JW, Davey SG. Indicators of
socioeconomic position (part 1). J Epidemiol Community Health. 2006;60(1):7–12. 56. Galobardes B, Shaw M, Lawlor DA, Lynch JW, Davey SG. Indicators of
socioeconomic position (part 2). J Epidemiol Community Health. 2006;60(2):95–101.
57. Urbana utvecklingsområden (Urban developemnt areas). Statistisk uppföljning utifrån sju indikatorer: Ministry of employment Sweden 2012. Report No: Dnr A2012/4115/IU.
58. Twisk JWR. Applied Multilevel Analysis, A Practical Guide. Cambridge UK: Cambrigde University Press; 2006.
59. Ekelund U, Luan J, Sherar LB, Esliger DW, Griew P, Cooper A. Moderate to vigorous physical activity and sedentary time and cardiometabolic risk factors in children and adolescents. Jama. 2012;307(7):704–12. 60. Campbell MK, Thomson S, Ramsay CR, MacLennan GS, Grimshaw JM. Sample
size calculator for cluster randomized trials. Comput Biol Med. 2004;34(2):113–25. 61. Davoli AM, Broccoli S, Bonvicini L, Fabbri A, Ferrari E, D'Angelo S, et al.
Pediatrician-led motivational interviewing to treat overweight children: an RCT. Pediatrics. 2013;132(5):e1236–46.
62. Taveras EM, Gortmaker SL, Hohman KH, Horan CM, Kleinman KP, Mitchell K, et al. Randomized controlled trial to improve primary care to prevent and manage childhood obesity: the high five for kids study. Arch Pediatr Adolesc Med. 2011;165(8):714–22.
63. Anand SS, Davis AD, Ahmed R, Jacobs R, Xie C, Hill A, et al. A family-based intervention to promote healthy lifestyles in an aboriginal community in Canada. Can J Public Health. 2007;98(6):447–52.
64. Saakslahti A, Numminen P, Salo P, Tuominen J, Helenius H, Valimaki I. Effects of a three-year intervention on children's physical activity from age 4 to 7. Pediatr Exerc Sci. 2004;16:167–80.
65. Centis E, Marzocchi R, Di Luzio R, Moscatiello S, Salardi S, Villanova N, et al. A controlled, class-based multicomponent intervention to promote healthy lifestyle and to reduce the burden of childhood obesity. Pediatr Obes. 2012; 7(6):436–45.
66. Tucker SJ, Ytterberg KL, Lenoch LM, Schmit TL, Mucha DI, Wooten JA, et al. Reducing pediatric overweight: nurse-delivered motivational interviewing in primary care. J Pediatr Nurs. 2013;28(6):536–47.
67. Barkin SL, Gesell SB, Po'e EK, Escarfuller J, Tempesti T. Culturally tailored, family-centered, behavioral obesity intervention for Latino-American preschool-aged children. Pediatrics. 2012;130(3):445–56.
68. Slusser W, Frankel F, Robison K, Fischer H, Cumberland WG, Neumann C. Pediatric overweight prevention through a parent training program for 2–4 year old Latino children. Child Obes. 2012;8(1):52–9.
69. Yin Z, Parra-Medina D, Cordova A, He M, Trummer V, Sosa E, et al. Miranos! Look at us, we are healthy! An environmental approach to early childhood obesity prevention. Child Obes. 2012;8(5):429–39.
70. van Grieken A, Veldhuis L, Renders CM, Borsboom GJ, van der Wouden JC, Hirasing RA, et al. Population-based childhood overweight prevention: outcomes of the‘Be active, eat right’study. PLoS One. 2013;8(5), e65376. 71. Resnicow K, McMaster F, Bocian A, Harris D, Zhou Y, Snetselaar L, et al.
Motivational interviewing and dietary counseling for obesity in primary care: an RCT. Pediatrics. 2015;135(4):649–57.
72. Small L, Bonds-McClain D, Melnyk B, Vaughan L, Gannon AM. The preliminary effects of a primary care-based randomized treatment trial with overweight and obese young children and their parents. J Pediatr Health Care. 2014;28(3):198–207.
73. Norman A, Berlin A, Sundblom E, Elinder LS, Nyberg G. Stuck in a vicious circle of stress. Parental concerns and barriers to changing children’s dietary and physical activity habits. Appetite. 2014;87C:137–42.
74. Norman Å, Nyberg, G, Schäfer Elinder L, Berlin A, One size does not fit all– qualitative process evaluation of the Healthy School Start parental support programme to prevent overweight and obesity among children in disadvantaged areas in Sweden, Accepted for publication in BMC Public Health 2016.
• We accept pre-submission inquiries
• Our selector tool helps you to find the most relevant journal
• We provide round the clock customer support
• Convenient online submission
• Thorough peer review
• Inclusion in PubMed and all major indexing services
• Maximum visibility for your research
Submit your manuscript at www.biomedcentral.com/submit