R E S E A R C H A R T I C L E
Open Access
DNA methylation subgroups in melanoma
are associated with proliferative and
immunological processes
Martin Lauss
1, Markus Ringnér
1, Anna Karlsson
1, Katja Harbst
1, Christian Busch
2,3, Jürgen Geisler
2,3,4,
Per Eystein Lønning
2,3,5, Johan Staaf
1and Göran Jönsson
1*Abstract
Background:DNA methylation at CpG dinucleotides is modified in tumorigenesis with potential impact on transcriptional activity.
Methods:We used the Illumina 450 K platform to evaluate DNA methylation patterns of 50 metastatic melanoma tumors, with matched gene expression data.
Results:We identified three different methylation groups and validated the groups in independent data from The Cancer Genome Atlas. One group displayed hypermethylation of a developmental promoter set, genome-wide demethylation, increased proliferation and activity of the SWI/SNF complex. A second group had a methylation pattern resembling stromal and leukocyte cells, over-expressed an immune signature and had improved survival rates in metastatic tumors (p< 0.05). A third group had intermediate methylation levels and expressed both proliferative and immune signatures. The methylation groups corresponded to some degree with previously identified gene expression phenotypes.
Conclusions:Melanoma consists of divergent methylation groups that are distinguished by promoter methylation, proliferation and content of immunological cells.
Keywords:Melanoma, DNA methylation, Gene expression, Melanocytes, Molecular subtypes, Polycomb
Background
The tumor phenotype is formed by genetic and epigen-etic events and signals from the micro-environment. In melanoma, the landscape of somatic mutations and gene copy number changes has been explored [1–3], and the understanding of surrounding immunological cells has led to the development of new treatment options [4, 5]. Recurrently mutated genes discovered by recent exome sequencing studies are frequently involved in epigenetic modifications [6], e.g., ARID2 [1, 2], pointing to a yet under-appreciated driver role of epigenetic factors. Methylation of cytosine in the CpG context is an epigen-etic mark that can directly influence transcriptional ac-tivity, and changes of DNA methylation pattern have
been associated with tumorigenesis. In melanoma, a number of genes were found to harbor promoter CpG island methylation [7]. Consequently, melanomas hyper-methylated at several CpG islands were termed CpG Island Methylator Phenotype (CIMP) [8], according to findings from other cancer types [9, 10]. Promoter methylation is reported to repress gene expression. Conversely, a small number of genes, such as MAGE, are activated by hypomethylation in melanoma [7]. High-throughput technology has enabled the assessment of DNA methylation of a wider spectrum of genomic locations in melanoma [11–23], often highlighting methylation events that discriminate melanoma from nevi/melanocytes. Genome-wide methylation patterns may reveal tumor subtypes of biological and clinical relevance. In this respect, Thomas et al. used the Illumina GoldenGate platform (1505 CpGs) and found three methylation subgroups in 47 primary cutaneous * Correspondence:goran_b.jonsson@med.lu.se
1
Department of Oncology and Pathology, Clinical Sciences, Lund University Hospital, Lund University, Lund 221 85, Sweden
Full list of author information is available at the end of the article
melanoma, with the hypermethylated groups having in-creased Breslow thickness [24]. Sigalotti et al. analyzed short-term cultures from 45 stage IIIC patients on Illu-mina 27 K BeadChips and identified one group with low and one with high average methylation, respectively; with the latter group having poor overall survival [25].
Previously, we introduced four gene expression sub-groups in melanoma; one proliferative group (‘ Prolifera-tive’), one group with activated melanogenesis pathway (‘Pigmentation’), one group displaying elevated immune response (‘High-Immune’) and one with contribution from surrounding normal tissue (‘Normal-like’) [26]. The groups were also present in primary melanomas and had diverging clinical outcome [27]. In this study we aimed to characterize DNA methylation subtypes of melanoma, validate the findings in independent data, and to investigate the relationship of methylation and gene expression patterns.
Results
Identification of three methylation subtypes in melanoma We determined the methylation status of more than 480,000 individual CpGs in 50 metastatic melanoma tu-mors, subsequently called ‘Bergen’ data, that were in-cluded in a previous discovery of gene expression phenotypes [26] (Table 1). The methylation measure-ments are β-values that range from 0, unmethylated to 1, fully methylated [28]. We defined a set of CpGs that is aberrantly methylated in melanoma as compared to melanocytes, with 9,886 melanoma-methylated CpGs and 5,236 melanoma-demethylated CpGs, respectively, as previously described [29]. Unsupervised clustering of the combined CpG sets identified three consensus groups in the Bergen melanomas, subsequently called methylation subtype 1, 2 and 3 (MS1, MS2, MS3) (Fig. 1a). As validation data, we used 242 samples from The Cancer Genome Atlas (TCGA) (Table 1). Unsuper-vised clustering of the TCGA data, which consists of pri-mary and metastatic tumors, using the same CpG set, resulted in three groups with comparable methylation pat-terns to the Bergen data (Fig. 1a). Principal component analyses were performed to exclude that the groups are due to technical procedures at data generation, such as the use of different batches (Additional file 1: Figure S1A and B). The three groups were re-identified in both data-sets when changing the number of CpGs to be included in the clustering procedure (Additional file 1: Figure S1C). We next classified the TCGA samples into MS1, MS2, and MS3 groups using Bergen-derived methylation cen-troids (Additional file 2: Table S1). Centroid classification was the dominant explainer of total variation in TCGA methylation data compared to histopathological and molecular factors (Additional file 1: Figure S1B). Further-more, classification of TCGA tumors using
Bergen-derived centroids, is in good agreement with the groups obtained from unsupervised clustering of the TCGA data (76 % sample co-occurence,P< 2x10⁻¹⁶, Additional file 1: Figure S1D and “MS classified” annotation in Fig. 1a), confirming that the methylation clusters of Bergen are re-identified in the TCGA data.
We then restricted the analysis to a subset of CpGs lo-cated in CpG islands within 1500 bp upstream of tran-scription start sites. The vast majority of these promoter island CpGs were hyper-methylated in melanomas (930 of 947), in line with other tumor types. In both datasets, methylation levels spanned a continuous gradient from unmethylated melanomas to fully methylated melanomas, Table 1Patient and sample information
Feature Bergen (n= 50) TCGA (n= 242)
Gender
Male 28 (56) 154 (64)
Female 22 (44) 88 (36)
Median thickness (mm) 2.25 (0.5-25) 2.7 (0.28-50)
Clark
I 3 (9) 3 (2)
II 2 (6) 13 (7)
III 9 (27) 49 (27)
IV 13 (39) 83 (46)
V 6 (18) 31 (17)
Histogroup
SSM 18 (53)
-NM 16 (47)
-Sample origin
Primary 0 27 (11)
Regional LN 3 (6) 134 (56)
Regional other 0 49 (20)
Distant metastasis 47 (94) 31 (13)
BRAF mutation
yes 25 (50) 118 (49)
no 25 (50) 123 (51)
NRAS mutation
yes 11 (22) 66 (27)
no 39 (78) 175 (73)
CDKN2A-arrayCGH
Homozygous Deletion 11 (22)
-Present 39 (78)
-Gene expression phenotype
High-immune 15 (30) 69 (32)
Normal-like 3 (6) 33 (15)
Pigmentation 20 (40) 63 (29)
A
B
rather than forming a distinctive CIMP group (Additional file 1: Figure S2). We conclude that in melanomas the full range of CpGs provides additional information to the traditionally studied promoter island CpGs, and allowed for the identification of three reproducible methylation subtypes, MS1/2/3.
Biological processes shaping the methylation subtypes Methylation levels at promoter islands are elevated in MS1 tumors in comparison to MS3 tumors (Fig. 1b, Kruskal-Wallis test). ‘Poised promoters’ are character-ized by Polycomb-complex 2 (PRC2) induced H3K27 tri-methylation marks in addition to H3K4 tri-methylation marks, and are most prevalent in embryonic stem cells [30]. The poised promoter set of embryonic stem cells is important in developmental processes and found to be methylated in various cancer types [31, 32]. Notably, CpGs in this poised promoter set also displayed increased methylation levels in the MS1 group. Con-versely, intergenic methylation levels away from genes and islands are reduced in MS1 tumors (Fig. 1b, Kruskal-Wallis test). The MS1 group showed a pattern similar to melanocytes but with hyper-methylation at many poised promoters. The nine melanoma cell lines also displayed the MS1 pattern (Fig. 1a). In contrast, the DNA methylation pattern of the MS3 group was similar to peripheral blood leukocytes. Finally, the MS2 group presents a mixture of MS1 and MS3 methylation patterns with intermediate methylation levels for the majority of CpGs.
The CpG set used for group discovery consisted of four functional clusters (Fig. 1a). First, one CpG cluster (Fig. 1a, black cluster“Cl. 1 + 2”) was highly enriched in the aforementioned Polycomb-targeted poised pro-moters. This CpG cluster was hypermethylated in mel-anoma compared to melanocytes with gradually increasing methylation levels from MS3 to MS1 tumors. Second, genome-wide hypomethylation was observed in repetitive, heterochromatic regions, that had gradually decreasing methylation levels from MS3 to MS1 tumors (Fig. 1a, grey cluster “Cl. 5”). Third, a heterogeneous CpG cluster was found that had opposite methylation status in melanocytes and blood leukocytes, with melan-oma samples spanning the gradient in between (Fig. 1a,
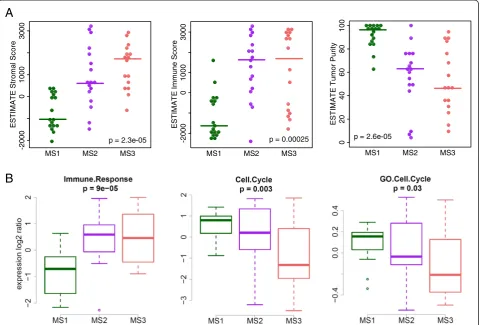
green cluster “Cl. 3 + 4”). The fourth cluster of CpGs could not be assigned to a biological function (Fig. 1a, ‘mixed’, pale blue cluster “Cl. 6”). As the third cluster seemed to contain methylation signals from non-tumoral cells, we used the ESTIMATE algorithm to further investi-gate the cellular composition of the tumors [33]. Evidence of elevated stromal and immune cell content was ob-served in MS2/3 compared to MS1 samples (Fig. 2a, Kruskal-Wallis test). Overall, tumor purity was estimated to be lowest in MS3 samples and highest in MS1 samples (Fig. 2a, Kruskal-Wallis test). Furthermore, MS1 and MS2 over-expressed mitotic gene signatures, whereas MS2 and MS3 over-expressed an immune response signature (Fig. 2b, ANOVA). These observations were validated in TCGA data (Additional file 1: Figure S3). In conclusion, the molecular subtypes are shaped by various degrees of promoter hypermethylation, genome-wide hypomethyla-tion, and cell-type specific methylation signatures from the micro-environment.
Methylation processes of melanoma in comparison to other cancer types
To set the methylation processes of melanoma in con-text to other cancer types, we used TCGA data from colon cancer (295 tumors, 38 normal tissues), breast cancer (201 tumors, 40 normal tissues) and lung cancer (lung adenocarcinoma, 452 tumors, 32 normal tissues). For these cancer types, we derived tumor-methylated and tumor-demethylated CpGs in the same way as for our melanoma data. The majority of methylated and demethylated CpGs occurred in only one cancer-type (Additional file 1: Figure S4A). Yet, at the gene level the agreement across cancer types was larger, particularly the agreement of methylated genes was considerable (Additional file 1: Figure S4A). Importantly, for all inves-tigated cancer types, the methylated CpGs were located within poised promoters (i.e. PRC2 target genes), and the demethylated CpGs located within heterochromatic regions of ES cells chromatin (Additional file 1: Figure S4B). Similarly, for melanocyte chromatin states, methyl-ated CpGs were situmethyl-ated in bivalently marked chromatin regions, and demethylated CpGs in quiescent/repressed regions (Additional file 1: Figure S4C). In an aim to find melanoma-specific mechanisms of methylation, we (See figure on previous page.)
Fig. 1Three melanoma methylation subtypes.aMethylation lanes from left to right: 3 methylation subtypes (MS) from Bergen tumors, 9 cell
compared genes hypermethylated exclusively in melan-oma to genes hypermethylated in colon, lung and breast cancer. Genes exclusively methylated in melan-oma were significantly enriched for the GO-terms “catalytic activity”, “nucleoside-triphosphatase regulator activity” and “GTPase regulator activity” (false discovery rate (fdr) < 5 %). This may allow speculating that a meta-bolic process exists in melanocytes that is connected to the MAPK pathway via regulation of GTPase (e.g., Ras) activity, with methylation of the regulators emerging at tumorigenesis. In summary, aberrant methylation in tu-mors preferentially occurs at genes with “poised pro-moters” and demethylation in heterochromatin, however, the exact stretches of DNA that get aberrantly methylated are cancer-type specific. This resembles findings from Sproul et al., who however had not included melanomas in their study [34].
Correlation to histopathology, mutation data and clinical outcome
Overall the proportions of the three methylation groups were comparable between the Bergen and TCGA sam-ples. However, the TCGA distant metastasis samples
contained more MS1 samples than the Bergen cohort (Fig. 3a, Fisher’s exact test). We did not observe any sig-nificant associations of gender, age, primary tumor fea-tures (Breslow thickness, Clark’s level, SSM/NM), LDH, lymph-node/subcutaneous, CD3 or CD20 IHC with the methylation groups in the Bergen data. Furthermore, in our data, neither BRAF nor NRAS mutation status was clearly associated with either subgroup (Fig. 1a). Homo-zygous deletions of the CDKN2A locus seemed to be more frequent in MS1 (p= 0.02). We repeated the muta-tion analysis for TCGA exome-sequencing data. The total number of mutations in tumors was equally distrib-uted across subtypes (Additional file 1: Figure S5A). For mutations in 15 known melanoma driver genes [1, 2] we did not observe any subtype association, with an fdr < 10 % (Additional file 1: Figure S5B).IDH1hotspot muta-tions at R132 correlate with a glioblastoma hypermethyla-tion phenotype [35] and have been reported in melanoma [36]. IDH1 hotspot mutation was more prevalent in the hypermethylated MS1 group (6 of 11 mutated cases), however, not reaching significance.
Disease-specific survival analysis indicated more ag-gressive behavior of MS1 melanomas compared to MS2/
A
B
E
S
T
IM
A
T
E
Immune S
c
ore
-2000
0
1000
3000
MS1 MS2 MS3
p = 0.00025
EST
IM
AT
E T
u
m
o
r Pu
ri
ty
0
20
40
60
80
100
MS1 MS2 MS3
p = 2.6e-05
EST
IM
A
T
E
St
ro
m
a
l Sc
o
re
-2000
0
1000
3000
MS1 MS2 MS3
p = 2.3e-05
Fig. 2Immunological and proliferative signature expression across methylation subtypes.aESTIMATE scores and tumor purity.P-value from
3 melanomas, although not reaching significance (p= 0.2 log-rank test, Fig. 3b). This trend was further supported in metastatic TCGA tumors, with MS1 patients having inferior survival outcome (p= 5x10⁻⁵, Fig. 3c). As sam-ples from distant metastases are over-represented in the MS1 subtype, we repeated the survival analysis using only the regional lymph node metastasis from TCGA, and again observed inferior survival of MS1 patients (p= 0.008, Fig. 3d). The primary TCGA cohort size (n= 27) was too small to allow for survival analysis. A link between methylation and gene expression phenotypes
The MAPK and PI(3)K pathways are instrumental in melanoma [37, 38]. However, these pathways did not seem to be differentially expressed across methylation subtypes in Bergen and TCGA data, with the exception of DUSP genes (Additional file 1: Figure S6A). Genes that promote the cell cycle, such as MDM2, CDK4,
CDK6, CCND1, CCNE1 and E2F3 are up-regulated in MS1 samples; as well as genes that directly modify CpG methylation, such asde-novomethyltransferaseDNMT3A
and 5-hydroxy converting TET1 (fdr < 5 %, Fig. 4a, ANOVA with Benjamini-Hochberg fdr). Histone modi-fiers were generally not differentially expressed across methylation subtypes, again with an exception, the H3K4 de-methylation enzyme JARID1B. Recently, members of the SWI/SNF chromatin remodeling complex have been found to carry loss-of-function mutations across cancer types, implying a tumor suppressor role [39, 40]. Interest-ingly, several SWI/SNF members are up-regulated in MS1 tumors (Fig. 4a).
To further investigate the relationship of methylation to gene expression patterns, we compared the methyla-tion subtypes to the four gene expression phenotypes previously defined in the Bergen cohort [26]. MS1 con-sisted of ‘Proliferative’ and ‘Pigmentation’–type tumors (Fig. 4b), suggesting a link between proliferation and
Be rg e n Pr im a ry R e gi onal LN R e gi onal ot her Di st a n t m e t. Pe rc e n ta g e 0 10 20 30 40 50 60
0 20 40 60 80 100
0 .0 0 .2 0 .4 0 .6 0 .8 1 .0 Time (months) Su rv iv a l
MS1 ( n = 16) MS2 ( n = 17) MS3 ( n = 14)
p = 0.2
Bergen
TCGA Regional LN
(Bergen Centroids)TCGA All Met.
(Bergen Centroids)
B
A
p = 1
0 20 40 60 80 100
0. 0 0. 2 0. 4 0 .6 0. 8 1. 0 Time (months) Su rv iv a l
MS1 ( n = 76) MS2 ( n = 86) MS3 ( n = 42)
p = 5e-05
0 20 40 60 80 100
0 .0 0 .2 0 .4 0 .6 0 .8 1 .0 Time (months) Su rv iv a l
MS1 ( n = 39) MS2 ( n = 56) MS3 ( n = 33)
p = 0.008
p = 0.3 p = 0.17
p = 0.007
n= 5 0 n= 2 7 n= 1 3 4 n= 4 9 n= 3 1
C
D
TCGAFig. 3Clinical evaluation of methylation subtypes.aDistribution of methylation subtypes in Bergen and TCGA cohorts.P-values from Fisher’s
hyper-methylation. The MS3 subgroup is dominated by ‘High-immune’and‘Normal-like’tumors. The agreement of gene expression subtypes and methylation subtypes is
statistically significant (p= 0.0001, Fisher’s exact test, Cross-table Additional file 1: Figure S6B), with methyla-tion subtypes providing addimethyla-tional stratificamethyla-tion beyond
Bergen, p = 0.0001
MS1
MS2
MS3
TCGA, p = 6x10
-1447% 18% 6%
53% 47% 19%
0% 0% 19%
0% 35% 56%
33% 23% 4%
44% 28% 9%
15% 19% 9%
8% 30% 78%
MS1
MS2
MS3
B
A
TET1
Bergen
TCGA
MS1
MS2
MS3
fdrMS1
MS2
MS3
fdrCell
c
y
cle
progression
SWI/SNF chromatin remodelling complex DNA
methylation de novo
maintenance
5-hydroxy
acetylation
methylation
PRC2 complex
demethylation
Histone modification
TP53 ATM
MDM2
E2F3 CNND1 CDKN2A
CNNE1
CDKN1A CDK4/6
RB1
oncogene suppressor
C
MS1
MS2
MS3
Proliferative polycomb methylator
Combined strategy
Immune cell interplay PRC2 target meth.
Global demeth.
Immune-high Prolif./Pigm. mixed
GEX phenotype Surivival Immune cells
Proliferation
SWI/SNF & TET1
gene expression down up
Immune-high Normal-like
Pigmentation
Proliferative
Immune-high Normal-like
Pigmentation
Proliferative
enzymatic
targeting
scaffold
Poor Improved Improved
Fig. 4Association between transcription and methylation landscapes.aExpression of genes involved in cancer-driving pathways and processes,
gene expression subtypes. The co-occurrence of methyla-tion and gene expression phenotypes was also observed in the TCGA data (p= 6x10⁻¹⁴, Fisher’s exact test, Fig. 4b and Additional file 1: Figure S6B). Together, these findings provide a link between the transcriptional and DNA methylation landscapes in melanoma.
Discussion
In the present study, we have identified three groups of melanoma specimens with different methylation pat-terns. The MS1 group fits the paradigm of genome-wide de-methylation and focal promoter hyper-methylation in tumors [41]. Most cancer types studied by the TCGA consortium, contained a subgroup with high methylation levels [42]. Hypermethylated subgroups in colon and endometrial cancer were associated withMLH1 inactiva-tion and increased mutainactiva-tion rate. In other cancer types hypermethylated subgroups were associated with IDH1
mutations (AML, glioblastoma), or EBV virus (gastric cancer). For breast cancer, lung squamous cell carcin-oma and lung adenocarcincarcin-oma, there has been no clear association of the methylated group to such a factor. Likewise, our melanoma hypermethylated group MS1 was not significantly associated with a mutated gene or overall mutation rate. Hyper-methylation is primarily di-rected towards the embryonic PRC2 target gene set. These genes are pre-marked by histone H3K27 tri-methylation in addition to a H3K4 mark in embryonic stem cells [43]. DNA methylation of these ‘poised pro-moters’has emerged as a general process across tumor types [31, 44]. Genome-wide de-methylation in melan-oma occurs in repetitive regions, distant from CpG islands. A relatively small number of de-methylated CpGs are captured on the array, which is likely due to difficulties with designing probes in repetitive region-s.Cell line methylation patterns differed from normal melanocytes and matched well with the MS1 group. Moreover, methylation subtypes seemed to be influenced by the cellular composition of the tumor, in particular, the MS3 methylation pattern is closely related to blood leukocytes and has a reduced tumor cell content com-pared to MS1. In the future, single-cell sequencing may clarify the methylation pattern of pure MS3 tumor cells. However, for prediction of immune therapy success, in-formation from both tumor and surrounding cells has been valuable [45–48]. Therefore, methylation signals from the micro-environment may prove useful for deci-sion making in melanoma.
Together, the methylation data reveals two tumor strategies (Fig. 4c). First, a proliferative strategy that co-occurs with hypermethylation of poised promoters. Poised promoters are located in differentiation genes, some of them potentially negative for tumor fitness. It is therefore tempting to speculate that methylation of
poised promoters is aimed at removing the brakes of tumor proliferation. Sequential methylation of the poised promoter set may inactivate repressive developmental genes, resulting in a small advantage in tumor growth. Therefore, clones with ever-increasing poised promoter methylation may be preferred in tumor evolution. Ac-cordingly, instead of a clear CIMP group, we observe a gradual increase in promoter methylation. This prolifer-ation strategy also seems to act independently from the MAPK and PI(3)K signaling pathways (Additional file 1: Figure S6A). The second strategy is based on an inter-play of tumor cells with immune cells. The composition of the immune cells in the melanoma samples was pre-served across cohorts, as the methylation subtypes could be validated in the independent TCGA data. The precise interplay of tumor and immune cells is still unclear. The knowledge of this interplay may reveal the basis of im-proved survival of MS3 patients, and could greatly bene-fit the development of further immune therapies. Importantly, immunomodulating agents have demon-strated significant clinical benefit in melanoma and include immune checkpoint blockade agents such as anti-CTLA4 and anti-PD1/PDL1 [4, 5]. In contrast, tumor-associated macrophages, regulatory T-cells and myeloid-derived suppressor cells can blunt anti-tumor effector functions and promote tumor growth and inva-siveness, highlighting the complexity of the interplay be-tween the tumor and the immune system.
A major limitation of the current study is that DNA methylation is the only investigated epigenetic mark. Characterization of a broad spectrum of epigenetic marks will most likely enhance insight into melanoma. In addition, a better understanding of the functional role of the SWI/SNF chromatin remodeling complex and its impact on the epigenetic landscape will be very useful.
Conclusions
Herein, we identified three methylation subgroups in melanoma, with distinct biological properties and dis-ease outcome. The methylation groups are in good agreement with gene expression phenotypes, and high-light two different mechanisms underlying this disease, a proliferative strategy and a strategy based on the presence of immune cells.
Methods
Generation of genome-wide methylation data
HumanMethylation450K BeadChips. Informed consent was obtained from all patients. The study was approved by the local ethics committee. DNA was extracted as described previously [26]. Bisulfite conversion and hybridization to Infinium HumanMethylation450K BeadChips was performed following the manufac-turer’s instructions, with samples being processed as one batch. Methylation data had been deposited at Gene Expression Omnibus as series GSE51547, and gene expression data as GSE22153.
Processing of Bergen methylation and gene expression data
Beta-values were calculated from methylated (M) and unmethylated (U) signal, as beta = M/(M + U). A total of 496 missing values were imputed using k-nearest neighbor imputation (k = 10) [49]. For each sample we performed a peak-based correction of Illumina I and II chemical assays similar to Dedeurwaerder et al. [50]. For each assay the beta values were smoothened (Epanechnikov kernel) to estimate unmethylated and methylated peaks, re-spectively. The unmethylated peak was moved to 0 and the methylated peak to 1 using linear scaling, with beta-values in between stretched accordingly and capped at 0 and 1. CpGs of chromosomes X and Y were removed.
The matched gene expression data was processed as described previously [26]. Multiple probes for a gene (based on gene symbol) were median-merged.
Processing of TCGA methylation and gene expression data
Methylation data for 242 samples from the TCGA data portal https://tcga-data.nci.nih.gov/tcga/ were processed as described for the Bergen data. For a subset of 214 samples we downloaded normalized RSEM gene counts from ‘level 3’ RNA sequencing data. The data was quantile-normalized using limma [51], added an offset of 32, capped to a maximum value of 65,000, log2
trans-formed, and genes were median-centered. The samples were classified using reported gene expression pheno-type centroids as described [26]. TCGA methylation data for colon cancer (COAD, 295 tumors, 38 solid normal tissues), breast cancer (BRCA, 201 tumors, 40 solid normal tissues, constituting the first six TCGA batches) and lung adenocarcinoma (LUAD, 452 tumors, 32 solid normal tissues) were processed as described for the Bergen data.
Clustering procedure to obtain consensus clusters The set of 9,886 melanoma-methylated CpGs was defined asβ< 0.1 in melanocytes andβ> 0.5 in at least 20 % of tu-mors (n= 10). The set of 5,236 melanoma-demethylated CpGs was defined asβ> 0.9 in melanocytes andβ< 0.5 in
at least 20 % of tumors (n= 10), respectively. The CpG sets were combined for the clustering procedure. Hier-archical Clustering Analysis (HCA) with Euclidean distance and Ward’s algorithm for agglomeration, was performed for 1000 bootstrapped versions of the data [44]. At each bootstrap HCA the dendrogram is cut into either 2 or 3 clusters. For all sample pairs, the fre-quency with which the two samples have clustered into the same group is calculated. The co-clustering frequency matrix is then reordered by HCA (Pearson correlation distance, Ward agglomeration) to obtain the consensus methylation groups, i.e. subsets of samples that repeatedly cluster together.
Nearest Centroid Classification
The centroids of the methylation subgroups were defined as the mean methylation values of the 9,886 melanoma-methylated and 5,236 melanoma-demelanoma-methylated CpGs, across each subgroup of the Bergen samples. Therefore, we obtained three centroids, one for MS1, one for MS2, and one for MS3, presenting the mean beta-values of the sub-groups. The centroids were deposited as Additional file 2: Table S1. To classify a sample from the TCGA Human-Methylation450K data, the beta-values of the centroid CpGs were extracted. The Euclidean distance of the TCGA beta-values to each of the three centroids was calculated and the sample was assigned to the MS subgroup to whose centroid it had the shortest distance. Using this classifica-tion system we assigned each TCGA tumor as being either MS1, MS2 or MS3.
Statistical analysis
We used chromatin predictions for H1 embryonic stem cells [52], and melanoma gene co-expression modules for ‘Immune Response’ and ‘Cell Cycle’ from an inde-pendent cohort [53]. All statistical analysis was per-formed in R 3.1.1. Survival analysis was perper-formed using the survival package, principal component analysis was performed using the swamp package [54], ESTIMATE scores were derived using theestimatepackage [33].
Additional files
Additional file 1: Figure S1.Robustness of methylation subtypes.
Principal component analysis to monitor data bias due to technical variables in the Bergen (A) and TCGA (B) cohorts, respectively. The entire set of 473,864 CpGs was used for principal component analysis. The heatmaps indicate the association of a sample annotation to each of the principal components. The strength of association is specified by the log10p-value of the linear model with the respective principal
with variant methylation between melanoma and melanocytes. CpGs were required to be either methylated or de-methylated in at least 10 tumors for our final subtypes. The CpG set for 10 tumors contained 9,886 melanoma-methylated and 5,236 melanoma-demethylated CpGs. The heatmap displays the overlap of the resulting three consensus clusters at various tumor cutoffs. (D) Heatmap of TCGA sample co-occurrence between unsupervised consensus clusters and methylation subtypes obtained from (supervised) nearest centroid classification.Figure S2. Promoter island consensus clusters. The group discovery CpG set was reduced to CpGs located within 1500 bp upstream of transcription start sites and within a CpG island. In total this analysis includes 947 CpGs, of which 930 are hypermethylated, and 17 are hypomethylated in tumors as compared to melanocytes. Two-group consensus solutions were favorable to three-group solutions in Bergen and TCGA data, respectively. Figure S3.Signature expression across methylation subtypes in TCGA data. (A) ESTIMATE scores and tumor purity.P-value from Kruskal-Wallis test. (B) Mean expression values of gene modules and GO-term‘cell cycle’.P-value from anova. TCGA tumor data.Figure S4.Aberrant methylation in melanoma compared to colon, lung and breast cancer. (A) Venn diagrams of aberrant methylation on the CpG and gene level. (B) Aberrant methylation in ES-cell chromatin context. Chromatin categories as in ENCODE project. (C) Aberrant methylation in melanocyte chromatin context. Chromatin categories as in Epigenome Roadmap project.Figure S5.Driver gene mutations and methylation subtypes in the TCGA cohort. (A) Number of non-silent mutations per sample across methylation subtypes. (B) Non-silent and hotspot mutations of reported melanoma driver genes across subtypes.Figure S6.Expression of MAPK and PI(3)K pathway genes across methylation subtypes. (A) Expression of MAPK and PI(3)K pathway. fdr = false discovery rate forp-values from anova using Benjamini-Hochberg adjustment. (B) Cross-table of gene expression and methylation subtypes. (PDF 865 kb)
Additional file 2: Table S1.Centroids of methylation subgroups.
(XLS 1550 kb)
Abbreviations
CIMP:CpG island methylator phenotype; TCGA: The cancer genome atlas; HCA: Hierarchical clustering analysis; MS: Methylation subtype; NM: Nodular melanoma; SSM: Superficial spreading melanoma; LDH: Lactate
dehydrogenase; IHC: Immunohistochemistry; SWI/SNF: SWItch/Sucrose nonfermentable; PRC2: Polycomb repressive complex 2.
Competing interests
The authors declare that they have no competing interests.
Authors’contribution
ML and GJ conceived and designed the study. ML and GJ drafted the manuscript with the help of MR and JS. AK and KH performed methylation analysis. CB, JG and PEL interpreted data and provided tumor samples. All authors read and approved the manuscript.
Acknowledgements
The study has been supported by the Swedish Cancer Society, The Swedish Research Council, BioCARE, Berta Kamprad Foundation, The Gunnar Nilsson Cancer Foundation, The Gustav Vth Jubilee Foundation, and Governmental Support for Medical Research (ALF).
Author details
1
Department of Oncology and Pathology, Clinical Sciences, Lund University Hospital, Lund University, Lund 221 85, Sweden.2Section of Oncology,
Department of Clinical Science, University of Bergen, Bergen, Norway.
3Department of Clinical Oncology, Haukeland University Hospital, Bergen,
Norway.4Present Address: Department of Clinical Molecular Biology and Laboratory Sciences, Akershus University Hospital, Lørenskog, Norway.
5
Institute of Clinical Medicine, University of Oslo, Oslo, Norway.
Received: 22 May 2015 Accepted: 28 October 2015
References
1. Hodis E, Watson IR, Kryukov GV, Arold ST, Imielinski M, Theurillat J-P, et al. A landscape of driver mutations in melanoma. Cell. 2012;150:251–63. 2. Krauthammer M, Kong Y, Ha BH, Evans P, Bacchiocchi A, McCusker JP, et al.
Exome sequencing identifies recurrent somatic RAC1 mutations in melanoma. Nat Genet. 2012;44:1006–14.
3. Pleasance ED, Cheetham RK, Stephens PJ, McBride DJ, Humphray SJ, Greenman CD, et al. A comprehensive catalogue of somatic mutations from a human cancer genome. Nature. 2010;463:191–6.
4. Robert C, Thomas L, Bondarenko I, O’Day S, M D JW, Garbe C, et al. Ipilimumab plus dacarbazine for previously untreated metastatic melanoma. N Engl J Med. 2011;364:2517–26.
5. Wolchok JD, Kluger H, Callahan MK, Postow MA, Rizvi NA, Lesokhin AM, et al. Nivolumab plus ipilimumab in advanced melanoma. N Engl J Med. 2013;369:122–33.
6. Kandoth C, McLellan MD, Vandin F, Ye K, Niu B, Lu C, et al. Mutational landscape and significance across 12 major cancer types. Nature. 2013;502:333–9.
7. van den Hurk K, Niessen HEC, Veeck J, van den Oord JJ, van Steensel MAM, Zur HA, et al. Genetics and epigenetics of cutaneous malignant melanoma: A concert out of tune. Biochimica Et Biophysica Acta. 2012;1826:89–102. 8. Tanemura A, Terando AM, Sim M-S, van Hoesel AQ, de Maat MFG, Morton
DL, et al. CpG island methylator phenotype predicts progression of malignant melanoma. Clin Cancer Res. 2009;15:1801–7.
9. Noushmehr H, Weisenberger DJ, Diefes K, Phillips HS, Pujara K, Berman BP, et al. Identification of a CpG island methylator phenotype that defines a distinct subgroup of glioma. Cancer Cell. 2010;17:510–22.
10. Weisenberger DJ, Siegmund KD, Campan M, Young J, Long TI, Faasse MA, et al. CpG island methylator phenotype underlies sporadic microsatellite instability and is tightly associated with BRAF mutation in colorectal cancer. Nat Genet. 2006;38:787–93.
11. Furuta J, Nobeyama Y, Umebayashi Y, Otsuka F, Kikuchi K, Ushijima T. Silencing of Peroxiredoxin 2 and aberrant methylation of 33 CpG islands in putative promoter regions in human malignant melanomas. Cancer Res. 2006;66:6080–6. 12. Koga Y, Pelizzola M, Cheng E, Krauthammer M, Sznol M, Ariyan S, et al.
Genome-wide screen of promoter methylation identifies novel markers in melanoma. Genome Res. 2009;19:1462–70.
13. Conway K, Edmiston SN, Khondker ZS, Groben PA, Zhou X, Chu H, et al. DNA-methylation profiling distinguishes malignant melanomas from benign nevi. Pigment Cell Melanoma Res. 2011;24:352–60.
14. Bonazzi VF, Nancarrow DJ, Stark MS, Moser RJ, Boyle GM, Aoude LG, et al. Cross-platform array screening identifies COL1A2, THBS1, TNFRSF10D and UCHL1 as genes frequently silenced by methylation in melanoma. PLoS One. 2011;6:e26121.
15. Gao L, Smit MA, van den Oord JJ, Goeman JJ, Verdegaal EME, van der Burg SH, et al. Genome-wide promoter methylation analysis identifies epigenetic silencing of MAPK13 in primary cutaneous melanoma. Pigment Cell Melanoma Res. 2013;26:542–54.
16. Hou P, Liu D, Dong J, Xing M. The BRAF(V600E) causes widespread alterations in gene methylation in the genome of melanoma cells. Cell Cycle. 2012;11:286–95.
17. Lian CG, Xu Y, Ceol C, Wu F, Larson A, Dresser K, et al. Loss of 5-hydroxymethylcytosine is an epigenetic hallmark of melanoma. Cell. 2012;150:1135–46.
18. Marzese DM, Scolyer RA, Roqué M, Vargas-Roig LM, Huynh JL, Wilmott JS, et al. DNA methylation and gene deletion analysis of brain metastases in melanoma patients identifies mutually exclusive molecular alterations. Neuro Oncol. 2014;16:1499–509.
19. Marzese DM, Scolyer RA, Huynh JL, Huang SK, Hirose H, Chong KK, et al. Epigenome-wide DNA methylation landscape of melanoma progression to brain metastasis reveals aberrations on homeobox D cluster associated with prognosis. Hum Mol Genet. 2014;23:226–38.
20. Ecsedi S, Hernandez-Vargas H, Lima SC, Vizkeleti L, Toth R, Lazar V, et al. DNA methylation characteristics of primary melanomas with distinct biological behaviour. PLoS One. 2014;9:e96612.
21. Li J-L, Mazar J, Zhong C, Faulkner GJ, Govindarajan SS, Zhang Z, et al. Genome-wide methylated CpG island profiles of melanoma cells reveal a melanoma coregulation network. Sci Rep. 2013;3:2962.
23. Gao L, van den Hurk K, Moerkerk PTM, Goeman JJ, Beck S, Gruis NA, et al. Promoter CpG Island Hypermethylation in Dysplastic Nevus and Melanoma: CLDN11 as an Epigenetic Biomarker for Malignancy. J Invest Dermatol. 2014;134(12):2957–66.
24. Thomas NE, Slater NA, Edmiston SN, Zhou X, Kuan P-F, Groben PA, et al. DNA methylation profiles in primary cutaneous melanomas are associated with clinically significant pathologic features. Pigment Cell Melanoma Res. 2014;27:1097–105.
25. Sigalotti L, Covre A, Fratta E, Parisi G, Sonego P, Colizzi F, et al. Whole genome methylation profiles as independent markers of survival in stage IIIC melanoma patients. J Transl Med. 2012;10:185.
26. Jönsson G, Busch C, Knappskog S, Geisler J, Miletic H, Ringnér M, et al. Gene expression profiling-based identification of molecular subtypes in stage IV melanomas with different clinical outcome. Clin Cancer Res. 2010;16:3356–67.
27. Harbst K, Staaf J, Lauss M, Karlsson A, Måsbäck A, Johansson I, et al. Molecular profiling reveals low- and high-grade forms of primary melanoma. Clin Cancer Res. 2012;18:4026–36.
28. Sandoval J, Heyn H, Moran S, Serra-Musach J, Pujana MA, Bibikova M, et al. Validation of a DNA methylation microarray for 450,000 CpG sites in the human genome. Epigenetics. 2011;6:692–702.
29. Lauss M, Haq R, Cirenajwis H, Phung B, Harbst K, Staaf J, et al. Genome-Wide DNA Methylation Analysis in Melanoma Reveals the Importance of CpG Methylation in MITF Regulation. J Invest Dermatol. 2015;135(7):1820–8. 30. Roadmap Epigenomics Consortium, Kundaje A, Meuleman W, Ernst J,
Bilenky M, Yen A, et al. Integrative analysis of 111 reference human epigenomes. Nature. 2015;518:317–30.
31. Easwaran H, Johnstone SE, Van Neste L, Ohm J, Mosbruger T, Wang Q, et al. A DNA hypermethylation module for the stem/progenitor cell signature of cancer. Genome Res. 2012;22:837–49.
32. Widschwendter M, Fiegl H, Egle D, Mueller-Holzner E, Spizzo G, Marth C, et al. Epigenetic stem cell signature in cancer. Nat Genet. 2007;39:157–8. 33. Yoshihara K, Shahmoradgoli M, Martínez E, Vegesna R, Kim H, Torres-Garcia
W, et al. Inferring tumour purity and stromal and immune cell admixture from expression data. Nat Commun. 2013;4:2612.
34. Sproul D, Kitchen RR, Nestor CE, Dixon JM, Sims AH, Harrison DJ, et al. Tissue of origin determines cancer-associated CpG island promoter hypermethylation patterns. Genome Biol. 2012;13:R84.
35. Turcan S, Rohle D, Goenka A, Walsh LA, Fang F, Yilmaz E, et al. IDH1 mutation is sufficient to establish the glioma hypermethylator phenotype. Nature. 2012;483:479–83.
36. Shibata T, Kokubu A, Miyamoto M, Sasajima Y, Yamazaki N. Mutant IDH1 confers an in vivo growth in a melanoma cell line with BRAF mutation. Am J Pathol. 2011;178:1395–402.
37. Long GV, Stroyakovskiy D, Gogas H, Levchenko E, de Braud F, Larkin J, et al. Combined BRAF and MEK Inhibition versus BRAF Inhibition Alone in Melanoma. N Engl J Med. 2014;371:1877–88.
38. Kwong LN, Davies MA. Navigating the therapeutic complexity of PI3K pathway inhibition in melanoma. Clin Cancer Res. 2013;19:5310–9. 39. Shain AH, Pollack JR. The spectrum of SWI/SNF mutations, ubiquitous in
human cancers. PLoS One. 2013;8:e55119.
40. Helming KC, Wang X, Roberts CWM. Vulnerabilities of Mutant SWI/SNF Complexes in Cancer. Cancer Cell. 2014;26:309–17.
41. Ehrlich M. DNA methylation in cancer: too much, but also too little. Oncogene. 2002;21:5400–13.
42. Witte T, Plass C, Gerhauser C. Pan-cancer patterns of DNA methylation. Genome Med. 2014;6:66.
43. Bernstein BE, Mikkelsen TS, Xie X, Kamal M, Huebert DJ, Cuff J, et al. A bivalent chromatin structure marks key developmental genes in embryonic stem cells. Cell. 2006;125:315–26.
44. Lauss M, Aine M, Sjödahl G, Veerla S, Patschan O, Gudjonsson S, et al. DNA methylation analyses of urothelial carcinoma reveal distinct epigenetic subtypes and an association between gene copy number and methylation status. Epigenetics. 2012;7:858–67.
45. Tumeh PC, Harview CL, Yearley JH, Shintaku IP, Taylor EJM, Robert L, et al. PD-1 blockade induces responses by inhibiting adaptive immune resistance. Nature. 2014;515:568–71.
46. Herbst RS, Soria J-C, Kowanetz M, Fine GD, Hamid O, Gordon MS, et al. Predictive correlates of response to the anti-PD-L1 antibody MPDL3280A in cancer patients. Nature. 2014;515:563–7.
47. Gubin MM, Zhang X, Schuster H, Caron E, Ward JP, Noguchi T, et al. Checkpoint blockade cancer immunotherapy targets tumour-specific mutant antigens. Nature. 2014;515:577–81.
48. Snyder A, Makarov V, Merghoub T, Yuan J, Zaretsky JM, Desrichard A, et al. Genetic basis for clinical response to CTLA-4 blockade in melanoma. N Engl J Med. 2014;371:2189–99.
49. Troyanskaya O, Cantor M, Sherlock G, Brown P, Hastie T, Tibshirani R, et al. Missing value estimation methods for DNA microarrays. Bioinformatics. 2001;17:520–5.
50. Dedeurwaerder S, Defrance M, Calonne E, Denis H, Sotiriou C, Fuks F. Evaluation of the Infinium Methylation 450 K technology. Epigenomics. 2011;3:771–84.
51. Smyth GK. Linear models and empirical bayes methods for assessing differential expression in microarray experiments. Stat Appl Genet Mol Biol. 2004;3:Article3.
52. Ernst J, Kheradpour P, Mikkelsen TS, Shoresh N, Ward LD, Epstein CB, et al. Mapping and analysis of chromatin state dynamics in nine human cell types. Nature. 2011;473:43–9.
53. Cirenajwis H, Ekedahl H, Lauss M, Harbst K, Carneiro A, Enoksson J, et al. Molecular stratification of metastatic melanoma using gene expression profiling - prediction of survival outcome and benefit from molecular targeted therapy. Oncotarget. 2015;6:12297–309.
54. Lauss M, Visne I, Kriegner A, Ringnér M, Jönsson G, Höglund M. Monitoring of technical variation in quantitative high-throughput datasets. Cancer Inform. 2013;12:193–201.
Submit your next manuscript to BioMed Central and take full advantage of:
• Convenient online submission
• Thorough peer review
• No space constraints or color figure charges
• Immediate publication on acceptance
• Inclusion in PubMed, CAS, Scopus and Google Scholar
• Research which is freely available for redistribution