Iran University of Medical Sciences
____________________________________________________________________________________________________________________
1. PhD of Health Services Administration, Health management and economics research center, Iran University of Medical Sciences, Tehran, Iran. shandizmoslehi@yahoo.com
2. MSc in Psychology, Health management and economics research center, Iran University of Medical Sciences, Tehran, Iran. pezhman_ata@yahoo.com
3. (Corresponding author)MSc in Public Administration, Health management and economics research center, Iran University of Medical
Quality measurement indicators for Iranian Health Centers
Shandiz Moslehi1, Pezhman Atefi Manesh2, Ali Sarabi Asiabar3
Received:18 June 2014 Accepted:8 September 2014 Published:10 February 2015
Abstract
Background: Recently, quality is a serious concern in development of organizations. There are various indicators to assess quality and the purpose of this study was to identify the main indicators for quality measurement of Iranian health centers.
Methods: This qualitative study was conducted in three stages: first, review of the literature was performed to identify different indicators for quality measurement in health centers; second, a two-round Delphi process was used with participation of 18 experts in both two-rounds; third, Analytical Hi-erarchy Process (AHP) method was applied to give weights to each indicator.
Results: Twenty-seven indicators were identified from the literature review stage. The Delphi method reduced the list to 4 indicators. Developing a quality plan in the health center had the highest weight (38%) and percentage of followed complaints the lowest (12%). The consistency rate was 7.2% indicating appropriateness of the data.
Conclusion: This list of indicators can be used as a template for measuring quality of health centers in Iran and possibly in other developing countries.
Keywords: Quality Measurement, Indicators, Health Centers.
Cite this article as:Moslehi Sh, Atefi Manesh P, Sarabi Asiabar A. Quality measurement indicators for Iranian Health Centers.Med J Islam Repub Iran2015 (10 February). Vol. 29:177.
Introduction
A network of primary health facilities has been constructed from Alma-Ata declara-tion, to improve the quality of health care system (1). In Iran, the majority of rural and urban population receive primary health services from health centers. Formal-ly each health center offers services to about 12500 people. Providing health ser-vices such as visiting students, examining women health, vaccination, dental health and environment health are some of specif-ic activities of health centers in Iran (2, 3).
There are some challenges in measuring health centers’ performance. Major out-comes of health services would be re-searchable almost in the future, thus, it is hard to measure the outcomes
instantane-ously. Inefficacy of reliable data resources about health is another challenging item (4). Nonetheless, there are some available factors to determine quality of health cen-ters and their services (5-7).
It is widely accepted that the use of organ-izational quality systems in the health care sector helps the organizations for improv-ing the quality of services provided and the efficiency and effectiveness of the person-nel (8, 9).
To our knowledge, there has not been any previous study regarding a model for immediate quality measurement indicators for Iranian health centers. The main objec-tive of this study was to develop a list of indicators to measure quality of Iranian health centers.
2 MJIRI, Vol. 29.177. 10 February 2015
Methods
This qualitative study was conducted in three stages: first, a narrative review of the literature was conducted to identify the list of organizational quality indicators for health centers; second, the Delphi process was used to select the main quality indica-tors for immediate assessing the organiza-tional quality of Iranian health centers. Then Analytical Hierarchy Process (AHP) was used to give weight to indicators.
The research team searched through Elsevier, Scopus, Web of science, Emerald and Springer databases for quality meas-urement indicators for health centers.
The Medical Subject Heading (MeSH) terms used for searching were “quality”, “quality of health”, “health center”, “prima-ry health center” and “indicator” in the ti-tle/topic of articles. After the first search the duplicate articles were removed by Endnote software (X3 version). Then two reviewers reviewed all the articles for study inclusion criteria.
The inclusion criteria were: 1) articles which were published in peer reviewed English language journals, 2) articles which were cited in eligible databases, 3) articles which were published from 2001 to 2011. Then papers were reviewed in detail. Con-sequently, we identified 27 indicators for measuring organizational quality for health centers.
To reach consensus a Delphi procedure was used. Indicators collected from litera-ture were used as the basis for the ques-tions, which the experts were then asked to proofread. We designed an ascending as-sessment scale from 1 to 5; 1: Extremely disagree, 2: Disagree, 3: Neutral, 4: Agree, 5: Extremely agree.
To answer the questions of the question-naire the experts must have sufficient pro-fessional knowledge, and related experi-ence. Therefore, this study selected experts with one of the following qualifications: (1) A current or previous health center manag-er with at least 5 years of practical expmanag-eri- experi-ence; (2) A PhD degree of health services management with related experience; (3) A
professional and technical staff with 10 or more years of practical experience.
Based on the qualifications, 18 people were selected as experts for Delphi proce-dure. Each expert was asked to fill out the questionnaire. They could suggest any item related to quality measurement that was not included the questionnaire. The Delphi members’ answers were collected and then analyzed by SPSS 19. In this study we conducted a 2 round Delphi to select the indicators. For the first round of Delphi, we distributed 18 questionnaires with a return rate of 100%. We repeated this for the other round. After the two rounds of Delphi, the data were analyzed to develop a list of indi-cators. The mean (±SD) and t test was used for data analysis.
After designing the primary list adopted from the Delphi results, we sent back the list of developed indicators to the experts to confirm it. If two out of three of the experts agreed to add or omit any indicator we con-sidered it to develop the main list. Thus, reliability and validity of the list were checked.
The Analytical Hierarchy Process (AHP) technique was developed by Saaty (10,11) as a powerful instrument used for multiple criteria decision making purposes (12). AHP basically enables decision-makers to prioritize alternatives. AHP uses pair wise comparisons to identify the priority of al-ternatives in a multi-criteria decision-making problem (13). At the top of the hi-erarchy in this study is the organizational quality of health centers.
Therefore, we first defined the indica-tors, then, made a series of pair wise com-parisons, and finally, estimated relative weights for measurement of overall
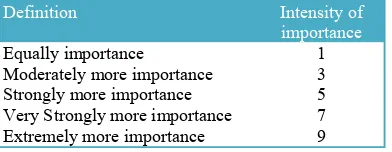
per-Table 1. The nine-point scale and description of its items.
Definition Intensity of
importance
Equally importance 1 Moderately more importance 3 Strongly more importance 5 Very Strongly more importance 7 Extremely more importance 9
formance (14).
After revealing the quality indicators, 5 experts estimated relative weights by using AHP method. Application of AHP to rank/order the 27 indicators required 3 steps. In step one, 18 experts selected 4 main indicators. In step 2, five experts compared indicators and discussed why a given indicator would be more or less im-portant than another and the degree of the difference. In order to help the comparison it was created a nine-point scale of im-portance. The suggested numbers were to express degree of importance between each two indicators as shown in Table 1. Inter-mediate values (2, 4, 6 and 8) were used to represent comparisons. In step 3, research-ers calculated the weights for each indicator by K. Goepel Version 9.5.2012 software.
Results
The search strategy and application of the inclusion criteria yielded relevant articles published in specified period of time. Based on the literature review we found 27 related indicators of quality.
The number of participants that filled in the questionnaires and attended the Delphi procedure is presented in Table 2.
About 55% (n=3) of participants were female and 50% (n=3) were male. About 22% (n=1) were educated in health services management filled and 33.3% (n=2) were general practitioners.
The selected indicators from analysis of the data in the first round of Delphi were used to develop a quality plan for the health center. In the second round 3 indicators were selected as: having a quality devel-opment team in health center, patient satis-faction rate, and percentage of followed complaints. Table 3 shows the results of Delphi rounds for selecting quality indica-tors.
About 3.7% (n=1) of indicators were sta-tistically significant in first round and 62.9% (n=17) of indicators were asked in the second questionnaire. In the second round the return rate of questionnaires were 100% as the first round. After the analysis of the second round of Delphi, the primary indicators of organizational quality meas-urement were developed. The descriptive statistics of four selected indicators is shown in Table 4.
After developing the primary list of indi-cators, it was sent to experts again. They were asked to proof the indicators and make some changes if necessary to develop the main list. The experts confirmed the list by 100% rate.
The AHP hierarchical structure for this study is shown in Figure 1.
The consistency rate was 7.2% and it shows that the data were appropriate.
Discussion
In Iranian health system there is a
particu-Table 2. Participant characteristics in Delphi procedure.
Variable Category GP
N (%) Health managerN (%) Public healthN (%)
Gender Male 3(50%) 2 (50%) 5(62.5%)
Female 3(50%) 2(50%) 3(37.5%)
Total 6(100%) 4(100%) 8(100%)
Table 3. Details of Delphi rounds data in selecting indicators.
No. of indicators for next round No. of Not Accepted
N (%) No. AcceptedN (%) No. of indicatorsN (%) Delphi Rounds
17 (62.9%) 9 (33.3%) 1 (3.7%) 27 (100%) First
0 14 (82.3%) 3 (17.6%) 17 (100%) Second
Table 4. Descriptive statistics of selected indicators in the second round of Delphi
Round of Delphi Selected Indicators Mean SD
Second Existence of quality development team in health center 4.56 0.70
Patient satisfaction rate 4.16 0.70
Percentage of followed complaints 4.88 0.32
4 lar interest in quality assessment, both in healthca re services and in healthcare or-ganizations. But the main interest is fo-cused on quality of hospitals than health centers. Obtaining quality certifications is very popular for hospitals. Besides, Con-ducting different programs like ISO, organ-izational excellence, clinical governance and similar programs can be seen in medi-cal and therapeutic centers like hospitals. In this research we tried to extend this trend to health centers in Iran.
As indicators of quality, two indicators of “developing a quality plan” and “having a quality development team” in health cen-ters are in line with other studies (7,9). These two indicators can develop the quali-ty of healthcare services effectively (5). “Patient satisfaction rate” was another indi-cator of quality of services. As a major component of quality of health care, patient satisfaction is a key determinant of pay-for-performance metrics (6). Dib et al (2010) showed that patient satisfaction rate can predict the degree of the healthcare quality. They declared that increasing the rate of healthcare quality leads to increasing of patients’ satisfaction (15). However, further research needs to confirm this finding.
Having a strong primary health system needs an appropriate performance meas-urement model to cause a positive impact on population health (16). Developing qual-ity measurement model for health centers provides a new insight. Our proposed list of indicators could be used to guide the devel-opment of quality in health centers. The list of indicators may not follow a consistent
pattern over time.
Different studies have emphasized on quality as an important issue in organiza-tions (15,17,18). However few studies have prioritized the quality indicators in healthcare organizations. Our list provided four indicators based on the experts’ opin-ions. These indicators can help the evalua-tors to measure the quality of health cen-ters.
There is a pressure to improve the per-formance worldwide, though it is not achievable without a measurement tool (19). In this research feedbacks from the managers, health workers and academia were used to develop the list of indicators.
Conclusion
In this article we developed a 4 indicator list for rapid measuring of organizational quality for Iranian health centers. This model can be used as a template for rapid quality assessment in other developing countries. This model was developed by calculating weights of each indicator. This study is unique because a new methodology was used to design a list of indicators.
References
1. Fialho AS, Oliveira AB. Using discrete event simulation to compare the performance of family health unit and primary health care centre organiza-tional models in Portugal. Bmc Health Services Re-search 2011; 11.
2. Tabibi SJ, Moslehi S, Gohari MR, Maleki MR. Developing Information and Communication Tech-nology Measurement Indicators for Health Centers, Czech Journal of Social Sciences, Business and Economics 2013; 2(2): 14-21
3. Maleki MR, Moslehi S, Tabibi SJ, Gohari MR. Developing Accessibility Measurement Indicators for Iranian Health Centers, Management in Health Journal 2013; 17(1): 9-12
4. DeGroff A, Schooley M, Chapel T, Poister TH. Challenges and strategies in applying performance measurement to federal public health programs. Evaluation and program planning 2010; 33(4): 365-372.
5. Lee J.Choi Y. et al. Development of the Korean Primary Care Assessment Tool- Measuring Users Experience: Tests of Data Quality and Measurement Performance. International Journal for Quality in Health Care 2009; 21(2): 103-111.
6. Qingwei F. Research on Evaluation Index
Sys-Fig.1. AHP hierarchical structure for indicators of quality.
tem of Management Effectiveness on Hospital Hu-man Resource Based on Balanced Scorecard. Proce-dia Environmental Sciences 2012; 12: 1040 – 1044.
7. Liu X, Martineau T, Chen L, Zhan S, Tang S. Does decentralisation improve human resource management in the health sector? A case study from China. Social Science & Medicine 2006; 63: 1836– 1845.
8. Macinati MS. The Relationship between Quali-ty Management Systems and Organizational Per-formance in the Italian National Health Service. Health Policy 2008; 85: 228-241
9. Bhattacharyya O, Delu Y. et al. Evolution of Primary Care in China 1997-2009. Health Policy 2011; 100(3): 174-180.
10. Saaty TL. The analytic hierarchy process, McGraw-Hill, New York, NY 1980
11. Saaty TL. How to make a decision: the analyt-ic hierarchy process. European Journal of Opera-tional Research 1990; 48: 9-26.
12. Vaidya OS, Kumar S. Analytic hierarchy pro-cess: an overview of applications. European Journal of Operational Research 2006; 169(1): 1-29.
13. Chow CC, Luk P. A strategic service quality approach using analytic hierarchy process. Manag-ing Service Quality 2005; 15(3): 278-289.
14. Ahmed PK, Rafiq M. Integrated benchmark-ing: a holistic examination of select techniques for benchmarking analysis. Benchmarking for Quality Management & Technology 1998; 5(3): 225-242.
15. Dib H, Sun P, Minmin Z, Wei S, Li L. Evalu-ating Community Health Centers in the City of Da-lian, China: How Satisfied are Patients with the Medical Services Provided and Their Health Profes-sionals? Health & Place 2010; 16: 477-488.
16. Wong ST, Yin D, Bhattacharyya O, Wang B, Liu L, Chen B. Developing a performance meas-urement framework and indicators for community health service facilities in urban China. BMC Fami-ly Practice 2010; 11: 91.
17. Amado C, Santos S. Challenges for Perfor-mance Assessment and Improvement in Primary Healthcare: The Case of the Portuguese Health Cen-ters. Health Policy 2009; 91: 43-56.
18. Kruk M, Freedman L. Assessing Health Sys-tem Performance in Developing Countries: A Re-view of the Literature. Health Policy 2008; 85(3): 263-276.
19. Kidd MR, McPhee W. The lost generation: IT education for healthcare professionals. Medical Journal of Australia 1999; 171(10): 510–511.