International Journal of Hospital Research2017, 6(4): x-x http://ijhr.iums.ac.ir
Research Article
Concurrent Optimization of Patients’ Trust
and Integrated Resilience Engineering:
A Z-Number Data Envelopment Analysis
Approach
© 2017 Yazdanparast et al; licensee Iran University of Medical Sciences. This is an open access article distributed under a Creative Commons Attribution-NonCommercial 3.0 Unported License (http://creativecommons.org/licenses/by/3.0), which allows unrestricted use, distribution, and reproduction in any medium, as long as the original work is cited properly.
Background and Objectives
Emergency departments (Eds) greet a large number of patients and outpatients 24/7 and provide them with the first aids and immediate treatments every year. Reports state that the number of entrants into the EDs are being increased all around the world. The huge volume of patients’ reception leads to a limitation of the relationship between patients and medical staff as well as the incremental probability of medical and safety errors to a great extent. Trust is one of the recently detected concepts which improve the quality of care and patients’ satisfaction significantly. Trust means belief that someone or something is reliable, good, honest, effective, etc. Trust is vital for functioning of a society and it is more a relational concept that generally depends on relations
*Corresponding Author: Reza Yazdanparast, Department of Industrial Engineering, School of Industrial Engineering, College of Engineering, University of Tehran, Tehran, Iran, Tel: +98 9120416206, Email: [email protected]
Maryam Tohidifard
1, Reza Yazdanparast
1*, Ali Bozorgi-Amiri
1, Ali Azadeh
11Department of Industrial Engineering, School of Industrial Engineering, College of Engineering, University of Tehran, Tehran, Iran
Background and Objectives: Emergency departments (EDs) often encounter several risk and health issues which significantly impact on overall healthcare performance. Resilience engineering (RE) enables EDs to confront sudden changes and handling health risk issues. Patient trust (PT) is also one of the most effective factors which improve quality of care along with patient satisfaction.
Methods: This study integrates RE and trust to enhance the overall performance of EDs. A unique algorithm is introduced to demonstrate the superiority of the proposed integrated approach. It is composed of Z-number data envelopment analysis (DEA), fuzzy DEA, and statistical analysis. The required data are collected using standard questionnaires from a real-life ED. The obtained results are verified and validated by FDEA.
Findings: The results indicate that considering RE and trust increases ED efficiency significantly. Also, flexibility, fault-tolerance, reporting culture, and specialty level are the most effective factors. Moreover, trust and resiliency have similar statistical impacts on overall system efficiency.
Conclusions: One of the concerns of medical service providers nowadays is to build an efficient ED capable of providing services to a large number of patients. Therefore, to evaluate the performance of the ED, both concepts of PT and RE which are applicable to enhance the preventive safety and promote the performance, are simultaneously considered for the first time in this study.
Keywords: Emergency department, Resilience engineering, Patient trust, Z-Number data envelopment analysis (ZDEA), Statistical analysis
Abstract
of 2 participants; these participants can be people or organizations.1 Trust plays an important role in healthcare systems where all arrangements are relational. In healthcare systems, most participants like care providers, patients, and others involved, need to interact properly to underpin the cooperation among participants. Healthcare system needs cooperation between patients and care providers and also among healthcare agents to perform efficiently. In healthcare systems, patients’ satisfaction and appropriate service provision for patients are major goals of the system.2
Trust is related to many factors in healthcare, like access and quality of service.3 In healthcare systems, the first objective is to better access and utilization of care, it is extremely related to patients’ satisfaction and allegiance to the service provider. On the other hand, a good trust in healthcare leads to low levels of complaints, more stable personal relationships, and more business productivity. Various concepts are considered in the past decade to
improve patients’ safety along with patients’ satisfaction.4 Resilience engineering (RE) is relatively a new approach to enhance proactive safety and promote performance. Numerous researchers have indicated the efficiency and applicability of RE in healthcare systems specifically in EDs in the recent decade. There is still not a completely developed definition of resilience reflecting its applicability, however, Wreathall5 defined RE as “the ability of a system/ organization to stay in or to revert in a lump sum into a stable condition, leaving it operating during and after a main disaster or while consistent considerable stresses exist”. The traditional factors of RE introduced by Hollnagel et al6 to measure and assess the resilience of a system are as follows:
• Management commitment: Management
commitment is an instrument to assess the resilience of a system. Managers’ motivation to invest and allocate resources to safety improvement in a preventive and timely manner, is a key factor in a resilient organization. However, such commitment requires both individual and team levels consideration.5
• Reporting culture: This increases the staff’s
willingness to report problems. The absence of a precise reporting culture reduces the staffs’ motivation to report the safety issues and results in a limitation on the ability of the organization to learn from foibles in defensive conditions.5
• Awareness: The awareness in a system is a crucial
factor for safety and production assessment. Collecting information at the hospital can help the management understand the quality of human performance.7
• Preparedness: It predicts the activities relevant to the system and organization, along with the problems pertaining to the human performance in man-machine systems and finally makes readiness to prevail them.8
• Flexibility: Flexibility means the capability of the company to untangle the difficulty without negative influence on the total functionality.9
This approach was firstly concerned for complex systems and hazardous environments such as nuclear sites but in time, its applicability to manufacturing and service industries such as healthcare system, it finally found its way. Azadeh et al10 suggested the following 3 factors to improve the safety performance.
• Teamwork: Teamwork has been taken into account
as one of the most important factors to generate a positive and cost-effective outcome in various organizations in recent years. By the way, teamwork causes more productivity and compatibility while enhances the job satisfaction and increments the
employee retention. It can reduce individual and
organizational stress when there is a high workload of the system and thus reduces human errors and increases the system reliability.11
• Redundancy: According to Clarke,12 redundancy
has a key role in system/organization design which enables them to meet a high degree of safety standards in their performance.
• Fault-tolerance: the fault-tolerance control is a
developed method to increase safety and reliability of the system. The main goal of fault-tolerant systems is to make the system resist on an optimal constant performance even in presence of faults.13,14
This study proposes an integrated approach for concurrent optimization of RE and trust in EDs.
Performance measurement and management in health care systems have gradually been more complicated, hence the managers of the integrated health systems have to manage the organizational strategies considering the system performance measurement and management and then develop and spread them throughout the whole system.15-17 According to the importance of this subject, there are some various methods to assess the performance and to increase the efficiency of the organizations. Decision-making methods particularly DEA are from the most applicable methods to system performance assessment. Gonçalves et al,18 investigated the outpatient clinic of 27 hospitals located in Brazil applying the data envelopment analysis (DEA). Nayar and Ozcan,19 studied the technical efficiency of 53 hospitals in Virginia using DEA. Cimellaro et al20 proposed a Meta-model based on the ED performance considering the patients’ waiting time index along with the RE and safety indices. Jeffcott et al21 presented the concept of resilience and the way it applies to the healthcare using clinical handover as an exemplar. Costella et al22 introduced a procedure for assessing health and safety management systems which contained in 2 innovative characteristics.
Trust is the most important element in patient-physician relationship and has a significant impact on the curing effectiveness as well as the satisfaction of the physician and the patient as 60% to 80% of diagnosis and alike ratio of medical decisions gained based on patient trust (PT), patient/physician interviews and transferring the information.26-28
health care achievements, patient’s follow up of the physician’s prescriptions, reduction in the required time for justification of patient, reduction in claims about physicians and positive evaluation of the physician’s performance.29 The outcomes of inconsistencies among physicians and patients and their belief or diagnosis about the disease are misunderstanding, patient’s refusal to follow up the physician’s prescription and undesirable results.30 Another study was done on 2881 patient visited by 138 family physicians in Ohio. The results showed that the highest level of satisfaction was patient-centered care by a physician and the lowest level referred to the high physician’s control of the patient.31 According to the patient-physician relationship problems and ignorance of templates for such relationship, the present study started modeling and optimization of hospital ED simultaneously based on RE indices and PT. In addition, applied Z-number DEA model to evaluate the performance.
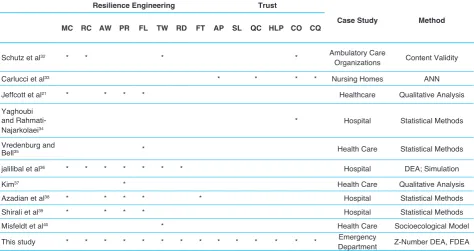
In the following, Table 1 shows the present study features and innovations versus other similar studies.
Methods
Description Model Z-number DEA
Zadeh41 introduced an assumption of Z-number that could explain experts’ information into a linguistic variable. This variable was an ordered pair (C, D) where the first number C was the fuzzy constraint and D was defined as the reliability of C. Such representation by Zadeh, led to introduce type-3 of fuzzy numbers by him.
The proposed model is an integrated model based on Z-number that not only holds the DEA properties but also is capable of considering uncertainties in decision-making units (DMUs) along with their relevant reliabilities.
Input and output values are in shape of Z-numbers in this model. Values
8 𝐶𝐶𝐶𝐶̃𝑠𝑠𝑠𝑠 are related to the S 𝐷𝐷𝑥𝑥̃𝑠𝑠𝑠𝑠 th output for the mth DMU. Where
8
𝐶𝐶𝐶𝐶̃𝑠𝑠𝑠𝑠 𝐷𝐷𝑥𝑥̃𝑠𝑠𝑠𝑠 refers to the reliability in shape of triangular fuzzy numbers. Equation (1) shows the CCR DEA model based on Z-numbers, while equation (2) is the dual form of equation (1).
10 min 𝜑𝜑0
s.t ∑𝑡𝑡𝑚𝑚=1𝜀𝜀𝑚𝑚𝑍𝑍𝑍𝑍̃ ≤ 𝜑𝜑𝑛𝑛𝑚𝑚 0𝑍𝑍𝑍𝑍̃𝑛𝑛0 n=1...,q
∑𝑡𝑡𝑚𝑚=1𝜀𝜀𝑚𝑚𝑍𝑍𝑍𝑍̃ ≥ 𝑍𝑍𝑍𝑍𝑠𝑠𝑚𝑚 ̃ 𝑠𝑠 = 1. … . 𝑤𝑤𝑠𝑠0
𝜀𝜀𝑚𝑚≥ 0 𝑖𝑖 = 1.2 … . 𝑡𝑡
(1)
𝑀𝑀𝑀𝑀𝑍𝑍 𝜑𝜑0= ∑𝑤𝑤𝑠𝑠=1𝑣𝑣𝑠𝑠𝑍𝑍𝑍𝑍̃ = 1𝑛𝑛0
s.t ∑𝑞𝑞𝑛𝑛=1𝑣𝑣𝑛𝑛𝑍𝑍𝑍𝑍̃𝑛𝑛𝑛𝑛 = 1
∑𝑤𝑤𝑠𝑠=1𝑣𝑣𝑠𝑠𝑍𝑍𝑍𝑍̃ − ∑ 𝑢𝑢𝑠𝑠𝑚𝑚 𝑞𝑞𝑛𝑛=1 𝑛𝑛𝑍𝑍𝑍𝑍̃ ≤ 0 𝑖𝑖 = 1.2. … . 𝑡𝑡 𝑛𝑛𝑚𝑚
𝑢𝑢𝑠𝑠. 𝑢𝑢𝑛𝑛≥ 0. 𝑠𝑠 = 1.2. … . 𝑤𝑤 . 𝑛𝑛 = 1. … . 𝑖𝑖
(2)
The above models are non-linear, for making them linear, first, a method to defuzzify is used and what will be gained is a set of membership functions of reliability amounts,
9 𝐷𝐷̃= ({𝑦𝑦. 𝜆𝜆𝛽𝛽̃(𝑦𝑦) 𝑦𝑦[0.1]} ), where
10 µ𝐵𝐵̃(𝑥𝑥) is the
membership function of the reliability amount Equation (3)
Table 1. The features of this study versus other studies.
Resilience Engineering Trust
Case Study Method MC RC AW PR FL TW RD FT AP SL QC HLP CO CQ
Schutz et al32 * * * * Ambulatory Care
Organizations Content Validity
Carlucci et al33 * * * * Nursing Homes ANN
Jeffcott et al21 * * * * Healthcare Qualitative Analysis
Yaghoubi and Rahmati-Najarkolaei34
* Hospital Statistical Methods
Vredenburg and
Bell35 * Health Care Statistical Methods
jalilibal et al36 * * * * * * * Hospital DEA; Simulation
Kim37 * Health Care Qualitative Analysis
Azadian et al38 * * * * * Hospital Statistical Methods
Shirali et al39 * * * * Hospital Statistical Methods
Misfeldt et al40 * Health Care Socioecological Model
This study * * * * * * * * * * * * * * Emergency
Department Z-Number DEA, FDEA
MC: management commitment; RC: reporting culture; AW: awareness; PR: preparedness; FL: flexibility; TW: teamwork; RD: redundancy; FT:
is applied for using center of gravity (COG) method.
8 min 𝜑𝜑0
s.t ∑𝑡𝑡𝑚𝑚=1𝜀𝜀𝑚𝑚𝑍𝑍𝑍𝑍̃ ≤ 𝜑𝜑𝑛𝑛𝑚𝑚 0𝑍𝑍𝑍𝑍̃𝑛𝑛0 n=1...,q ∑𝑡𝑡𝑚𝑚=1𝜀𝜀𝑚𝑚𝑍𝑍𝑍𝑍̃ ≥ 𝑍𝑍𝑍𝑍𝑠𝑠𝑚𝑚 ̃𝑠𝑠0 𝑠𝑠 = 1. … . 𝑤𝑤 𝜀𝜀𝑚𝑚≥ 0 𝑖𝑖 = 1.2 … . 𝑡𝑡
𝑀𝑀𝑀𝑀𝑍𝑍 𝜑𝜑0= ∑𝑤𝑤𝑠𝑠=1𝑣𝑣𝑠𝑠𝑍𝑍𝑍𝑍̃ = 1𝑛𝑛0 s.t ∑𝑞𝑞𝑛𝑛=1𝑣𝑣𝑛𝑛𝑍𝑍𝑍𝑍̃𝑛𝑛𝑛𝑛 = 1 ∑𝑤𝑤 𝑣𝑣𝑠𝑠
𝑠𝑠=1 𝑍𝑍𝑍𝑍𝑠𝑠𝑚𝑚̃ − ∑𝑞𝑞𝑛𝑛=1𝑢𝑢𝑛𝑛𝑍𝑍𝑍𝑍𝑛𝑛𝑚𝑚̃ ≤ 0 𝑖𝑖 = 1.2. … . 𝑡𝑡 𝑢𝑢𝑠𝑠. 𝑢𝑢𝑛𝑛≥ 0. 𝑠𝑠 = 1.2. … . 𝑤𝑤 . 𝑛𝑛 = 1. … . 𝑖𝑖
∝=∫ yλ D̃(y)dy ∫ λ D̃(𝑍𝑍)dy
∝=𝑘𝑘 + 𝑝𝑝 + 𝑟𝑟3
𝐸𝐸𝐶𝐶̃𝛽𝛽(𝑍𝑍)=β𝐸𝐸𝐶𝐶(𝑍𝑍) y
Ys.t 𝜆𝜆𝑐𝑐̃𝛽𝛽(𝑍𝑍)= β µ𝐴𝐴̃(𝑍𝑍) y
Y(1)
(2)
(4) (2)
(3)
(5)
Assuming that the reliability amounts of DMUs are in shape of triangular membership functions, Equation (4) is generated from the equation (3).
8 min 𝜑𝜑0
s.t ∑𝑡𝑡 𝜀𝜀𝑚𝑚
𝑚𝑚=1 𝑍𝑍𝑍𝑍̃ ≤ 𝜑𝜑𝑛𝑛𝑚𝑚 0𝑍𝑍𝑍𝑍𝑛𝑛0̃ n=1...,q
∑𝑡𝑡 𝜀𝜀𝑚𝑚
𝑚𝑚=1 𝑍𝑍𝑍𝑍𝑠𝑠𝑚𝑚̃ ≥ 𝑍𝑍𝑍𝑍𝑠𝑠0̃ 𝑠𝑠 = 1. … . 𝑤𝑤
𝜀𝜀𝑚𝑚≥ 0 𝑖𝑖 = 1.2 … . 𝑡𝑡 𝑀𝑀𝑀𝑀𝑍𝑍 𝜑𝜑0= ∑𝑤𝑤 𝑣𝑣𝑠𝑠
𝑠𝑠=1 𝑍𝑍𝑍𝑍𝑛𝑛0̃ = 1 s.t ∑𝑞𝑞𝑛𝑛=1𝑣𝑣𝑛𝑛𝑍𝑍𝑍𝑍̃𝑛𝑛𝑛𝑛 = 1 ∑𝑤𝑤 𝑣𝑣𝑠𝑠
𝑠𝑠=1 𝑍𝑍𝑍𝑍𝑠𝑠𝑚𝑚̃ − ∑ 𝑢𝑢𝑞𝑞𝑛𝑛=1 𝑛𝑛𝑍𝑍𝑍𝑍̃ ≤ 0 𝑖𝑖 = 1.2. … . 𝑡𝑡 𝑛𝑛𝑚𝑚 𝑢𝑢𝑠𝑠. 𝑢𝑢𝑛𝑛≥ 0. 𝑠𝑠 = 1.2. … . 𝑤𝑤 . 𝑛𝑛 = 1. … . 𝑖𝑖
∝=∫ yλ D∫ λ D̃(y)dy
̃(𝑍𝑍)dy
∝=𝑘𝑘 + 𝑝𝑝 + 𝑟𝑟3
𝐸𝐸𝐶𝐶̃𝛽𝛽(𝑍𝑍)=β𝐸𝐸𝐶𝐶(𝑍𝑍) y
Ys.t 𝜆𝜆𝑐𝑐̃𝛽𝛽(𝑍𝑍)= β µ𝐴𝐴̃(𝑍𝑍) y
Y(1)
(2)
(4) (2)
(3)
(5)
Equation (5) transforms the input and output amounts of DMUs into the gravity Z-number with abnormal triangular membership function.
8 min 𝜑𝜑0
s.t ∑𝑡𝑡𝑚𝑚=1𝜀𝜀𝑚𝑚𝑍𝑍𝑍𝑍̃ ≤ 𝜑𝜑𝑛𝑛𝑚𝑚 0𝑍𝑍𝑍𝑍̃𝑛𝑛0 n=1...,q ∑𝑡𝑡𝑚𝑚=1𝜀𝜀𝑚𝑚𝑍𝑍𝑍𝑍̃ ≥ 𝑍𝑍𝑍𝑍𝑠𝑠𝑚𝑚 ̃𝑠𝑠0 𝑠𝑠 = 1. … . 𝑤𝑤 𝜀𝜀𝑚𝑚≥ 0 𝑖𝑖 = 1.2 … . 𝑡𝑡
𝑀𝑀𝑀𝑀𝑍𝑍 𝜑𝜑0= ∑𝑤𝑤𝑠𝑠=1𝑣𝑣𝑠𝑠𝑍𝑍𝑍𝑍̃ = 1𝑛𝑛0
s.t ∑𝑞𝑞𝑛𝑛=1𝑣𝑣𝑛𝑛𝑍𝑍𝑍𝑍̃𝑛𝑛𝑛𝑛 = 1
∑𝑤𝑤𝑠𝑠=1𝑣𝑣𝑠𝑠𝑍𝑍𝑍𝑍̃ − ∑ 𝑢𝑢𝑠𝑠𝑚𝑚 𝑞𝑞𝑛𝑛=1 𝑛𝑛𝑍𝑍𝑍𝑍̃ ≤ 0 𝑖𝑖 = 1.2. … . 𝑡𝑡 𝑛𝑛𝑚𝑚 𝑢𝑢𝑠𝑠. 𝑢𝑢𝑛𝑛≥ 0. 𝑠𝑠 = 1.2. … . 𝑤𝑤 . 𝑛𝑛 = 1. … . 𝑖𝑖
∝=∫ yλ∫ λ D̃(y)dy D ̃(𝑍𝑍)dy
∝=𝑘𝑘 + 𝑝𝑝 + 𝑟𝑟3
𝐸𝐸𝐶𝐶̃𝛽𝛽(𝑍𝑍)=β𝐸𝐸𝐶𝐶(𝑍𝑍) y Y
s.t 𝜆𝜆𝑐𝑐̃𝛽𝛽(𝑍𝑍)= β µ𝐴𝐴̃(𝑍𝑍) y Y
(1) (2) (4) (2) (3) (5)
∈
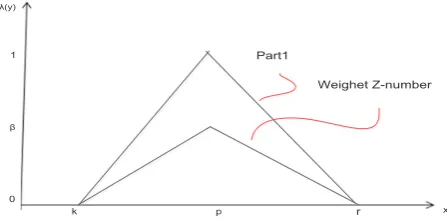
Considering the above Equations, the second parts of Z-numbers aggregate to the first parts, so 2 normal fuzzy numbers are transformed into one abnormal crisp number (See Figure 1)
According to the Figure 2, if a gravity Z-number, holds an abnormal triangular distribution function with characteristic of
Z
α.. TFN (k, p, r), its characters will be N TFN= (k´, p´, r´). Hence the middle characteristic of normal distribution function is calculated from the Equation p= p´. To find the characterα
’ of the fuzzy set, the assumption of direct relation between the reliability of numbers and the line slope of gravity Z-number is considered. To find β’ value, the left side slope of the gravity Z-number which amount is p kβ− is used and using that in the left side Equation of the line relevant to the fuzzy set, the equation (6) is achieved.14 1 =𝑝𝑝 − 𝑘𝑘 𝑝𝑝 + 𝑗𝑗 → 𝑗𝑗 = 1 −𝛽𝛽 𝑝𝑝 − 𝑘𝑘𝛽𝛽𝑝𝑝
𝜆𝜆𝑇𝑇̃(𝑦𝑦) =𝑝𝑝 − 𝑘𝑘 𝑦𝑦 + 1 −𝛽𝛽 𝑝𝑝 − 𝑘𝑘 . 𝑦𝑦 ≤ 𝑝𝑝𝛽𝛽𝑝𝑝
(6)
0 = 𝑃𝑃−𝐾𝐾𝛽𝛽 𝐾𝐾́ + 1 −𝑃𝑃−𝐾𝐾𝛽𝛽𝑃𝑃 →𝑃𝑃−𝐾𝐾𝛽𝛽 𝐾𝐾́ =βP−P+K𝑃𝑃−𝐾𝐾
𝛽𝛽′=𝛽𝛽𝑝𝑝 − 𝑝𝑝 + 𝑘𝑘 𝛽𝛽
(7)
0 = 𝛽𝛽 𝑃𝑃−𝐾𝐾𝐾𝐾́ + 1 −
𝛽𝛽𝑃𝑃 𝑃𝑃−𝐾𝐾 → 𝛽𝛽 𝑃𝑃−𝐾𝐾𝐾𝐾́ = βP−P+K 𝑃𝑃−𝐾𝐾 𝛽𝛽′=𝛽𝛽𝑝𝑝 − 𝑝𝑝 + 𝑘𝑘 𝛽𝛽 (8)
1 = p−rβ p + j →j=1−p−rβp
λT̃(Y)=p−rβ y + 1-p−rβp y≥ p
λT̃(y)=0
0= b−cβ ć+1- βp
p−k→ β p−kŕ=
βp−p+r p−k
ŕ=βp−p+rβ
(9)
𝑁𝑁𝑁𝑁̃𝑛𝑛𝑛𝑛~𝑇𝑇𝑇𝑇𝑁𝑁(k´. p´. r´)
In equation (6), β’ is calculated: Now by putting
2 𝜆𝜆𝑇𝑇̃(𝑦𝑦) = 0
14 1 =𝑝𝑝 − 𝑘𝑘 𝑝𝑝 + 𝑗𝑗 → 𝑗𝑗 = 1 −𝛽𝛽 𝑝𝑝 − 𝑘𝑘𝛽𝛽𝑝𝑝
𝜆𝜆𝑇𝑇̃(𝑦𝑦) =𝑝𝑝 − 𝑘𝑘 𝑦𝑦 + 1 −𝛽𝛽 𝑝𝑝 − 𝑘𝑘 . 𝑦𝑦 ≤ 𝑝𝑝𝛽𝛽𝑝𝑝
(6)
0 = 𝑃𝑃−𝐾𝐾𝛽𝛽 𝐾𝐾́ + 1 −𝑃𝑃−𝐾𝐾𝛽𝛽𝑃𝑃 →𝑃𝑃−𝐾𝐾𝛽𝛽 𝐾𝐾́ =βP−P+K𝑃𝑃−𝐾𝐾
𝛽𝛽′=𝛽𝛽𝑝𝑝 − 𝑝𝑝 + 𝑘𝑘
𝛽𝛽
(7)
0 = 𝑃𝑃−𝐾𝐾𝛽𝛽 𝐾𝐾́ + 1 −𝑃𝑃−𝐾𝐾𝛽𝛽𝑃𝑃 →𝑃𝑃−𝐾𝐾𝛽𝛽 𝐾𝐾́ =βP−P+K𝑃𝑃−𝐾𝐾
𝛽𝛽′=𝛽𝛽𝑝𝑝 − 𝑝𝑝 + 𝑘𝑘
𝛽𝛽
(8)
1 = p−rβ p + j →j=1−p−rβp
λT̃(Y)=p−rβ y + 1-p−rβp y≥ p
λT̃(y)=0
0= b−cβ ć+1- βp
p−k→
β p−kŕ=
βp−p+r p−k
ŕ=βp−p+rβ
(9)
𝑁𝑁𝑁𝑁̃𝑛𝑛𝑛𝑛~𝑇𝑇𝑇𝑇𝑁𝑁(k´. p´. r´)
The same procedure is used to calculate
r
′
.14 1 =𝑝𝑝 − 𝑘𝑘 𝑝𝑝 + 𝑗𝑗 → 𝑗𝑗 = 1 −𝛽𝛽 𝑝𝑝 − 𝑘𝑘𝛽𝛽𝑝𝑝
𝜆𝜆𝑇𝑇̃(𝑦𝑦) =𝑝𝑝 − 𝑘𝑘 𝑦𝑦 + 1 −𝛽𝛽 𝑝𝑝 − 𝑘𝑘 . 𝑦𝑦 ≤ 𝑝𝑝𝛽𝛽𝑝𝑝
(6)
0 =𝑃𝑃−𝐾𝐾𝛽𝛽 𝐾𝐾́ + 1 −𝑃𝑃−𝐾𝐾𝛽𝛽𝑃𝑃 →𝑃𝑃−𝐾𝐾𝛽𝛽 𝐾𝐾́ =βP−P+K𝑃𝑃−𝐾𝐾
𝛽𝛽′=𝛽𝛽𝑝𝑝 − 𝑝𝑝 + 𝑘𝑘 𝛽𝛽
(7)
0 = 𝛽𝛽
𝑃𝑃−𝐾𝐾𝐾𝐾́ + 1 −
𝛽𝛽𝑃𝑃 𝑃𝑃−𝐾𝐾 → 𝛽𝛽 𝑃𝑃−𝐾𝐾𝐾𝐾́ = βP−P+K 𝑃𝑃−𝐾𝐾 𝛽𝛽′=𝛽𝛽𝑝𝑝 − 𝑝𝑝 + 𝑘𝑘 𝛽𝛽 (8)
1 = p−rβ p + j →j=1− βp
p−r
λT̃(Y)=p−rβ y + 1-p−rβp y≥ p
λT̃(y)=0
0=b−cβ ć+1- βp
p−k→
β p−kŕ=
βp−p+r p−k
ŕ=βp−p+rβ
(9)
𝑁𝑁𝑁𝑁̃𝑛𝑛𝑛𝑛~𝑇𝑇𝑇𝑇𝑁𝑁(k´. p´. r´)
9
0 β 1 Part1 Weighet Z-number x λ(y)k p r
10
0 β
1 Converted Z-number
Weighet Z-number
x
λ(y)
k r
K´ p,p´ r´
Figure 1. Z-number After Multiplying the Reliability Value.42 Figure 2. Convert Weighted Z-Numbers to Normal Fuzzy
Numbers.42 Indices m n s t q w DMU m DMU 0 Parameters 7 𝒁𝒁𝒁𝒁̃ 𝒏𝒏𝒏𝒏 𝑪𝑪𝒁𝒁̃ 𝒏𝒏𝒏𝒏 𝑫𝑫𝒁𝒁̃ 𝒏𝒏𝒏𝒏 𝒁𝒁𝒁𝒁̃ 𝒔𝒔𝒏𝒏 7 𝒁𝒁𝒁𝒁̃ 𝒏𝒏𝒏𝒏 𝑪𝑪𝒁𝒁̃ 𝒏𝒏𝒏𝒏 𝑫𝑫𝒁𝒁̃ 𝒏𝒏𝒏𝒏 𝒁𝒁𝒁𝒁̃ 𝒔𝒔𝒏𝒏 7 𝒁𝒁𝒁𝒁𝒏𝒏𝒏𝒏̃ 𝑪𝑪𝒁𝒁𝒏𝒏𝒏𝒏̃ 𝑫𝑫𝒁𝒁𝒏𝒏𝒏𝒏̃ 𝒁𝒁𝒁𝒁𝒔𝒔𝒏𝒏̃ 7 𝒁𝒁𝒁𝒁𝒏𝒏𝒏𝒏̃ 𝑪𝑪𝒁𝒁̃ 𝒏𝒏𝒏𝒏 𝑫𝑫𝒁𝒁𝒏𝒏𝒏𝒏̃ 𝒁𝒁𝒁𝒁𝒔𝒔𝒏𝒏̃ Variables
7
𝜺𝜺𝒎𝒎 𝝋𝝋𝟎𝟎 7 𝜺𝜺𝒎𝒎 𝝋𝝋𝟎𝟎Indicators of DMUs
Indicators of inputs
Indicators of outputs
Number of DMUs
Number of inputs
Number of outputs
The m th DMU
The target DMU (m=0)
Z-number value of input n related to DMU m
Fuzzy value of input n related to DMU m
Fuzzy reliability value of input n related to DMU m
Z-number value of input r related to DMUm
Weight variables in the proposed model for obtaining the efficient
In the proposed Z-DEA model, the expert represents input and output amounts for the mth DMU in Z-number values.
11 . 𝐷𝐷𝐷𝐷̃𝑛𝑛𝑛𝑛 𝐶𝐶𝐷𝐷̃𝑛𝑛𝑛𝑛
𝑁𝑁𝐷𝐷̃𝑛𝑛𝑛𝑛~𝑇𝑇𝑇𝑇𝑁𝑁(k´. p´. r´)
defuzzifies with COG method and calculates the reliability value of. This amount is added to the first
pair,
11
. 𝐷𝐷𝐷𝐷̃𝑛𝑛𝑛𝑛 𝐶𝐶𝐷𝐷̃𝑛𝑛𝑛𝑛
𝑁𝑁𝐷𝐷̃𝑛𝑛𝑛𝑛~𝑇𝑇𝑇𝑇𝑁𝑁(k´. p´. r´)
and then the equations (8) and (9) are exerted to transform the gravity Z- numbers into triangular fuzzy numbers which are shown by
12
1 =𝑝𝑝 − 𝑘𝑘 𝑝𝑝 + 𝑗𝑗 → 𝑗𝑗 = 1 −𝛽𝛽 𝑝𝑝 − 𝑘𝑘 𝛽𝛽𝑝𝑝
𝜆𝜆𝑇𝑇̃(𝑦𝑦) =𝑝𝑝 − 𝑘𝑘 𝑦𝑦 + 1 −𝛽𝛽 𝑝𝑝 − 𝑘𝑘 . 𝑦𝑦 ≤ 𝑝𝑝𝛽𝛽𝑝𝑝
(6)
0 =𝑃𝑃−𝐾𝐾𝛽𝛽 𝐾𝐾́ + 1 −𝑃𝑃−𝐾𝐾𝛽𝛽𝑃𝑃 →𝑃𝑃−𝐾𝐾𝛽𝛽 𝐾𝐾́ =βP−P+K𝑃𝑃−𝐾𝐾
𝛽𝛽′=𝛽𝛽𝑝𝑝 − 𝑝𝑝 + 𝑘𝑘
𝛽𝛽
(7)
0 = 𝛽𝛽
𝑃𝑃−𝐾𝐾𝐾𝐾́ + 1 − 𝛽𝛽𝑃𝑃 𝑃𝑃−𝐾𝐾 → 𝛽𝛽 𝑃𝑃−𝐾𝐾𝐾𝐾́ = βP−P+K 𝑃𝑃−𝐾𝐾 𝛽𝛽′=𝛽𝛽𝑝𝑝 − 𝑝𝑝 + 𝑘𝑘 𝛽𝛽 (8)
1 = p−rβ p + j →j=1
−
p−rβpλT̃(Y)
=
p−rβy +
1-
p−rβpy≥ p
λT̃(y)
=
00
=
b−cβć
+
1-
p−kβp→
p−kβŕ
=
βp−p+rp−kŕ
=
βp−p+rβ(9)
𝑁𝑁𝑁𝑁̃𝑛𝑛𝑛𝑛~𝑇𝑇𝑇𝑇𝑁𝑁(k´. p´. r´)
𝑘𝑘𝑛𝑛𝑛𝑛=𝑖𝑖𝑛𝑛𝑛𝑛+ 𝑙𝑙𝑛𝑛𝑛𝑛3 + 𝑜𝑜𝑛𝑛𝑛𝑛
𝑝𝑝́𝑛𝑛𝑛𝑛=𝑝𝑝𝑛𝑛𝑛𝑛 𝑘𝑘́𝑛𝑛𝑛𝑛=𝛽𝛽𝑛𝑛𝑛𝑛𝑝𝑝𝑛𝑛𝑛𝑛−𝑝𝑝𝑘𝑘 𝑛𝑛𝑛𝑛+ 𝑘𝑘𝑛𝑛𝑛𝑛 𝑛𝑛𝑛𝑛 𝑟𝑟́𝑛𝑛𝑛𝑛=𝛽𝛽𝑛𝑛𝑛𝑛𝑝𝑝𝑛𝑛𝑛𝑛−𝑝𝑝𝛽𝛽 𝑛𝑛𝑛𝑛+ 𝑝𝑝𝑛𝑛𝑛𝑛 𝑛𝑛𝑛𝑛 (10) 𝑦𝑦𝑛𝑛𝑛𝑛𝑙𝑙 =𝛼𝛼𝛼𝛼𝑛𝑛𝑛𝑛𝛽𝛽𝑦𝑦𝑛𝑛𝑛𝑛 𝑛𝑛 − 𝛽𝛽𝑦𝑦 𝑛𝑛𝑛𝑛𝑛𝑛 + 𝛽𝛽𝑦𝑦𝑛𝑛𝑛𝑛𝑙𝑙 𝛽𝛽𝛼𝛼𝑗𝑗𝑗𝑗 𝑦𝑦𝑛𝑛𝑛𝑛𝑢𝑢 =𝛼𝛼𝑦𝑦𝑛𝑛𝑛𝑛𝛽𝛽𝑦𝑦𝑛𝑛𝑛𝑛 𝑛𝑛 − 𝛽𝛽𝑦𝑦 𝑛𝑛𝑛𝑛𝑛𝑛 + 𝛽𝛽𝑦𝑦𝑛𝑛𝑛𝑛𝑢𝑢 𝛽𝛽𝛼𝛼𝑗𝑗𝑗𝑗
α𝛼𝛼sm=pxsm
l + px sm m + px
sm u
αynm
𝛼𝛼smm = βxsmm
(11)
11 𝑘𝑘𝑛𝑛𝑛𝑛=𝑖𝑖𝑛𝑛𝑛𝑛+ 𝑙𝑙𝑛𝑛𝑛𝑛3 + 𝑜𝑜𝑛𝑛𝑛𝑛
𝑝𝑝́𝑛𝑛𝑛𝑛=𝑝𝑝𝑛𝑛𝑛𝑛 𝑘𝑘́𝑛𝑛𝑛𝑛=𝛽𝛽𝑛𝑛𝑛𝑛𝑝𝑝𝑛𝑛𝑛𝑛−𝑝𝑝𝑘𝑘 𝑛𝑛𝑛𝑛+ 𝑘𝑘𝑛𝑛𝑛𝑛 𝑛𝑛𝑛𝑛 𝑟𝑟́𝑛𝑛𝑛𝑛=𝛽𝛽𝑛𝑛𝑛𝑛𝑝𝑝𝑛𝑛𝑛𝑛−𝑝𝑝𝛽𝛽 𝑛𝑛𝑛𝑛+ 𝑝𝑝𝑛𝑛𝑛𝑛 𝑛𝑛𝑛𝑛 (10)
Equations (10), are calculation formulas for the characteristics of fuzzy sets
15 𝑁𝑁𝑁𝑁̃𝑖𝑖𝑖𝑖 from the relevant
Z-number values.
12
1 =𝑝𝑝 − 𝑘𝑘 𝑝𝑝 + 𝑗𝑗 → 𝑗𝑗 = 1 −𝛽𝛽 𝑝𝑝 − 𝑘𝑘𝛽𝛽𝑝𝑝
𝜆𝜆𝑇𝑇̃(𝑦𝑦) =𝑝𝑝 − 𝑘𝑘 𝑦𝑦 + 1 −𝛽𝛽 𝑝𝑝 − 𝑘𝑘 . 𝑦𝑦 ≤ 𝑝𝑝𝛽𝛽𝑝𝑝
(6)
0 =𝑃𝑃−𝐾𝐾𝛽𝛽 𝐾𝐾́ + 1 −𝑃𝑃−𝐾𝐾𝛽𝛽𝑃𝑃 →𝑃𝑃−𝐾𝐾𝛽𝛽 𝐾𝐾́ =βP−P+K𝑃𝑃−𝐾𝐾
𝛽𝛽′=𝛽𝛽𝑝𝑝 − 𝑝𝑝 + 𝑘𝑘
𝛽𝛽
(7)
0 =𝑃𝑃−𝐾𝐾𝛽𝛽 𝐾𝐾́ + 1 −𝑃𝑃−𝐾𝐾𝛽𝛽𝑃𝑃 →𝑃𝑃−𝐾𝐾𝛽𝛽 𝐾𝐾́ =βP−P+K𝑃𝑃−𝐾𝐾
𝛽𝛽′=𝛽𝛽𝑝𝑝 − 𝑝𝑝 + 𝑘𝑘
𝛽𝛽
(8)
1 = p−rβ p + j →j=1
−
βpp−r
λT̃(Y)
=
p−rβy +
1-
p−rβp y≥ pλT̃(y)
=
00
=
b−cβć
+
1-
p−kβp→
p−kβŕ
=
βp−p+rp−kŕ
=
βp−p+rβ(9)
𝑁𝑁𝑁𝑁̃𝑛𝑛𝑛𝑛~𝑇𝑇𝑇𝑇𝑁𝑁(k´. p´. r´)
𝑘𝑘𝑛𝑛𝑛𝑛=𝑖𝑖𝑛𝑛𝑛𝑛+ 𝑙𝑙𝑛𝑛𝑛𝑛3 + 𝑜𝑜𝑛𝑛𝑛𝑛
𝑝𝑝́𝑛𝑛𝑛𝑛=𝑝𝑝𝑛𝑛𝑛𝑛 𝑘𝑘́𝑛𝑛𝑛𝑛=𝛽𝛽𝑛𝑛𝑛𝑛𝑝𝑝𝑛𝑛𝑛𝑛−𝑝𝑝𝑘𝑘 𝑛𝑛𝑛𝑛+ 𝑘𝑘𝑛𝑛𝑛𝑛 𝑛𝑛𝑛𝑛 𝑟𝑟́𝑛𝑛𝑛𝑛=𝛽𝛽𝑛𝑛𝑛𝑛𝑝𝑝𝑛𝑛𝑛𝑛−𝑝𝑝𝛽𝛽 𝑛𝑛𝑛𝑛+ 𝑝𝑝𝑛𝑛𝑛𝑛 𝑛𝑛𝑛𝑛 (10) 𝑦𝑦𝑛𝑛𝑛𝑛𝑙𝑙 =𝛼𝛼𝛼𝛼𝑛𝑛𝑛𝑛𝛽𝛽𝑦𝑦𝑛𝑛𝑛𝑛 𝑛𝑛 − 𝛽𝛽𝑦𝑦 𝑛𝑛𝑛𝑛𝑛𝑛 + 𝛽𝛽𝑦𝑦𝑛𝑛𝑛𝑛𝑙𝑙 𝛽𝛽𝛼𝛼𝑗𝑗𝑗𝑗 𝑦𝑦𝑛𝑛𝑛𝑛𝑢𝑢 =𝛼𝛼𝑦𝑦𝑛𝑛𝑛𝑛𝛽𝛽𝑦𝑦𝑛𝑛𝑛𝑛 𝑛𝑛 − 𝛽𝛽𝑦𝑦𝑛𝑛𝑛𝑛𝑛𝑛 + 𝛽𝛽𝑦𝑦𝑛𝑛𝑛𝑛𝑢𝑢 𝛽𝛽𝛼𝛼𝑗𝑗𝑗𝑗
α𝛼𝛼sm=pxsm
l + px
smm + pxsmu
αynm
𝛼𝛼smm = βxsmm
(11)
Using the mentioned transformation model, the fuzzy Z-number is got for DEA. Equations (11) are formulas to transform model inputs into triangular fuzzy numbers.
13 𝑦𝑦𝑛𝑛𝑛𝑛𝑙𝑙 =𝛼𝛼𝛼𝛼𝑛𝑛𝑛𝑛𝛽𝛽𝑦𝑦𝑛𝑛𝑛𝑛 𝑛𝑛 − 𝛽𝛽𝑦𝑦 𝑛𝑛𝑛𝑛𝑛𝑛 + 𝛽𝛽𝑦𝑦𝑛𝑛𝑛𝑛𝑙𝑙 𝛽𝛽𝛼𝛼𝑗𝑗𝑗𝑗 𝑦𝑦𝑛𝑛𝑛𝑛𝑢𝑢 =𝛼𝛼𝑦𝑦𝑛𝑛𝑛𝑛𝛽𝛽𝑦𝑦𝑛𝑛𝑛𝑛 𝑛𝑛 − 𝛽𝛽𝑦𝑦 𝑛𝑛𝑛𝑛𝑛𝑛 + 𝛽𝛽𝑦𝑦𝑛𝑛𝑛𝑛𝑢𝑢 𝛽𝛽𝛼𝛼𝑗𝑗𝑗𝑗
α𝛼𝛼sm=pxsm
l + px
sm
m + px
smu
αynm
𝛼𝛼smm = βxsmm
(12) 𝑀𝑀𝑀𝑀𝛼𝛼 𝜑𝜑ℎ= ∑ 𝑣𝑣𝑠𝑠 𝑤𝑤 𝑠𝑠=1 (𝛼𝛼𝑠𝑠ℎ𝑙𝑙 . 𝛼𝛼𝑠𝑠ℎ𝑛𝑛. 𝛼𝛼𝑠𝑠ℎ𝑢𝑢) St. ∑ 𝑣𝑣𝑗𝑗 𝑞𝑞 𝑛𝑛=1
(𝑦𝑦𝑛𝑛ℎ𝑙𝑙 . 𝑦𝑦𝑛𝑛ℎ𝑛𝑛. 𝑦𝑦𝑛𝑛ℎ𝑢𝑢 ) = (1𝑙𝑙. 1. 1𝑢𝑢)
∑ 𝑣𝑣𝑤𝑤𝑠𝑠=1 𝑠𝑠(𝛼𝛼𝑠𝑠𝑛𝑛𝑙𝑙 . 𝑦𝑦𝑠𝑠𝑛𝑛𝑛𝑛. 𝑦𝑦𝑠𝑠𝑛𝑛𝑢𝑢 ) − ∑𝑞𝑞𝑛𝑛=1𝑢𝑢𝑛𝑛(𝑦𝑦𝑛𝑛𝑛𝑛𝑙𝑙 . 𝑦𝑦𝑛𝑛𝑛𝑛𝑛𝑛. 𝑦𝑦𝑛𝑛𝑛𝑛𝑢𝑢 ) ≤
0 𝑚𝑚 = 1. … . 𝑡𝑡
𝑣𝑣𝑠𝑠. 𝑢𝑢𝑛𝑛≥ 0 . 𝑟𝑟 = 1.2. … . 𝑠𝑠 𝑛𝑛 = 1.2. … . 𝑚𝑚
(13)
𝑋𝑋̃ ~𝑇𝑇𝑇𝑇𝑇𝑇(𝛼𝛼𝑠𝑠𝑛𝑛 𝑠𝑠ℎ𝑙𝑙 . 𝛼𝛼𝑠𝑠ℎ𝑛𝑛. 𝛼𝛼𝑠𝑠ℎ𝑢𝑢).
𝑀𝑀𝑀𝑀𝑋𝑋 𝜑𝜑ℎ= ∑ 𝛼𝛼̅𝑤𝑤𝑠𝑠=1 𝑠𝑠ℎ
∑ 𝑦𝑦̅𝑛𝑛ℎ= 1 𝑞𝑞
𝑛𝑛=1
∑ 𝛼𝛼̅𝑤𝑤𝑠𝑠=1 𝑠𝑠𝑛𝑛− ∑𝑞𝑞𝑛𝑛=1𝑦𝑦̅𝑛𝑛𝑛𝑛≤ 0 𝑚𝑚 = 1.2. … . 𝑡𝑡
𝑢𝑢𝑗𝑗(𝛽𝛽𝑦𝑦𝑛𝑛𝑛𝑛𝑛𝑛 + (1 − 𝛽𝛽)𝑦𝑦𝑛𝑛𝑛𝑛𝑙𝑙 ) ≤ 𝑦𝑦̅𝑛𝑛𝑛𝑛≤ 𝑢𝑢𝑛𝑛(𝛽𝛽𝑦𝑦𝑛𝑛𝑛𝑛𝑛𝑛 + (1 − 𝛽𝛽)𝛼𝛼𝑛𝑛𝑛𝑛𝑢𝑢 ) 𝑚𝑚 = 1. … . 𝑡𝑡
𝑛𝑛 = 1. … . 𝑞𝑞
𝑣𝑣𝑠𝑠(𝛽𝛽𝛼𝛼𝑠𝑠𝑛𝑛𝑛𝑛 + (1 − 𝛽𝛽)𝛼𝛼𝑠𝑠𝑛𝑛𝑙𝑙 ) ≤ 𝛼𝛼̅𝑠𝑠𝑛𝑛≤ 𝑢𝑢𝑠𝑠(𝛽𝛽𝛼𝛼𝑠𝑠𝑛𝑛𝑛𝑛 + (1 − 𝛽𝛽)𝑦𝑦𝑠𝑠𝑛𝑛𝑢𝑢 ) 𝑚𝑚 = 1. … . 𝑡𝑡
. 𝑛𝑛 = 1. ….w
𝑣𝑣𝑠𝑠. 𝑢𝑢𝑛𝑛≥ 0 . 𝑟𝑟 = 1. … . 𝑠𝑠 . 𝑗𝑗 = 1. … . 𝑚𝑚
(14) In addition, Equations (12), show the transformation of
output numbers into relevant normal fuzzy numbers.
13 𝑦𝑦𝑛𝑛𝑛𝑛𝑙𝑙 =𝛼𝛼𝛼𝛼𝑛𝑛𝑛𝑛𝛽𝛽𝑦𝑦𝑛𝑛𝑛𝑛 𝑛𝑛 − 𝛽𝛽𝑦𝑦 𝑛𝑛𝑛𝑛𝑛𝑛 + 𝛽𝛽𝑦𝑦𝑛𝑛𝑛𝑛𝑙𝑙 𝛽𝛽𝛼𝛼𝑗𝑗𝑗𝑗 𝑦𝑦𝑛𝑛𝑛𝑛𝑢𝑢 =𝛼𝛼𝑦𝑦𝑛𝑛𝑛𝑛𝛽𝛽𝑦𝑦𝑛𝑛𝑛𝑛 𝑛𝑛 − 𝛽𝛽𝑦𝑦 𝑛𝑛𝑛𝑛𝑛𝑛 + 𝛽𝛽𝑦𝑦𝑛𝑛𝑛𝑛𝑢𝑢 𝛽𝛽𝛼𝛼𝑗𝑗𝑗𝑗
α𝛼𝛼sm=pxsm
l + px
sm
m + px
sm u
αynm
𝛼𝛼smm = βxsmm
(12) 𝑀𝑀𝑀𝑀𝛼𝛼𝑀𝑀𝜑𝜑ℎ= ∑ 𝑣𝑣𝑠𝑠 𝑤𝑤 𝑠𝑠𝑠𝑠 (𝛼𝛼𝑠𝑠ℎ𝑙𝑙 . 𝛼𝛼𝑠𝑠ℎ𝑛𝑛. 𝛼𝛼𝑠𝑠ℎ𝑢𝑢) St. ∑ 𝑣𝑣𝑗𝑗 𝑞𝑞 𝑛𝑛𝑠𝑠
(𝑦𝑦𝑛𝑛ℎ𝑙𝑙 . 𝑦𝑦𝑛𝑛ℎ𝑛𝑛. 𝑦𝑦𝑛𝑛ℎ𝑢𝑢 ) = (1𝑙𝑙. 1. 1𝑢𝑢)
∑𝑤𝑤𝑠𝑠𝑠𝑠𝑣𝑣𝑠𝑠(𝛼𝛼𝑠𝑠𝑛𝑛𝑙𝑙 . 𝑦𝑦𝑠𝑠𝑛𝑛𝑛𝑛. 𝑦𝑦𝑠𝑠𝑛𝑛𝑢𝑢 ) − ∑𝑞𝑞𝑛𝑛𝑠𝑠𝑢𝑢𝑛𝑛(𝑦𝑦𝑛𝑛𝑛𝑛𝑙𝑙 . 𝑦𝑦𝑛𝑛𝑛𝑛𝑛𝑛 . 𝑦𝑦𝑛𝑛𝑛𝑛𝑢𝑢 ) ≤
0𝑀𝑀𝑀𝑀𝑀𝑚𝑚 = 1. … . 𝑡𝑡𝑀
𝑣𝑣𝑠𝑠. 𝑢𝑢𝑛𝑛≥ 0𝑀.𝑀𝑀𝑀𝑟𝑟 = 1.2. … . 𝑠𝑠𝑀𝑀𝑀𝑀𝑛𝑛 = 1.2. … . 𝑚𝑚
(13)
𝑋𝑋̃ ~𝑇𝑇𝑇𝑇𝑇𝑇(𝛼𝛼𝑠𝑠𝑛𝑛 𝑠𝑠ℎ𝑙𝑙 . 𝛼𝛼𝑠𝑠ℎ𝑛𝑛. 𝛼𝛼𝑠𝑠ℎ𝑢𝑢).
16
𝑋𝑋
̃ ~𝑇𝑇𝑇𝑇𝑇𝑇(𝑥𝑥
𝑠𝑠𝑠𝑠 𝑠𝑠ℎ𝑙𝑙. 𝑥𝑥
𝑠𝑠ℎ𝑠𝑠. 𝑥𝑥
𝑠𝑠ℎ𝑢𝑢)
is
the normal fuzzyconverted number of sth output of DMU
m. Then the fuzzy programming of Z-number CCR model is presented in the Expression (13). Equation(14), is the dual model of Z-number CCR.
15 5.4. Reliability test?
NO
YES 5.1. Conceptual model
5.2. Design of questionnaire
5.3.Data collection
Outputs:
Preparedness, reporting culture, learning culture, awareness, management commitment, flexibility, Teamwork, Redundancy , Fault-tolerance, attention to patients, specialty level, quality of care, high level policy, communication and cooperation quality.
Input: Dummy input
5.5. Efficiency measurement by
Z-number DEA 5.6. Determining the optimal alpha 5.7.Performance sensitivity analysis
5.8.Calculate weight of each factor 5.9. Validation and verification
5.10.Comparing Z-number DEA and FDEA
14
𝑀𝑀𝑀𝑀𝑀𝑀 𝜑𝜑ℎ= ∑ 𝑥𝑥̅𝑤𝑤𝑠𝑠=1 𝑠𝑠ℎ
∑ 𝑦𝑦̅𝑛𝑛ℎ= 1 𝑞𝑞
𝑛𝑛=1
∑ 𝑥𝑥̅𝑠𝑠𝑠𝑠𝑤𝑤
𝑠𝑠=1 − ∑𝑞𝑞𝑛𝑛=1𝑦𝑦̅𝑛𝑛𝑠𝑠≤ 0 𝑚𝑚 = 1.2. … . 𝑡𝑡
𝑢𝑢𝑗𝑗(𝛽𝛽𝑦𝑦𝑛𝑛𝑠𝑠𝑠𝑠 + (1 − 𝛽𝛽)𝑦𝑦𝑛𝑛𝑠𝑠𝑙𝑙 ) ≤ 𝑦𝑦̅𝑛𝑛𝑠𝑠≤ 𝑢𝑢𝑛𝑛(𝛽𝛽𝑦𝑦𝑛𝑛𝑠𝑠𝑠𝑠 + (1 − 𝛽𝛽)𝑥𝑥𝑛𝑛𝑠𝑠𝑢𝑢 ) 𝑚𝑚 = 1. … . 𝑡𝑡
𝑛𝑛 = 1. … . 𝑞𝑞
𝑣𝑣𝑠𝑠(𝛽𝛽𝑥𝑥𝑠𝑠𝑠𝑠𝑠𝑠 + (1 − 𝛽𝛽)𝑥𝑥𝑠𝑠𝑠𝑠𝑙𝑙 ) ≤ 𝑥𝑥̅𝑠𝑠𝑠𝑠≤ 𝑢𝑢𝑠𝑠(𝛽𝛽𝑥𝑥𝑠𝑠𝑠𝑠𝑠𝑠 + (1 − 𝛽𝛽)𝑦𝑦𝑠𝑠𝑠𝑠𝑢𝑢) 𝑚𝑚 = 1. … . 𝑡𝑡
. 𝑛𝑛 = 1. ….w
𝑣𝑣𝑠𝑠. 𝑢𝑢𝑛𝑛≥ 0 . 𝑟𝑟 = 1. … . 𝑠𝑠 . 𝑗𝑗 = 1. … . 𝑚𝑚
(14)
The schematic view of the proposed approach is demonstrated in Figure3.
Conceptual Model
Choosing the input/output variables is one of the most important stages in the Z-number DEA model. This
paper uses preparedness, reporting culture, learning culture, awareness, management commitment, flexibility, teamwork, redundancy and fault-tolerance variables as the outputs variables in RE framework. Output variables in trust framework include attention to patients, specialty level, quality of care, high-level policy, communication and cooperation quality. There is no input variable considered. Therefore, a dummy variable is defined as the input variable.
Questionnaire Designation
In this paper, an appropriate questionnaire was applied to evaluate performance by considering the RE and trust effective indices in healthcare. The questionnaire was confirmed and entitled by the experts in terms of content. The designed questionnaire is presented in Appendix I.
Results and Discussion
Case Study
17
Patient Enter
Patient Initial Acceptance
Emergency General Treatment
Initial Tests
The Patient's Condition
Outpatient Treatment Specialized areas
Prescription medicine Pharmacy Orthopedics
Gastroenterology Ent Rheumatology
Infectious
Pulmonology
Neurology
Endocrinology
Treatment End
Exit
Hospitalization
Need Treatment Initial Tests
Patient allocation
ICU CUU Surgery
Room
Intensive Care
Exit
Exit Exit YES
NO
NO EXIT
YES
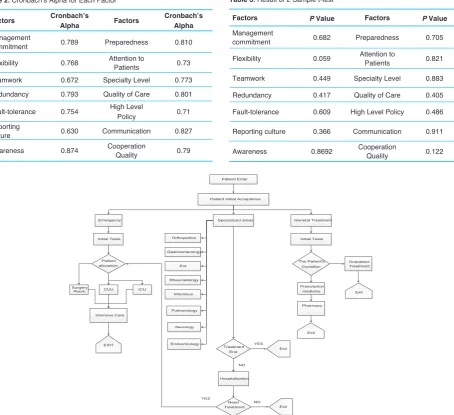
Figure 4. Clinical pathway in considered emergency department
Table 2. Cronbach’s Alpha for Each Factor
Factors Cronbach’s
Alpha Factors
Cronbach’s Alpha
Management
commitment 0.789 Preparedness 0.810
Flexibility 0.768 Attention to Patients 0.73
Teamwork 0.672 Specialty Level 0.773
Redundancy 0.793 Quality of Care 0.801
Fault-tolerance 0.754 High Level Policy 0.71
Reporting
culture 0.630 Communication 0.827
Awareness 0.874 Cooperation Quality 0.79
Table 3. Result of 2 Sample t-test
Factors P Value Factors P Value
Management
commitment 0.682 Preparedness 0.705
Flexibility 0.059 Attention to Patients 0.821
Teamwork 0.449 Specialty Level 0.883
Redundancy 0.417 Quality of Care 0.405
Fault-tolerance 0.609 High Level Policy 0.486
Reporting culture 0.366 Communication 0.911
The study is done in a hospital located in Tehran, Iran. The hospital was built incompletely in the 1950s and dedicated to the ministry of health. The hospital started to work as a medical clinic in 1954. The total area is 18500 square meter with 25 000 square meter substructure. The hospital is equipped with 351 bed, among them, 345 are approved. There are subspecialty departments including general surgery, orthopedic, neurosurgery, ENT, internal medicine, gynecology, general ICU, neurosurgery ICU, CCU, POST CCU, dialysis, operating theaters, EDs, ED pharmacy, ED laboratory and para-clinical units including the central laboratory, central pharmacy, radiology, endoscopy, colonoscopy, echocardiography, stress test, bronchoscopy and breath tests, physiotherapy, physical medicine and rehabilitation.
Figure4 is a flowchart of patients’ curing process in ED.
Data Collection
Data has to be collected in this step, therefore the patients of the ED were requested to fill the questionnaire by marking 1 to 20 based on their idea about each question. Among them, 73 patients completely marked questions.
Reliability Test on Questionnaire
A very common method to measure the internal consistency
of the questionnaire responses is Cronbach’s alpha using SPSS software. Obviously the closer Cronbach’s alpha coefficient is to 1, the more internal consistency is between the questions, and consequently the more homogeneous are the questions. If the Cronbach’s alpha is greater than 0.6, it shows that the data are valid enough to go to the next step.
The total value of Cronbach’s alpha is 71%, hence the collected data are verified. Table 2shows the Cronbach’s alpha of each factor, respectively.
Another performed statistical test is the randomness test. For each factor, 2 samples of 18 data are selected and using Minitab, the P value of factors is estimated by 2 sample t test which is higher than 0.05, confirming that the data are randomly collected. The respective results are shown in Table 3.
Efficiency Measurement by Z-Number DEA
Firstly, for calculating the efficiency value of each alpha cut, we should specify the reliability values of all input and output variables. Data reliability is described in shape of 3 linguistic variables namely Sure, Usually and Likely. Reliability values are determined by experts according to the Table 4.42
Since the Z-number DEA deals with uncertainty using fuzzy approach, we calculate the efficiency considering 14 different
α
- cuts. In this study; including: 0.01, 0.05, 0.1, 0.2, 0.3, 0.4, 0.5, 0.6, 0.7, 0.8, 0.9, 0.95, 0.99 and 1.Determining the Optimal Alpha
To determine the optimal alpha, a noise analysis is applied. The results are shown in Table 5. The Pearson
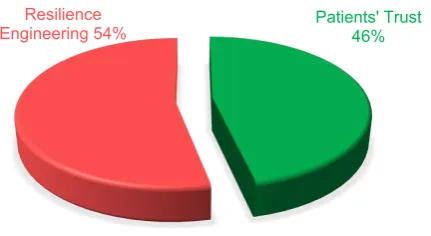
22
Patients' Trust 46%
Resilience Engineering 54%
Figure 5. Total Weight of Resilience Engineering and Patients’ Trust.
23
Management commitment
5%
Flexibility 19%
Teamwork 8%
Redundancy 4% Fault-tolerance
9% Reporting culture
9% Awareness
3% Preparedness
4% Attention to
Patients 6% Specialty
Level 9% Quality of Care
5% High Level Policy
5%
Communication
8% Cooperation Quality
6%
Figure 6. Weight of Resilience Engineering and Patients’ Trust Indicators.
Table 4. Classification of Reliability Values Given by Experts
Z=(C,D) Interval DATA Membership
Functions Parameters
[15,20] Sure [15,17.5,20]
[11,15] Usually [10,12.5,15]
[1,11] Likely [0,5,10]
Table 5. Result of Noise Analysis
α- Cuts
Pearson Correlation
Average
α- cuts
Pearson Correlation
Average
α = 0.01 0.165 α = 0.6 0.148
α = 0.05 0.352 α = 0.7 0.141
α = 0.1 0.177 α = 0.8 0.220
α = 0.2 0.189 α = 0.9 0.146
α = 0.3 0.190 α = 0.95 0.177
α = 0.4 0.191 α = 0.99 0.119
correlation average of the efficiencies before and after the noise exertion between every alpha is compared and the maximum average correlation is 0.352 which refers to the alpha equal to 0.05 as the optimal alpha.
Sensitivity Analysis
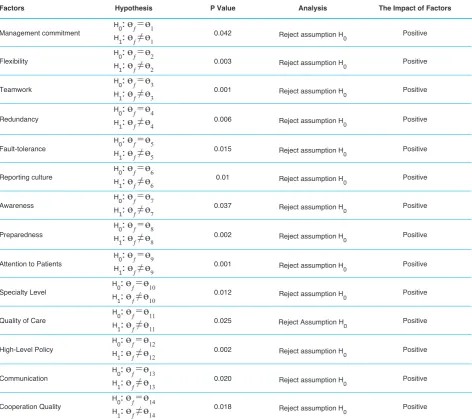
Sensitivity analysis is executed to calculate the weight of factors. In this regard, Z-number DEA model is applied for efficiency score calculation. After calculation of efficiency scores for the existence of all factors, each factor should be eliminated from the model. As the efficiency is estimated in absence of each factor, the performance of each eliminated factor can be investigated by comparing the obtained efficiency scores to calculated efficiency scores in the presence of all factors using paired t test. The paired t test calculates the differences between each pair of efficiency measurements got from before and after the factor’s elimination.43
The paired t test for each factor is performed considering
H0 and H1 presented in equation (15). The results show that after eliminating each factor, the efficiency decreases which describes the positive impact of the removed factor. Respective results are shown in Table 6.
21
𝐻𝐻0:𝜃𝜃𝑓𝑓= 𝜃𝜃𝑖𝑖 f: full efficiency 𝐻𝐻1: 𝜃𝜃𝑓𝑓≠ 𝜃𝜃𝑖𝑖 i: factor i efficiency
(15)
𝑊𝑊𝑖𝑖=∑|𝜃𝜃 − 𝜃𝜃|𝜃𝜃 − 𝜃𝜃𝑖𝑖| 𝑖𝑖|
θ: full average efficiency, 𝜃𝜃𝑖𝑖:average efficiency of the ith factor
(16)
Calculation of Weight Factors
To obtain the weight of each factor the average efficiency is calculated using equation (16). The flexibility has the maximum weight of 19% and other factors have almost the same weights. The calculated weights of each factor and total concepts are demonstrated in Figures 5 and 6.
21
𝐻𝐻0:𝜃𝜃𝑓𝑓= 𝜃𝜃𝑖𝑖 f: full efficiency
𝐻𝐻1: 𝜃𝜃𝑓𝑓≠ 𝜃𝜃𝑖𝑖 i: factor i efficiency
(15)
𝑊𝑊𝑖𝑖=∑|𝜃𝜃 𝜃 𝜃𝜃|𝜃𝜃 𝜃 𝜃𝜃𝑖𝑖| 𝑖𝑖|
θ: full average efficiency, 𝜃𝜃𝑖𝑖: average efficiency of the ith factor
(16)
Table 6. Paired T Test Results
Factors Hypothesis P Value Analysis The Impact of Factors
Management commitment H0
:
ɵ
ƒ= ɵ
1H1
:
ɵ
ƒ≠ ɵ
1 0.042 Reject assumption H0 PositiveFlexibility HH0
:
ɵ
ƒ= ɵ
21
:
ɵ
ƒ≠ ɵ
2 0.003 Reject assumption H0 PositiveTeamwork HH0
:
ɵ
ƒ= ɵ
31
:
ɵ
ƒ≠ ɵ
3 0.001 Reject assumption H0 PositiveRedundancy
H0
:
ɵ
ƒ= ɵ
4H1
:
ɵ
ƒ≠ ɵ
4 0.006 Reject assumption H0 PositiveFault-tolerance HH0
:
ɵ
ƒ= ɵ
51
:
ɵ
ƒ≠ ɵ
5 0.015 Reject assumption H0 PositiveReporting culture HH0
:
ɵ
ƒ= ɵ
61
:
ɵ
ƒ≠ ɵ
6 0.01 Reject assumption H0 PositiveAwareness HH0
:
ɵ
ƒ= ɵ
71
:
ɵ
ƒ≠ ɵ
7 0.037 Reject assumption H0 PositivePreparedness
H0
:
ɵ
ƒ= ɵ
8H1
:
ɵ
ƒ≠ ɵ
8 0.002 Reject assumption H0 PositiveAttention to Patients HH0
:
ɵ
ƒ= ɵ
91
:
ɵ
ƒ≠ ɵ
9 0.001 Reject assumption H0 PositiveSpecialty Level HH0
:
ɵ
ƒ= ɵ
101
:
ɵ
ƒ≠ ɵ
10 0.012 Reject assumption H0 PositiveQuality of Care HH0
:
ɵ
ƒ= ɵ
111
:
ɵ
ƒ≠ ɵ
11 0.025 Reject Assumption H0 PositiveHigh-Level Policy
H0
:
ɵ
ƒ= ɵ
12H1
:
ɵ
ƒ≠ ɵ
12 0.002 Reject assumption H0 PositiveCommunication HH0
:
ɵ
ƒ= ɵ
131
:
ɵ
ƒ≠ ɵ
13 0.020 Reject assumption H0 PositiveCooperation Quality HH0
:
ɵ
ƒ= ɵ
14Table 7. Correlation Between Rank Efficiency Z-Number DEA and FDEA
DMU No.
Rank FDEA (α=0.99)
Rank Z-DEA (α = 0.05)
DMU No.
Rank FDEA (α = 0.99)
Rank Z-DEA (α = 0.05)
DMU No.
Rank FDEA (
α
=0.99)Rank Z-DEA (
α
=0.05)1 33 36 26 66 66 51 7 10
2 62 63 27 41 35 52 43 37
3 50 51 28 67 68 53 1 1
4 10 15 29 59 57 54 31 39
5 47 49 30 18 17 55 3 4
6 73 73 31 64 64 56 60 60
7 29 28 32 48 46 57 9 8
8 69 69 33 8 14 58 26 7
9 57 58 34 45 43 59 16 20
10 13 11 35 22 23 60 58 59
11 56 55 36 30 38 61 5 3
12 12 9 37 14 16 62 2 2
13 71 71 38 21 22 63 44 42
14 35 29 39 4 5 64 63 61
15 19 19 40 40 44 65 11 13
16 38 34 41 17 21 66 72 72
17 70 70 42 68 67 67 28 24
18 51 50 43 52 54 68 15 12
19 32 31 44 55 56 69 23 18
20 65 65 45 39 41 70 54 52
21 27 32 46 36 33 71 24 26
22 61 62 47 53 53 72 20 25
23 46 48 48 42 47 73 49 45
24 34 27 49 25 30
Spearman Correlation=0.983
25 37 40 50 6 6
Table 8. Comparison Results Between Z-Number DEA and FDEA
DMU No.
Efficiency
FDEA (α =0.99)
Efficiency
Z-number DEA
(α =0.05) DMU No.
Efficiency
FDEA (α =0.99)
Efficiency
Z-number DEA
(α =0.05) DMU No.
Efficiency
FDEA (α =0.99)
Efficiency
Z-number DEA (α =0.05)
1 1.002 1.013 26 0.962 0.972 51 1.003 1.019
2 0.982 0.987 27 1.002 1.013 52 1.002 1.013
3 1.002 1.009 28 0.957 0.965 53 1.005 1.029
4 1.003 1.018 29 0.989 1.001 54 1.002 1.013
5 1.002 1.010 30 1.003 1.016 55 1.004 1.021
6 0.853 0.865 31 0.974 0.981 56 0.986 0.996
7 1.002 1.014 32 1.002 1.011 57 1.003 1.019
8 0.954 0.962 33 1.003 1.018 58 1.002 1.020
9 0.990 0.998 34 1.002 1.011 59 1.003 1.015
10 1.003 1.018 35 1.003 1.015 60 0.990 0.998
11 0.996 1.004 36 1.002 1.013 61 1.004 1.022
12 1.003 1.019 37 1.003 1.016 62 1.005 1.024
13 0.917 0.926 38 1.003 1.015 63 1.002 1.011
14 1.002 1.014 39 1.004 1.021 64 0.981 0.991
15 1.003 1.016 40 1.002 1.011 65 1.003 1.018
16 1.002 1.013 41 1.003 1.015 66 0.905 0.918
17 0.935 0.950 42 0.954 0.969 67 1.002 1.015
18 1.002 1.010 43 1.001 1.006 68 1.003 1.018
19 1.002 1.014 44 0.997 1.003 69 1.003 1.016
20 0.965 0.975 45 1.002 1.013 70 0.999 1.007
21 1.002 1.014 46 1.002 1.014 71 1.003 1.014
22 0.983 0.991 47 1.000 1.007 72 1.003 1.015
23 1.002 1.010 48 1.002 1.011 73 1.002 1.011
24 1.002 1.014 49 1.002 1.014
-Average
-0.992
-1.003
Validation and Verification
For validation and verification of the results, using the Spearman rank-order correlation test in Minitab, the correlation between rank orders obtained from Z-number DEA and FDEA are compared. The correlation coefficient of 0.983 verifies the reasonable reliability of the Z-number
DEA method. Table 7 reports the non-parametric
Spearman test of relationships between the ranking of
FDEA model and Z-number DEA.44
Comparing Z-number DEA and FDEA
The average efficiency calculated in Z-number DEA method by considering the optimal alpha equal to 0.05 and the average efficiency calculated in FDEA method by considering the optimal alpha of 0.99 are compared. The average efficiency of Z-number DEA model is 1.003 and the average efficiency of FDEA is 0.992. Since the average efficiency of Z-number DEA is higher, then Z-number DEA is remarked as a better method (Table 8).
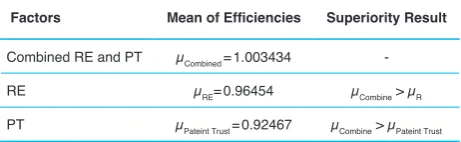
In order to indicate the superiority of the proposed algorithm considering RE and patients trust concepts together, the efficiency scores of RE and PT factors are calculated separately, and the results are compared to the combined conceptual model of the presented study. The results are presented in Table 9.
Conclusions
ED as one of the most important and risky departments of hospitals is a bottleneck of confronting with a large number of entrants in unusual times and undertakes not only to look after the critical ills and injured of accidents or disasters but to manage the medical emergencies. One of the concerns of medical service providers nowadays is to build an efficient ED capable of providing services to a large number of patients. Therefore, to evaluate the performance of the ED, both concepts of PT and RE which are applicable to enhance the preventive safety and promote the performance, are simultaneously considered for the first time in this study. In addition, due to the uncertain nature of the data in the real world, decision making is done under uncertainty. In this regard, the Z-number DEA model has been used to evaluate the system efficiency as a powerful, efficient and new tool
in uncertainty. Managers are suggested to consider the obtained results in improvement planning of the safety and patients’ trust to improve the overall efficiency.
Authors’ Contributions
MT gathered the required data and other authors contributed to data analysis, drafting the manuscript and finalizing it. All authors read and approved the final manuscript.
Competing Interests
The authors declare no competing interests.
Acknowledgements
The authors are grateful for the valuable comments and suggestions from the respected reviewers. They have enhanced the strength and significance of our paper. This study was supported by a grant from the University of Tehran (grant No. 8106013/1/20). The authors are grateful for the support provided by the College of Engineering, University of Tehran, Iran.
It is with deep sadness that we announce the loss of our dear colleague, Professor Ali Azadeh. Ali Azadeh was an eminent university professor and founder of Department of Industrial Engineering and co-founder of Research Institute of Energy Management and Planning at the University of Tehran. He was a kind teacher and a caring father. Our hearts go out to his family. May God bless his soul and give courage to the family to bear this loss.
References
1. Ugwa EA, Muhammad LM, Ugwa CC. Job satisfaction among nurses and doctors in a tertiary Hospital in North-Western Nigeria: a cross-sectional study. Int J Hosp Res. 2014;3(1):11-18.
2. Arabloo J, Rezapour A, Ebadi Fard Azar F, Mobasheri Y. Measuring patient safety culture in Iran using the Hospital survey on patient safety culture (HSOPS): an exploration of survey reliability and validity. Int J Hosp Res. 2012;1(1):15-28.
3. Campbell SM, Roland MO, Buetow SA. Defining quality of care. Soc Sci Med. 2000;51(11):1611-1625. doi:10.1016/s0277-9536(00)00057-5
4. Gholizade L, Masoudi I, Maleki MR, Aeenparast A, Barzegar M. The Relationship between Job Satisfaction, Job Motivation, and Organizational Commitment in the Healthcare Workers: a Structural Equation Modeling Study. Int J Hosp Res. 2014;3(3):139-144.
5. Wreathall J. Properties of resilient organizations: an initial view. In: Hollnagel E, Woods DD, Leveson N,
Table 9. The superiority of the proposed integrated model versus separate
concepts
Factors Mean of Efficiencies Superiority Result
Combined RE and PT µCombined = 1.003434
-RE µRE= 0.96454 µCombine > µR
eds. Resilience Engineering: Concepts and Precepts. Aldershot, UK: Ashgate Publishing Ltd; 2006. p. 275-286.
6. Hollnagel E, Woods DD, Leveson N. Resilience Engineering: Concepts and Precepts. Aldershot, UK: Ashgate Publishing Ltd; 2007.
7. Azadeh A, Foroozan H, Ashjari B, et al. Performance assessment and optimisation of a large information system by combined customer relationship management and resilience engineering: a mathematical programming approach. Enterp Inf Syst. 2017;11(9):1401-1415. doi:10.1080/17517575. 2016.1251618
8. Paton D, Johnston D. Disasters and communities: vulnerability, resilience and preparedness. Disaster Prev Manag. 2001;10(4):270-277. doi:10.1108/ EUM0000000005930
9. Clegg CW. Sociotechnical principles for system design. Appl Ergon. 2000;31(5):463-477. doi:10.1016/ s0003-6870(00)00009-0
10. Azadeh A, Salehi V, Ashjari B, Saberi M. Performance evaluation of integrated resilience engineering factors by data envelopment analysis: The case of a petrochemical plant. Process Saf Environ Prot. 2014;92(3):231-241. doi:10.1016/j.psep.2013.03.002 11. Burtscher MJ, Manser T. Team mental models and
their potential to improve teamwork and safety: A review and implications for future research in healthcare. Saf Sci. 2012;50(5):1344-1354. doi:10.1016/j.ssci.2011.12.033
12. Clarke DM. Human redundancy in complex, hazardous systems: A theoretical framework. Saf Sci. 2005;43(9):655-677. doi:10.1016/j.ssci.2005.05.003 13. Domínguez-García AD, Kassakian JG, Schindall JE,
Zinchuk JJ. An integrated methodology for the dynamic performance and reliability evaluation of fault-tolerant systems. Reliab Eng Syst Safe. 2008;93(11):1628-1649. doi:10.1016/j.ress.2008.01.007
14. Fan LL, Song YD. On fault-tolerant control of dynamic systems with actuator failures and external disturbances. Acta Automatica Sinica. 2010;36(11):1620-1625. doi:10.1016/ S18741029(09)60066-5
15. Scott T. Healthcare performance and organisational culture. Radcliffe Publishing; 2003.
16. Ess SM, Schneeweiss S, Szucs TD. European healthcare policies for controlling drug expenditure.
Pharmacoeconomics. 2003;21(2):89-103. doi:10.2165/00019053-200321020-00002
17. Gruber J. The effect of competitive pressure on charity: hospital responses to price shopping in
California. J Health Econ. 1994;13(2):183-212. 18. Gonçalves AC, Noronha CP, Lins MP, Almeida RM.
Data envelopment analysis for evaluating public hospitals in Brazilian state capitals. Rev Saude Publica. 2007;41(3):427-435. doi:10.1590/S0034-89102006005000023
19. Nayar P, Ozcan YA. Data envelopment analysis comparison of hospital efficiency and quality. J Med Syst. 2008;32(3):193-199. doi:10.1007/s10916-007-9122-8
20. Cimellaro GP, Reinhorn AM, Bruneau M. Performance-based metamodel for healthcare facilities. Earthq Eng Struct Dyn. 2011;40(11):1197-1217. doi:10.1002/ eqe.1084
21. Jeffcott SA, Ibrahim JE, Cameron PA. Resilience in healthcare and clinical handover. Qual Saf Health Care. 2009;18(4):256-260. doi:10.1136/ qshc.2008.030163
22. Costella MF, Saurin TA, de Macedo Guimarães LB. A method for assessing health and safety management systems from the resilience engineering perspective. Saf Sci. 2009;47(8):1056-1067. doi:10.1016/j. ssci.2008.11.006
23. Fairbanks RJ, Wears RL, Woods DD, Hollnagel E, Plsek P, Cook RI. Resilience and resilience engineering in health care. Jt Comm J Qual Patient Saf. 2014;40(8):376-383.
24. Anderson JE, Ross A, Jaye P. Resilience engineering in healthcare: moving from epistemology to theory and practice. Proceedings of the fifth resilience engineering symposium; Soesterberg; 2013.
25. Anderson JE, Ross AJ, Back J, et al. Implementing resilience engineering for healthcare quality improvement using the CARE model: a feasibility study protocol. Pilot Feasibility Stud. 2016;2(1):61. doi:10.1186/s40814-016-0103-x
26. Zali M. The new principle of doctor-patient relationship. Tehran, Iran: Hoghooghi Publication; 1998. [Persian]. 27. Ghadiri Lashkajani Zolfaghari M. Patientphysician
relationship. Tehran: Iran University of Medical Sciences; 2000. [Persian].
28. Rajabi M, Salehi Nejad S, Aghoush L, Mijani M. Perceived Organizational Justice as a Predictor of Organizational Trust in Medical Education Organizations. Int J Hosp Res. 2015;4(4):161-166. 29. Soltani Arabshahi SK, Ajami A, Siabani S.
[Persian].
30. Dana Siyadat Z. The effect of teaching communication skills on the clinical skills of infectious disease residents of the school of medicine. Isfahan University of Medical Sciences; 2005. [Persian].
31. Flocke SA, Miller WL, Crabtree BF. Relationships between physician practice style, patient satisfaction, and attributes of primary care. J Fam Pract. 2002;51(10):835-840.
32. Schutz AL, Counte MA, Meurer S. Development of a patient safety culture measurement tool for ambulatory health care settings: analysis of content validity. Health Care Manag Sci. 2007;10(2):139-149. 33. Carlucci D, Renna P, Schiuma G. Evaluating
service quality dimensions as antecedents to outpatient satisfaction using back propagation neural network. Health Care Manag Sci. 2013;16(1):37-44. doi:10.1007/s10729-012-9211-1
34. Yaghoubi M, Rahmati-Najarkolaei F. Patient-physician communicative patterns, Patient-physicians’ job satisfaction, and patients’ satisfaction: the case of a hospital in Isfahan. Iranian Journal of Health Sciences. 2014;2(2):37-44. doi:10.18869/acadpub.jhs.2.2.37 35. Vredenburg J, Bell SJ. Variability in health care services:
the role of service employee flexibility. Australasian Marketing Journal (AMJ). 2014;22(3):168-178. doi:10.1016/j.ausmj.2014.08.001
36. Jalilibal Z, Kianpour M, Jolai F. Assessing the Public and Private Hospital Performance Based on Considering Resilience Engineering Indices: An Integrated Simulation and Decision Making Approach. Journal of Hospital. 2015;14(4):9-20. [Persian].
37. Kim DH. Emergency Preparedness and the Development of Health Care Coalitions: A Dynamic Process. Nurs Clin North Am. 2016;51(4):545-554. doi:10.1016/j.cnur.2016.07.013
38. Azadian S, Shirali GA, Saki A. Reliability and validity of assessment of crisis management questionnaire based on seven principles of resilience engineering approach in hospitals. Iran Occupational Health Journal. 2016;13(1):15-26. [Persian].
39. Shirali GA, Azadian S, Saki A. A new framework for assessing hospital crisis management based on resilience engineering approach. Work. 2016;54(2):435-444. doi:10.3233/wor-162329
40. Misfeldt R, Suter E, Oelke N, Hepp S, Lait J. Creating high performing primary health care teams in Alberta, Canada: Mapping out the key issues using a socioecological model. J Interprof Educ Pract. 2017;6:27-32. doi:10.1016/j.xjep.2016.11.004
41. Zadeh LA. A note on Z-numbers. Inf Sci.
2011;181(14):2923-2932. doi:10.1016/j. ins.2011.02.022
42. Azadeh A, Kokabi R. Z-number DEA: A new possibilistic DEA in the context of Z-numbers. Adv Eng Inform. 2016;30(3):604-617. doi:10.1016/j. aei.2016.07.005
43. Azadeh A, Yazdanparast R, Zadeh SA, Zadeh AE. Performance optimization of integrated resilience engineering and lean production principles. Expert Syst Appl. 2017;84:155-170. doi:10.1016/j. eswa.2017.05.012