Removal of bromide from aqueous solutions using the UV/ZnO
process based on the multivariate analysis model
Kolsoom Mohammad Moradi1, Kavous Dindarloo2*, Vali Alipour3, Mohsen Heidari3
1Msc Student of Science Environment Health Engineering, School of Public Health, Hormozgan University of Medical Sciences,
Bandar Abbas, Iran
2Associate Professor, Environment Health Engineering Department, School of Public Health, Hormozgan University of Medical
Sciences, Bandar Abbas, Iran
3Assistant Professor, Environment Health Engineering Department, School of Publish Health, Hormozgan University of Medical
Sciences, Bandar Abbas, Iran
Abstract
Background: Bromide is found naturally in groundwater and surface water. The rapid growth of industrial activities, drainage of surface runoff, and use of methyl bromide in pesticides has increased bromide discharge to the environment. Disinfection of water-containing bromide causes the creation of additional products of organo-halogenated that are considered cancer-causing agents. In this study, the effect and optimization of factors in removal of this ion was evaluated by using the nano-photocatalytic UV/ZnO process.
Methods: This analytical study was conducted in a batch system by the phenol-red method. The test design was performed through the analysis model of multi-factor variance with 99 subjects, while the main, interactive, and reciprocal effects of variables, such as reaction time, catalyst concentration, bromide concentration, and pH at different levels of each factor, were analysed by using SPSS version 16.
Results: The main, interactive, and reciprocal effects of factors were significant in three different levels with
P < 0.001, and the optimal level of the factors reaction time, catalyst concentration, bromide concentration, and pH were 120 minutes, 0.5, 0.1, and 7 mg/L, respectively, by using the Schaffer test. The highest removal efficiency of 95% was obtained at least 91.56 and a maximum of 94.76% was obtained under optimal conditions of all factors.
Conclusion: The results show that by optimization of factors, this process can be effectively used to remove bromide from aquatic environments.
Keywords: Bromides, Water, Reaction Time, UV/Zn
Citation:Moradi KM, Dindarloo K, Alipour V, Heidari M. Removal of bromide from aqueous solutions using the UV/ZnO process based on the multivariate analysis model. Environmental Health Engineering and Management Journal2017; 4(1): 15–19. doi: 10.15171/EHEM.2017.03.
*Correspondence to:
Kavous Dindarloo
Email: [email protected]
Article History:
Received: 26 September 2016 Accepted: 30 October 2016 ePublished: 15 November 2016
Environmental Health Engineering and Management Journal 2017, 4(1), 15–19
Introduction
The use of disinfectants to kill pathogens in water and other compounds are known, but the result of disinfection in case of some compounds, such as bromide production of disinfection by-products (DBPs) like bromate, are carcinogenic (1). The maximum contaminant level (MCL) of bromate is suggested to be 0.010 mg/L by the United States Environmental Protection Agency (USEPA) (2,3). The value observed in America is from 5 to 429 μg/L, and the amount of bromide in fresh water is 0.1 to 0.5 and 65 to 85 mg/L in seawater (4-6). Disinfectants such as chlorine and ozone are used to eliminate pathogenic factors and other undesirable compounds in water. If there are some elements, such as bromide, in the water, by-products like bromate and dangerous organo-halogenated compounds like haloacetic acids (HAAs) would be formed, which are considered as
cancer-causing agents (7,8). Bromide in drinking water is the most important mineral that is essential to be removed from water resources (9). The USEPA has reported the maximum allowable concentration of tri-halomethanes (THMs) and HAAs under disinfection as 80 and 60 μg/L, respectively (10). One of the removal methods is the use of bromate precursors such as bromide and natural organic matter before the ozonation process (11). Electrochemical methods (12), nanofiltration (13), advanced coagulation (10), and activated carbon (14) are including removal methods that have restrictions such as generating carcinogenic by-products, being uneconomic, bromide in drinking water, producing great volume of sludge, limited absorption capacity, lack of complete removal of bromide in the water, and so on. Advanced optical oxidation technology has had considerable progress over the last decade and has obtained great importance in the
Environmental Health Engineering and Management Journal
HE M J
© 2017 The Author(s). Published by Kerman University of Medical Sciences. This is an open-access article distributed under the terms of the Creative Commons Attribution License (http://creativecommons.org/licenses/by/4.0), which permits unrestricted use, distribution, and reproduction in any medium, provided the original work is properly cited.
10.15171/EHEM.2017.03 doi
Original Article
Open Access Publish Free
Moradi et al
Environmental Health Engineering and Management Journal 2017, 4(1), 15–19 16
field of purification of industrial wastewater; in particular, wastewater contains resistant organic materials whose common purification methods are not able to remove these compounds. The advantages of these technologies are that they break down most organic compounds into minerals such as water, carbon dioxide, and mineral acids, lack of the problem of residual wastes; they are performed in an ambient temperature and atmospheric pressure. Advanced oxidation processes are generally including all the processes through which hydroxyl active radicals (OH) are produced in different ways. Due to high oxidation of hydroxyl radicals (2.78), advanced oxidation processes are often based on this active radical. The use of ultraviolet radiation, ultrasonic waves, ozone, among others, are among these processes. The use of UV rays and a suitable oxidizing agent, such as H2O2 and ZnO, is one of the most effective methods of advanced oxidation (15). Among methods of advanced oxidation, photo-catalytic processes have had a high potential to remove contaminants from water and wastewater. Many catalysts have been used in previous years. Meanwhile, having an appropriate band gap energy, high quantum efficiency, and high chemical stability, ZnO seems to provide utilization of photocatalytic processes (16). An important advantage of ZnO is its availability at a low cost. Moreover, this catalyst absorbs more solar spectrum than that of TiO2 (17,18).
In this study, considering the harms and losses caused by bromide in drinking water that underlies the creation of disinfection by-products and production of bromine, removal of bromide was using the process UV/ZnO in aqueous solutions. Effects of factors like reaction time, concentration of bromide, catalyst concentration, and pH were evaluated.
Methods and Materials
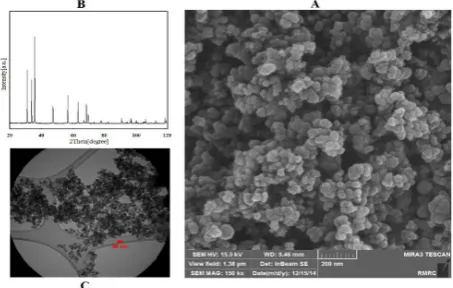
This study is applied research, which was carried out in a batch system with a height of 10 cm, width of 5 cm, and length of 30 cm with the capacity of one litre. There were 4 lamps (8 W, UV-C-254 nm) above the reactor (low pressure of mercury vapor) that are electrically connected to each other. This reactor was in the box that made of quartz. In this study, the colorimetric method of phenol-red was used in order to measure bromide by the spectrophotometer of model DR-2000 at a wavelength of 590 nm. Also, pH testing was performed by the Electron pH meter model CP-501 with the accuracy range (0.01) and according to standard method references (19). All of the chemical material were made in Merck Company (Germany) and ZnO nanoparticle were made in the United States. 0.2 N HCl was used in order to adjust the pH. The bromide stock solution was prepared by dissolving 0.148 g of potassium bromide salt in 100 mL of double-distilled water. In this study, the scanning electron microscope, the X-ray powder diffraction, and the transmission electron microscope were used to determine the characteristics of nanoparticles including the structure of morphology, particle size, parameters, and the stability of nanoparticles
in aqueous environments. Figure 1A shows that nanoparticles are dispersed without agglomeration and appropriate size within the nanometre range.
Diffraction reflected from nanoparticles within the 2θ
range of 10°–80° were collected and analysed. The results
of X-ray diffraction correspond to the standard data card JCPDS No.36-1451, which belongs to the net zinc oxide nanoparticles with the hexahedron structure (Figure 1B). Scherrer equation was used to calculate the average size of the nanoparticles (20). The results of equation 1 showed that the size of the synthesized nanoparticles is about 50 nm. The Scherrer equation in this respect is:
0.09 cos
scherrer
D
B λ
θ
= (1)
where D is crystal size in nanometre, λ is the powder wavelength of X-ray, which is 1.54056 nm. B is the width of the highest peak at half the height in radians, and θ is the diffraction angle of the highest peak in degrees (21). The transmission electron microscope is used to show the actual size and morphology of the nanoparticles, as shown in Figure 1C. The actual size of the estimated nanoparticles was 54 nm and the resulting image showed that zinc oxide is composed of dense particles with regular morphology. The energy-dispersive spectroscopy (EDS) results of ZnO nanoparticles are shown in Table 1; the percentages are related to the impurity of the element in the nanoparticles and purity percentage.
The statistical design of the experiment was evaluated in the analysis model of multi-factor variance and by determining the main effect of reaction time on 6 levels with 3 repetitions, the main effects, dual effects, and multi-factor effects of bromide concentration factors (0.1, 0.2 and 0.4 mg/L), nanoparticle concentrations (0.2, 0.5 and 0.7 g/L), and pH (5,7 and 9) in 3 levels and three repetitions through the following equation (Eq. 2) with 99 samples needed and using SPSS version 16.
After conducting experiments and entering removal results into the software in the form of removal efficiency, the best model of variance analysis to fit the information
Figure 1. (A) Scanning electron microscope image (SEM)
Environmental Health Engineering and Management Journal 2017, 4(1), 15–19 17 Moradi et al
through changing effective parameters, equation 2 was obtained.
Removal Br = 186871.762 + 18188.452(Br) + 3948.860(ZnO)
+ 10253.973(pH) + 958.137(pH*ZnO)+ 2505.709(ZnO*Br)
+ 753.778(pH*Br) + 631.136(pH*ZnO*Br) + 130.76 (Eq. 2)
The removal percentage of bromide was calculated according to equation 3 through the difference between the initial and final concentrations:
0
0
Removal percentage bromide 100 C Ce
C −
= × (3)
Results
Reaction time effect
The results of the statistical analysis for the main effect of reaction time on 6 different levels, with 3 repetitions at each level, showed that reaction time is an effective
factor on bromide removal in this process (P = 0.001).
Table 2 shows the minimum and maximum percentage of bromide removal efficiency in each of the different levels of reaction time factor in pH = 7, catalyst concentration of 0.5 g/L and bromide concentration of 0.2 mg/L, with ensure percentage of 95%.
The main study of effects
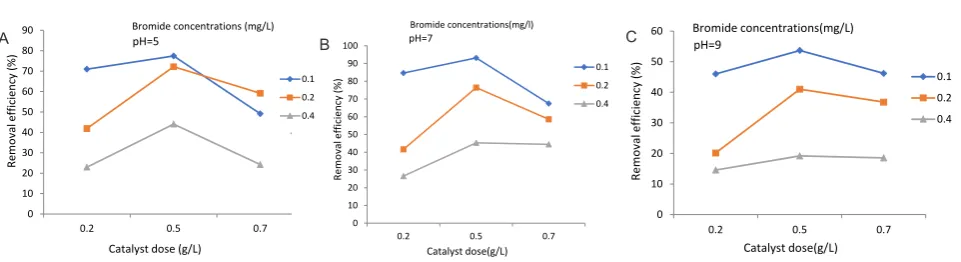
The main study of the effects of bromide concentrations, catalyst concentration, and pH on the removal process of nanophoto catalytic bromide is shown in Figure 2. As shown, the highest removal efficiency for bromide concentration, catalyst concentration, and pH are obtained in the amount of 0.1 mg/L, 0.5 g/L and 7, respectively.
Examining the interaction between factors
According to Figure 2A, it can be found that the removal efficiency increases by increasing the catalyst dose from 0.2 to 0.5 g/L. In addition, the removal efficiency has not increased so much or it has decreased by increasing the dose of the catalyst from 0.5 to 0.7 g/L. Besides, the highest percentage of removal in the initial concentration
of bromide equals 0.1 mg/L Figure 2B. The removal efficiency generally falls down by increasing the initial concentration of bromide. As shown in Figure 2C, pH = 7
Triplex review of factors in the process
As shown in Figure 3, the highest removal percentage of catalyst dose is 0.5 g/L for neutral pH and the bromide concentration of 0.1 mg/L is 93.09%.
Discussion
The effect of radiation time
Results of statistical analysis showed that the reaction time of a factor is effective in the removal of bromide with UV/
ZnO (P = 0.001). According to the results of Table 2, it
is seen that the amount of bromide removal increases by increasing the reaction time so that during 120 minutes of reaction time with ensure coefficient of 95%, minimum removal is 71.15 and its maximum is 75.62%, and this level has a significant difference with the low level. It seems that by increasing reaction time, UV radiation exposure to the free ZnO level causes the production of
the radical OH° level and thus the removal rate increases.
The present study is consistent with the study by Asadi et al in this regard. Their study on the removal of chromium (VI) by the UV/ZnO process concluded that the removal of chromium (VI) increases with an increase in retention time due to an increase in more electrons (9).
Environmental Health Engineering and Management Journal 2016, 3(x), x–x 3
Moradi et al
Removal Br = 186871.762 + 18188.452(Br) + 3948.860(ZnO) + 10253.973(pH) + 958.137(pH*ZnO)+ 2505.709(ZnO*Br) + 753.778(pH*Br) + 631.136(pH*ZnO*Br) + 130.76 (Eq. 2)
The removal percentage of bromide was calculated according to equation 3 through the difference between the initial and final concentrations:
0 e
0
C C Removal percentage bromide 100
C −
= × (3)
Results
Reaction time effect
The results of the statistical analysis for the main effect of reaction time on 6 different levels, with 3 repetitions at each level, showed that reaction time is an effective
factor on bromide removal in this process (P = 0.001).
Table 2 shows the minimum and maximum percentage of bromide removal efficiency in each of the different levels of reaction time factor in pH = 7, catalyst concentration of 0.5 g/L and bromide concentration of 0.2 mg/L, with ensure percentage of 95%.
The main study of effects
The main study of the effects of bromide concentrations, catalyst concentration, and pH on the removal process of nanophoto catalytic bromide is shown in Figure 2. As shown, the highest removal efficiency for bromide concentration, catalyst concentration, and pH are obtained in the amount of 0.1 mg/L, 0.5 g/L and 7, respectively.
Examining the interaction between factors
According to Figure 2A, it can be found that the removal efficiency increases by increasing the catalyst dose from 0.2 to 0.5 g/L. In addition, the removal efficiency has not increased so much or it has decreased by increasing the dose of the catalyst from 0.5 to 0.7 g/L. Besides, the highest percentage of removal in the initial concentration of bromide equals 0.1 mg/L Figure 2B. The removal efficiency generally falls down by increasing the initial concentration of bromide. As shown in Figure 2C, pH = 7
is the best pH in this process.
Triplex review of factors in the process
As shown in Figure 3, the highest removal percentage of catalyst dose is 0.5 g/L for neutral pH and the bromide concentration of 0.1 mg/L is 93.09%.
Discussion
The effect of radiation time
Results of statistical analysis showed that the reaction time of a factor is effective in the removal of bromide with UV/ ZnO (P = 0.001). According to the results of Table 2, it is seen that the amount of bromide removal increases by increasing the reaction time so that during 120 minutes of reaction time with ensure coefficient of 95%, minimum removal is 70.15 and its maximum is 75.62%, and this level has a significant difference with the low level. It seems that by increasing reaction time, UV radiation exposure to the free ZnO level causes the production of the radical OH° level and thus the removal rate increases. The present study is consistent with the study by Asadi et al in this regard. Their study on the removal of chromium (VI) by the UV/ZnO process concluded that the removal of chromium (VI) increases with an increase in retention time due to an increase in more electrons (9).
As observed Figure 2C, the best efficiency of bromide removal is at neutral pH or equal to 7 (approximately 94.16%). Other studies have also shown that the ZnO nano-catalyst has been more effective at a neutral pH.
Table 1. EDS analysis of ZnO nanoparticles
Purity (%) Al Fe Ca Mg Mn Na Co Ni K N C S
Element 0.001 0.001 0.001 0.001 0.001 0.001 0.001 0.001 0.001 0.001 0.001 0.003
Table 2. Minimum and maximum removal of bromide in different levels of time factor
Reaction time (min) P value Removal efficiency (%)Min Max
15 0.001 24.6 35.49
30 0.001 36.31 45.12
45 0.001 34.29 46.27
60 0.001 39.23 46.88
75 0.001 44.37 55.34
120 0.001 71.15 75.62
0 10 20 30 40 50 60 70 80
5 7 9
0.2 0.5 0.7 Rem ov al effi ci en cy (% ) Catalyst dose(g/L) pH 0 10 20 30 40 50 60 70 80
0.2 0.5 0.7
0.1 0.2 0.4 Catalyst dose(g/L) Remo va l effi ci en cy (% ) Bromide concentrations(mg/l) 0 10 20 30 40 50 60 70 80 90
5 7 9
0.1 0.2 0.4 pH Re m ov al e ffi ci ency (% ) Bromide concentrations(mg/L)
A B C
Figure 2.(A) Interaction effect between catalyst dose and pH; (B) interaction effect between bromide concentrations and catalyst dose; (C) interaction effect between bromide concentration and pH.
Environmental Health Engineering and Management Journal 2016, 3(x), x–x 3
Moradi et al
Removal Br = 186871.762 + 18188.452(Br) + 3948.860(ZnO) + 10253.973(pH) + 958.137(pH*ZnO)+ 2505.709(ZnO*Br) + 753.778(pH*Br) + 631.136(pH*ZnO*Br) + 130.76 (Eq. 2)
The removal percentage of bromide was calculated according to equation 3 through the difference between the initial and final concentrations:
0 e
0
C C Removal percentage bromide 100
C −
= × (3)
Results
Reaction time effect
The results of the statistical analysis for the main effect of reaction time on 6 different levels, with 3 repetitions at each level, showed that reaction time is an effective
factor on bromide removal in this process (P = 0.001).
Table 2 shows the minimum and maximum percentage of bromide removal efficiency in each of the different levels of reaction time factor in pH = 7, catalyst concentration of 0.5 g/L and bromide concentration of 0.2 mg/L, with ensure percentage of 95%.
The main study of effects
The main study of the effects of bromide concentrations, catalyst concentration, and pH on the removal process of nanophoto catalytic bromide is shown in Figure 2. As shown, the highest removal efficiency for bromide concentration, catalyst concentration, and pH are obtained in the amount of 0.1 mg/L, 0.5 g/L and 7, respectively.
Examining the interaction between factors
According to Figure 2A, it can be found that the removal efficiency increases by increasing the catalyst dose from 0.2 to 0.5 g/L. In addition, the removal efficiency has not increased so much or it has decreased by increasing the dose of the catalyst from 0.5 to 0.7 g/L. Besides, the highest percentage of removal in the initial concentration of bromide equals 0.1 mg/L Figure 2B. The removal efficiency generally falls down by increasing the initial concentration of bromide. As shown in Figure 2C, pH = 7
is the best pH in this process.
Triplex review of factors in the process
As shown in Figure 3, the highest removal percentage of catalyst dose is 0.5 g/L for neutral pH and the bromide concentration of 0.1 mg/L is 93.09%.
Discussion
The effect of radiation time
Results of statistical analysis showed that the reaction time of a factor is effective in the removal of bromide with UV/ ZnO (P = 0.001). According to the results of Table 2, it is seen that the amount of bromide removal increases by increasing the reaction time so that during 120 minutes of reaction time with ensure coefficient of 95%, minimum removal is 70.15 and its maximum is 75.62%, and this level has a significant difference with the low level. It seems that by increasing reaction time, UV radiation exposure to the free ZnO level causes the production of the radical OH° level and thus the removal rate increases. The present study is consistent with the study by Asadi et al in this regard. Their study on the removal of chromium (VI) by the UV/ZnO process concluded that the removal of chromium (VI) increases with an increase in retention time due to an increase in more electrons (9).
As observed Figure 2C, the best efficiency of bromide removal is at neutral pH or equal to 7 (approximately 94.16%). Other studies have also shown that the ZnO nano-catalyst has been more effective at a neutral pH.
Table 1. EDS analysis of ZnO nanoparticles
Purity (%) Al Fe Ca Mg Mn Na Co Ni K N C S
Element 0.001 0.001 0.001 0.001 0.001 0.001 0.001 0.001 0.001 0.001 0.001 0.003
Table 2. Minimum and maximum removal of bromide in different levels of time factor
Reaction time (min) P value Removal efficiency (%)Min Max
15 0.001 24.6 35.49
30 0.001 36.31 45.12
45 0.001 34.29 46.27
60 0.001 39.23 46.88
75 0.001 44.37 55.34
120 0.001 71.15 75.62
0 10 20 30 40 50 60 70 80
5 7 9
0.2 0.5 0.7 Rem ov al effi ci en cy (% ) Catalyst dose(g/L) pH 0 10 20 30 40 50 60 70 80
0.2 0.5 0.7
0.1 0.2 0.4 Catalyst dose(g/L) Remo va l effi ci en cy (% ) Bromide concentrations(mg/l) 0 10 20 30 40 50 60 70 80 90
5 7 9
0.1 0.2 0.4 pH Re m ov al e ffi ci ency (% ) Bromide concentrations(mg/L)
A B C
Moradi et al
Environmental Health Engineering and Management Journal 2017, 4(1), 15–19 18
As observed Figure 2C, the best efficiency of bromide removal is at neutral pH or equal to 7 (approximately 94.16%). Other studies have also shown that the ZnO nano-catalyst has been more effective at a neutral pH. This study is consistent with the study of Motlagh et al in this regard. In their study on colour removal of methylene blue by using the UV/ZnO process, they concluded that the proper pH is 7 (22). The removal efficiency decreases by the process of increasing the pH from 7 to 9. It seems that very high and low pHs are harmful for the catalysts, and the ZnO is dissolved in these pHs. On the other hand, more negative charges of bromide species are created by increasing the bromide concentration and because ZnO nanoparticles have more positive charges at a low pH, and closer to neutral, they remove the negatively charged bromide species with high efficiency. These results are consistent with the findings of Young et al (23).
The ZnO catalyst dose affect the removal efficiency
As can be observed in the charts above, bromide removal increases (up to 93.16%) by increasing the catalyst dose (from 0.2 to 0.5 g/L). Reason of this problem could be that the number of active sites on the catalyst increases by increasing the amount of catalyst in a solution with a fixed substrate amount, which attracts more UV radiation and increases the reaction speed, thereby increasing the removal efficiency.
A similar phenomenon has been reported by Chakrabarti et al (24) and Das et al (25). By increasing the catalyst dose (from 0.5 to 0.7 g/L), the efficiency did not increase so much or decreases; this can be due to opacity increases in high concentrations of nanoparticles and reduce the effect of UV light on the nanoparticles.
According to the results in Figure 2B, removal efficiency decreases with increasing concentrations of bromide. This increase appears to be due to the trapping of substrate UV. It also seems that the number of sites of act to remove is reduced by increasing bromide concentration. In a study by Shayesteh et al, they concluded that the removal efficiency increases with increasing concentrations of bromide and this difference in results of the study could be due to the bromide removal procedure in reference research. In another study by Azizi et al, entitled ‘Remove the bromide from water resources using pillars of GAC and resin’, they concluded that the performance of GAC within the TDS
range of less than 1000 mg/L and the bromide less than 5 mg/L is better than weak anionic resin (26,27).
Conclusion
In general, it could be concluded that the highest removal efficiency of 93.16% was at pH = 7 with initial bromide concentration of 0.1 mg/L as well as the catalyst dose of 0.5 g/L. The removal efficiency generally decreases with increases in the initial concentration of bromide. But pH and catalyst dose had ill-defined behaviour so that the highest removal efficiency was at acidic pH at high concentrations of bromide, but a better efficiency could be achieved in low concentrations in the neutral pH of 7. The optimum catalyst dose was obtained as 0.5 g per litre. In general, it can be said that the removal process optimization in the industrial scale to remove the precursor pollutants of disinfection by-products will enable researchers to carry out complete studies on the behaviour of parameters by spending the minimum cost and time.
Acknowledgments
This study is the result of a thesis entitled ‘Study of bromide removal from aqueous solutions by nano-photocatalysts UV/ZnO process’ with a multivariate analysis model in master’s degree in 2014, which was sponsored by the Hormozgan University of Medical Sciences.
Ethical issues
There were no ethical issues for writing of this article.
Competing interests
None to be declared.
Authors’ contributions
All authors were involved in all stages of the article. On behalf of the co-authors, the corresponding author bears full responsibility for this submission.
References
1. Cowman GA, Singer PC. Effect of bromide ion on haloacetic acid speciation resulting from chlorination and chloramination of aquatic humic substances. Environ Sci Technol 1995; 30(1): 16–24. doi: 10.1021/es9406905. Moradiet al
Environmental Health Engineering and Management Journal 2016, 3(x), x–x 4
This study is consistent with the study of Motlagh et al in this regard. In their study on colour removal of methylene blue by using the UV/ZnO process, they concluded that the proper pH is 7 (22). The removal efficiency decreases by the process of increasing the pH from 7 to 9. It seems that very high and low pHs are harmful for the catalysts, and the ZnO is dissolved in these pHs. On the other hand, more negative charges of bromide species are created by increasing the bromide concentration and because ZnO nanoparticles have more positive charges at a low pH, and closer to neutral, they remove the negatively charged bromide species with high efficiency. These results are consistent with the findings of Domenech et al (23).
The ZnO catalyst dose affect the removal efficiency
As can be observed in the charts above, bromide removal increases (up to 93.16%) by increasing the catalyst dose (from 0.2 to 0.5 g/L), and this increase corresponds
to the study by Golestani et al. Another reason of this
problem could be that the number of active sites on the catalyst increases by increasing the amount of catalyst in a solution with a fixed substrate amount, which attracts more UV radiation and increases the reaction speed, thereby increasing the removal efficiency.
A similar phenomenon has been reported by Chakrabarti et al (24,25). By increasing the catalyst dose (from 0.5 to 0.7 g/L), the efficiency did not increase so much or decreases; this can be due to opacity increases in high concentrations of nanoparticles and reduce the effect of UV light on the nanoparticles.
According to the results in Figure 2B, removal efficiency decreases with increasing concentrations of bromide. This increase appears to be due to the trapping of substrate UV. It also seems that the number of sites of act to remove is reduced by increasing bromide concentration. In a study by Shayesteh et al, they concluded that the removal efficiency increases with increasing concentrations of bromide and this difference in results of the study could be due to the bromide removal procedure in reference research. In another study by Azizi et al, entitled ‘Remove the bromide from water resources using pillars of GAC and resin’, they concluded that the performance of GAC within the TDS range of less than 1000 mg/L and the bromide less than 5 mg/L is better than weak anionic resin (26,27).
Conclusion
In general, it could be concluded that the highest removal efficiency of 93.16% was at pH = 7 with initial bromide concentration of 0.1 mg/L as well as the catalyst dose of 0.5 g/L. The removal efficiency generally decreases with increases in the initial concentration of bromide. But pH and catalyst dose had ill-defined behaviour so that the highest removal efficiency was at acidic pH at high concentrations of bromide, but a better efficiency could be achieved in low concentrations in the neutral pH of 7. The optimum catalyst dose was obtained as 0.5 g per litre. In general, it can be said that the removal process optimization in the industrial scale to remove the precursor pollutants of disinfection by-products will enable researchers to carry out complete studies on the behaviour of parameters by spending the minimum cost and time.
Acknowledgments
This study is the result of a thesis entitled ‘Study of bromide removal from aqueous solutions by nano-photocatalysts UV/ZnO process’ with a multivariate analysis model in master’s degree in 2014, which was sponsored by the Hormozgan University of Medical Sciences.
Ethical issues
There were no ethical issues for writing of this article.
Competing interests None to be declared.
Authors’ contributions
All authors were involved in all stages of the article. On behalf of the co-authors, the corresponding author bears full responsibility for this submission.
References
1. Cowman GA, Singer PC. Effect of bromide ion on haloacetic acid speciation resulting from chlorination and chloramination of aquatic humic substances. Environ Sci Technol 1995; 30 (1): 16–24. doi: 10.1021/es9406905. 2. Fayad NM. Seasonal variations of THMs in Saudi Arabian
drinking water. Journal - American Water Works Association 1993; 75(2): 46-50.
3. Hua G, Reckhow DA, Kim J. Effect of bromide and iodide ions on the formation and speciation of disinfection 0
10 20 30 40 50 60 70 80 90 100
0.2 0.5 0.7
0.1 0.2 0.4
Rem
ov
al
effi
ci
en
cy
(%
)
Catalyst dose(g/L) Bromide concentrations(mg/l) pH=7
0 10 20 30 40 50 60 70 80 90
0.2 0.5 0.7
#REF! #REF! #REF!
pH=5
Bromide concentrations (mg/L)
Rem
ov
al
effi
ci
en
cy
(%
)
Catalyst dose (g/L)
0 10 20 30 40 50 60 70 80 90 100
0.2 0.5 0.7
0.1 0.2 0.4
Rem
ov
al
effi
ci
en
cy
(%
)
Catalyst dose(g/L) Bromide concentrations(mg/l) pH=7
0 10 20 30 40 50 60
0.2 0.5 0.7
0.1 0.2 0.4 Bromide concentrations(mg/L)
pH=9
Catalyst dose(g/L)
Rem
ov
al
effi
ci
en
cy
(%)
A B C
Environmental Health Engineering and Management Journal 2017, 4(1), 15–19 19 Moradi et al
2. Fayad NM. Seasonal variations of THMs in Saudi Arabian drinking water. Journal - American Water Works Association 1993; 75(2): 46-50.
3. Hua G, Reckhow DA, Kim J. Effect of bromide and iodide ions on the formation and speciation of disinfection byproducts during chlorination. Environ Sci Technol 2006; 40(9): 3050-6. doi: 10.1021/es0519278.
4. Jung B, Nicola R, Batchelor B, Abdel-Wahab A. Effect of low-and medium-pressure Hg UV irradiation on bromate removal in advanced reduction process. Chemosphere 2014; 117: 663-72. doi: 10.1016/j.chemosphere.2014.09.086. 5. Ge F, Shu H, Dai Y. Removal of bromide by aluminium
chloride coagulant in the presence of humic acid. J Hazard Mater 2007; 147(1-2): 457-62. doi: 10.1016/j. jhazmat.2007.01.028.
6. Al-Mutaz IS. Water desalination in the Arabian Gulf region. In: Goosen MFA, Shayya WH, eds. Water Management, Purification and Conservation in Arid Climates: Water Purification, Volume 2. Basel: Technomic Publishing; 2000. p. 245–65.
7. Ge F, Zhu L, Chen H. Effects of pH on the chlorination process of phenols in drinking water. J Hazard Mater 2006; 133(1-3): 99-105. doi: 10.1016/j.jhazmat.2005.09.062. 8. 8. Sohn J, Amy G, Cho J, Lee Y, Yoon Y. Disinfectant decay and
disinfection by-products formation model development: chlorination and ozonation by-products. Water Res 2004; 38(10): 2461-78. doi: 10.1016/j.watres.2004.03.009. 9. Asadi A, Dehghan MH, Zare MR, Rahmani A, Golestanifar
H. Removal of chromium (VI) using UV/ZnO, UV/TiO2 and UV/ H2O2 processes from aqueous solutions. Journal of North Khorasan University of Medical Sciences 2011; 3(4): 7-13. [In Persian].
10. Ge F, Zhu L. Effects of coexisting anions on removal of bromide in drinking water by coagulation. J Hazard Mater 2008; 151(2-3): 676-81. doi: 10.1016/j.jhazmat.2007.06.041. 11. Gong CH, Zhang ZG, Qian QL, Liu D, Cheng YJ, Yuan
GQ. Removal of bromide from water by adsorption on silver-loaded porous carbon spheres to prevent bromate formation. Chem Eng J 2013; 218: 333-40. doi: 10.1016/j. cej.2012.12.059.
12. Kimbrough DE, Suffet JH. Electrochemical removal of bromide and reduction of THM formation potential in drinking water. Water Res 2002; 36(19): 4902-6. doi: 10.1016/S0043-1354(02)00210-5.
13. Listiarini K, Tor JT, Sun DD, Leckie JO. Hybrid coagulation– nanofiltration membrane for removal of bromate and humic acid in water. J Memb Sci 2010; 365(1-2): 154-9. doi: 10.1016/j.memsci.2010.08.048.
14. Wang L, Zhang J, Liu J, He H, Yang M, Yu J, et al. Removal of bromate ion using powdered activated carbon. J Environ Sci (China) 2010; 22(12): 1846-53. doi: 10.1016/S1001- 0742(09)60330-2.
15. Movahedian Attar H, Rezaee R. Investigating the Efficiency of Advanced Photochemical Oxidation (APO) Technology in Degradation of Direct Azo Dye by UV/H2O2 Process. Water and Wastewater 2006; 17(3): 75-83. [In Persian]. 16. Oppenländer T. Photochemical Purification of Water and
Air: Advanced Oxidation Processes (AOPs)-Principles, Reaction Mechanisms, Reactor Concepts. Chichester: John Wiley & Sons; 2003.
17. Zhang F, Yang J. Preparation of nano-ZnO and its application to the textile on antistatic finishing. Int J Chem 2009; 1(1): 18-22. doi: 10.5539/ijc.v1n1p18.
18. Daneshvar N, Rasoulifard MH, Khataee AR, Hosseinzadeh F. Removal of CI Acid Orange 7 from aqueous solution by UV irradiation in the presence of ZnO nanopowder. JHM 2007; 143(1-2): 95-101. doi: 10.1016/j.jhazmat.2006.08.072. 19. Andrew D, Lenore S, Eugene W, Arnold E . Standard
Method. American Public Health Association 2005;(1). 2001-3710.
20. Holzwarth U, Gibson N. The Scherrer equation versus the ‘Debye-Scherrer equation’. Nature Nanotechnol 2011; 6(9): 534-534. doi: 10.1038/nnano.2011.145
21. Zhou X, Xiang X. Effect of different plants on azo-dye wastewater bio-decolorization. Procedia Environ Sci 2013; 18: 540-6. doi: 10.1016/j.proenv.2013.04.073.
22. Nori Motlagh Z, Shams Khoram Abadi G, Godini H, Darvishi Cheshmeh Soltani R. Efficiency photocatalytic process of ZnO nanoparticles on the methylene blue dye and COD removal from wastewater. Yafteh 2013; 14(5): 51-61.
23. Ku Y, Jung IL. Photocatalytic reduction of Cr (VI) in aqueous solutions by UV irradiation with the presence of titanium dioxide. Water Res 2001; 35(1): 135-42. doi: 10.1016/S0043-1354(00)00098-1.
24. Chakrabarti S, Chaudhuri B, Bhattacharjee S, Ray AK, Dutta BK. Photo-reduction of hexavalent chromium in aqueous solution in the presence of zinc oxide as semiconductor catalyst. Ch Eng J 2009; 153(1): 86-93. doi: 10.1016/j.cej.2009.06.021.
25. Das DP, Parida K, De BR. Photocatalytic reduction of hexavalent chromium in aqueous solution over titania pillared zirconium phosphate and titanium phosphate under solar radiation. J Mol Catal A Chem 2006; 245(1): 217-24. doi: 10.1016/j.molcata.2005.10.001.
26. Azizi K, Mesdaqinia A, Vaezi F, Nasseri S. Bromide Removing from water resources using GAC column and resin. Journal of School of Public Health and Institute of Health Research 1381:28-38.