Exploring the use of the three rainfall remote sensing
products for flood prediction in the Brahmaputra basin
Maurizio Mazzoleni1, Biswa Bhattacharya1, Miguel Angel Laverde Barajas1,2,
Dimitri Solomatine1,2
1 IHE Delft Institute for Water Education, Westvest 7, 2601 DA Delft, the
Netherlands.
2 Delft University of Technology, Water Resources Section, Stevinweg 1, NL-2600
GA, Delft, the Netherlands
Corresponding author: [email protected]
Abstract. An important aspect in hydrological modelling is the accurate quantification and prediction of rainfall. In ungauged or poorly gauged basins ground data is sparse and often is complemented by rainfall satellite products, which brings additional uncertainties. The main objective of this research is to assess performance of distributed hydrological models using the remotely sensed rainfall estimates as forcings for the model. The model, based is based on the conceptual HBV-96 model and the PCRaster framework, is implemented for the Brahmaputra basin. Three different remote sensed datasets of precipitation (MSWEP, TMPA and PERSIANN-CDR) are used. Simple fusion methods are used to combine models results generate by the dataset of precipitation. The preliminary results of this study show that better model results are achieved merging the output results. Using MSWEP and TMPA as the forcing data provides satisfactory model results. On the other hand, use of PERSIANN-CDR leads to better prediction of flow peaks but overestimations of the hydrographs’ falling limbs.
Keywords: Brahmaputra basin, data fusion, distributed hydrological modelling, flood prediction, rainfall remote sensing
1 Introduction
Water resources management in ungauged basins is an important issue that has received a lot of attention in the last decades. One possible solution to the problem of data scarcity is the use of satellite products. Researchers have been exploring the possibilities of integrating the remote sensing products of precipitation,
Engineering
EPiC Series in Engineering
Volume 3, 2018, Pages 1366–1372
HIC 2018. 13th International Conference on Hydroinformatics
evapotranspiration and soil moisture with water resources management and modelling tools in the last years to improve floods and droughts predictions [1]. Karimi and Bastiaanssen [2] reviewed the reliability of remote sensing products to correctly estimate the spatial distribution of rainfall for water accounting issues. AghaKouchak et al. [3] noted that in the absence of extensive gauge networks the development of water resources management tools based on hydrological models will suffer from a lack of data if not properly integrated with remote sensing. Currently there is a choice of various products estimating precipitation with varying spatial-temporal characteristics.
There is one important limitation of the remote sensing rainfall products: such variable can be detected only indirectly, i.e. from cloud cover data. The uncertainty of those estimates becomes critical for the smaller time scales such as daily or shorter, important for rainfall runoff modelling in flood forecasting and river management. A (partial) solution is integration of remote sensing data with the available gauge and model data. Just recently, Beck et al. [4] presented the scientific details behind the Multi-Source Weighted-Ensemble Precipitation (MSWEP V 1.2) high resolution (3-hourly and 0.25°) dataset derived by fusing different data sources (gauge networks, satellite datasets and atmospheric reanalysis models at global scales) of varying resolutions for the period 1979-2015. For this reason, the objective of this study is to assess the usefulness of three different remote sensing products of precipitation (MSWEP, TMPA and PERSIANN-CDR) commonly used for flood predication on the Brahmaputra catchment. In addition, simple data fusion techniques are used to combine model output and improve flood estimation. A distributed hydrological model is used in this study
2 Case study and data set
The Brahmaputra Basin is a transboundary basin shared between China, India, Bangladesh and Bhutan. The basin origins at about 5800 m a.s.l. in a glacier mass in Tibet and it crosses almost 3000 km before joining the Ganges. There are four predominant seasons in the basin, the dry and cool winter from December to February, the dry and hot pre-monsoon season from March to May, the monsoon season from June to September, and the post-monsoon season from October to November [5]. The average annual river discharge of Brahmaputra River is 19,830 m3/s, with a maximum
and minimum discharge observed at the Bahadrudabad station (considered as the outlet of the basin) of 102,534 m3/s and 3,280 m3/s [5]. Floods usually occur in
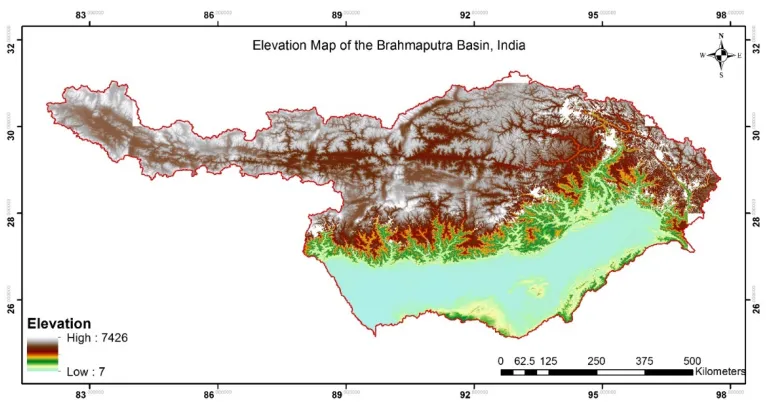
between September and October. In this study, the topography of the Brahmaputra basin is represented using a digital elevation model built with the SRTM data with 90mx90m resolution (see Figure 1). Three different remotely sensed rainfall datasets are considered in this study: 1) MSWEP, Multi-Source Weighted-Ensemble Precipitation [4]; 2) Multisatellite Tropical Rainfall Measuring Mission TMPA 3B42
Exploring the Use of the Three Rainfall Remote Sensing products for ... M. Mazzoleni et al.
V7 Daily [6]; and 3) PERSIANN-CDR, Precipitation Estimation from Remotely Sensed Information using Artificial Neural Networks - Climate Data Record [7]. All these global datasets have the same spatial resolution of 0.25°. In order to make a more reliable performance comparison between the datasets, it is recommended to use the single spatiotemporal data resolution. For this reason, we have resampled the dataset at daily temporal scale. Temperature and evapotranspiration data are retrieved from GLDAS.
Figure 1 Digital Elevation model of the Brahmaputra basin. Lower part
3 Methodology
3.1 Distributed hydrological modelling
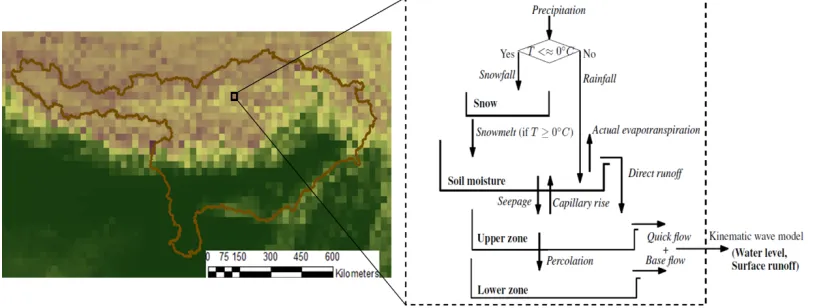
The flood hydrograph at Bahadurabad (considered as the outlet of the Brahmaputra basin) is estimated by means of a distributed hydrological model based on the conceptual HBV-96 model [8] and the PCRaster framework ([9], [10]) which is used to build the distributed spatial-temporal environment (see Figure 2).
The first modelling step is to discretize the spatial domain in a regular grid of given resolution in which the HBV conceptual model is implemented. In this study, a 25km
×25km gridded domain is generated because of the spatial resolution of the remotely sensed rainfall data [11].
Then, the conceptual HBV model is used to estimate the flow contribution from each grid cell. The HBV model consists of four model states namely snow (SN), soil moisture (SM), upper zone storage (UZ) and lower zone storage (LZ), and 21 parameters.
Exploring the Use of the Three Rainfall Remote Sensing products for ... M. Mazzoleni et al.
Finally, the PCRaster framework is used to propagate the quickflow and baseflow fluxes from for each cell along the river network by means of a kinematic wave model. In this way it is possible to calculate river flow at any grid cell within the river and not just at its outlet. A digital elevation model of 90mx90m resolution is used to estimate the drainage network within the PCRaster framework. The distributed hydrological model is calibrated separately for each one of the global rainfall datasets by minimizing the error between the simulated and observed flow hydrographs at the Bahadurabad station for 4 years between 2002 and 2006.
Figure 2 Left: Spatial discretization of the Brahmaputra basin using grid cell size of 25km × 25km. Right: Representation of the HBV model structure implemented for each grid cell. Model fluxes are in italic while model states are in bold (adapted from Rakovec et al. [11])
3.2 Data fusion techniques
Two different fusion approaches are used to improve flood estimation. It is worth noting that only TMPA and PERSIANN are used as input in the fusion methods, while MSWEP is used as benchmark to compare model results. The first approach (Fus1) is a simple averaging of the three original remote sensing products used as input in the distributed hydrological model. On the other hand, in the second approach (Fus2), the output of the three distributed model based on MSWEP, TMPA and PERSIANN are combined to obtain an average flow output. In the following, the first and second approaches are called “Fus1” and “Fus2” respectively.
4 Preliminary results
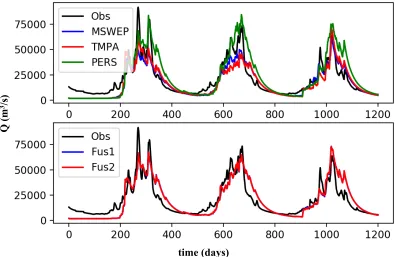
The preliminary results achieved in this study (see Figure 3) demonstrated the sensitivity of the model performances to the different remotely sensed rainfall datasets. Overall, similar results are achieved using MSWEP and TMPA. In particular, MSWEP
Exploring the Use of the Three Rainfall Remote Sensing products for ... M. Mazzoleni et al.
shows a bit higher model performance (Nash-Sutcliffe Efficiency (NSE) index equal to 0.77), while model results obtained using TMPA have NSE equal to 0.73. Use of PERSIANN-CDR leads to the lowest NSE value (0.604). However, as shown in Figure 3, PERSIANN-CDR allows for a better representation of the rising limb and peak of the flow hydrograph, while both MSWEP and TMPA tend to seriously underestimate such extreme values. Unfortunately, the good representation of the flow peak from PERSIANN-CDR corresponds to a significant overestimation of the falling limp of the flow hydrograph.
Data fusion methods showed similar results. In fact, there is no a clear difference between Fus1 and Fus2 in Figure 3. As expected, fusion methods helped to improve flood results if compared with the original TMPA and PERSIANN. It is interesting to note how the NSE value (NSE=0.76) is slightly lower than the one obtained with MSWEP, which is not used in the fusion techniques. These promising results demonstrate the usefulness of data fusion approaches when the two original model input provide low performances.
Figure 3 Flow hydrograph at Bahadurabad obtained using remote sensed rainfall datasets (MSWEP, TMPA and PERSIANN-CDR) as input of the distributed hydrological model
(first row) and the results obtained from the two fusion approaches (second row)
Q (m
3/s)
time (days)
Exploring the Use of the Three Rainfall Remote Sensing products for ... M. Mazzoleni et al.
5 Conclusions
This study focussed on exploring the effect of different global rainfall datasets on the results of the distributed hydrological model of the Brahmaputra basin. The HBV model is used together with the PCRaster modelling framework to adequately represent the spatial-temporal behaviour of the river flow. MSWEP, TMPA and PERSIANN-CDR global datasets are used as inputs to the hydrological model. The preliminary results of this study showed that high and comparable model performances are obtained using MSWPEP and TMPA. On the other hand, simulated flow calculated using PERSIANN-CDR tends to better fit the rising limb and peak part of the observed hydrograph, but shows overestimation of the falling limb, which drives the overall NSE value lower than the one obtained with MSWEP and TMPA. Data fusion approaches help to improve model results when two uncertain datasets are used as input. Good estimate of both low flow and flow peaks are obtained. Additional analysis will be performed to validate the preliminary findings of this research and including more global rainfall datasets and flood event to provide more general conclusions and recommendations.
Reference
[1]. Bhattacharya, B., Andel, S. J. v. and Masih, I. RainPRED - Transboundary Data and Rainfall Prediction - Technical Report. UNESCO-IHE, 2016.
[2]. Karimi, P. and Bastiaanssen, W. G. M.: Spatial evapotranspiration, rainfall and land use data in water accounting – Part 1: Review of the accuracy of the remote sensing data, Hydrol. Earth Syst. Sci., 19, 507-532, https://doi.org/10.5194/hess-19-507-2015, 2015. [3]. AghaKouchak, A., Behrangi, A., Sorooshian, S., Hsu, K. and Amitai, E. Evaluation of
satellite-retrieved extreme precipitation rates across the central United States. Journal of Geophysical Research: Atmospheres (1984–2012), 116, 2011.
[4]. Beck, H. E., van Dijk, A. I. J. M., Levizzani, V., Schellekens, J., Miralles, D. G., Martens, B. and de Roo, A. MSWEP: 3-hourly 0.25° global gridded precipitation (1979–2015) by merging gauge, satellite, and reanalysis data. Hydrol. Earth Syst. Sci., 21, 589-615, 2017. [5]. Mahanta, C., Zaman, A., Newaz, S., Rahman, S., Mazumdar, T., Choudhury, R., Borah, P. and Saikia, L. Physical Assessment of the Brahmaputra River. Dhaka, Bangladesh: International Union for the Conservation of Nature (IUCN), 2014.
[6]. Huffman, G. J., Bolvin, D. T., Nelkin, E. J., Wolff, D. B., Adler, R. F., Gu, G., Hong, Y., Bowman, K. P. and Stocker, E. F. The TRMM Multisatellite Precipitation Analysis (TMPA): Quasi-Global, Multiyear, Combined-Sensor Precipitation Estimates at Fine Scales. Journal of Hydrometeorology, 8, 38-55, 2007
[7]. Sorooshian, S., Hsu, K.-L., Gao, X., Gupta, H. V., Imam, B. and Braithwaite, D. Evaluation of PERSIANN System Satellite–Based Estimates of Tropical Rainfall. Bulletin of the American Meteorological Society, 81, 2035-2046, 2000.
[8]. Bergström, S. Development and application of a conceptual runoff model for Scandinavian catchments. SMHI RHO 7. Norrköping. 134, 1976.
[9]. Karssenberg, D., Schmitz, O., Salamon, P., De Jong, C., and Bierkens, M. F. P. A software framework for construction of process-based stochastic spatio-temporal models Exploring the Use of the Three Rainfall Remote Sensing products for ... M. Mazzoleni et al.
and data assimilation, Environ. Mod. & Soft., 25, 1–14, doi:10.1016/j.envsoft.2009.10.004, 2009.
[10].PCraster: Environmental Modelling language, available at: http:// pcraster.geo.uu.nl (last access: 14 October 2017), 2012.
[11].Rakovec, O., Weerts, A. H., Sumihar, J., and Uijlenhoet, R. Operational aspects of asynchronous filtering for flood forecasting, Hydrol. Earth Syst. Sci., 19, 2911-2924, https://doi.org/10.5194/hess-19-2911-2015, 2015.
Exploring the Use of the Three Rainfall Remote Sensing products for ... M. Mazzoleni et al.