Implications of land use change on river flow
in South West England
Lorena Liuzzo
1and Gabriele Freni
21
University of Exeter, Land, Environment, Economics and Policy Institute (LEEP), Prince of Wales Road, Exeter EX4 4PJ, United Kingdom
2
Università degli Studi di Enna Kore, Facoltà di Ingegneria ed Architettura, Cittadella Universitaria, 94100 Enna, Italy
l.liuzzo@exeter.ac.uk, gabriele.freni@unikore.it
Abstract
Assessing the impacts of future changes in land use on the hydrological cycle is an important issue for the proper management of water resources, since land use changes have implications on both water quantity and quality. Land use changes, in particular the expansion of urban areas, can significantly affect river flow increasing flood risk, whereas, the development of woodland areas could have positive effects on the reduction of peak flow. The present study has been carried out to assess and quantify the impact of land use changes on the water resources of a river basin located in South West England. With this aim, a hydrological model has been applied to some land use scenarios. In particular, two scenarios have been investigated: the first includes the increase of agricultural areas and the decrease of woodlands, the second includes the increase of urban areas and the decrease of woodlands. Results showed that, in the area of study, river flow would likely to be affected by future land use changes, mainly in the case of urban areas increase.
1
Introduction
Change in land use is not a new phenomenon, nevertheless, in recent decades, it has become more rapid. Globally, croplands, pastures and urban areas have expanded, increasing water and energy demand and the concentration of pesticides and fertilizers in river flow. Several studies pointed out that changes in land cover have influenced the hydrological regime of various river basins and the quality of their water (Tang et al., 2005; Li et al., 2009; Schilling et al., 2014; Tellman et al., 2016). Quantifying the extent to which land use affects water resources at the watershed scale is essential in
Engineering Volume 3, 2018, Pages 1240–1247
order to ensure their proper management. Due to the complexity of the hydrological processes, the magnitude of land use change impacts on runoff generation is still highly uncertain (Niehoff et al., 2002).
In order to assess the effects of land use changes on hydrological processes at watershed scale, several methods have been developed and applied, which mainly involve time series statistical analysis and hydrological modelling. Whereas statistical methodologies are not able to reproduce, by means of mathematical laws, the physical mechanisms of water cycle, hydrological models provide a framework to investigate the relationships between land use changes and water resources (Jothityangkoon et al., 2001). For this reason, the modelling approach has been widely chosen to carry out studies to investigate the effects of land use changes on runoff. To this aim, hydrological models have been applied following different approaches. Im et al. (2009) used the MIKE SHE model to analyze the hydrologic response to land use changes in a watershed located in South Korea. Baker and Miller (2013) used the SWAT model to assess land use impact on water resources in an East African watershed, finding that, in the area of study, land use changes caused increases in surface runoff and decreases in groundwater recharge.
Due to the use of spatially distributed data, the distributed physically-based hydrological models represent the most rational way to model the impact of land use changes on the runoff dynamics of a river catchment (Hundecha and Bárdossy, 2004). Nevertheless, these models are highly demanding in terms of data, and in many cases, their applicability could be restricted to small catchments. For these reasons, approaches based on conceptual models are usually applied. Reynard et al. (2001) analyzed the potential effects of climate and land use change in the Severn and Thames catchments (United Kingdom) using a conceptual rainfall-runoff model. The authors found that an increase of urban and forest cover cause a large shift in flow duration and flow frequency curve, even if in opposite directions. Schreider et al. (2002) used the IHACRES model (Jakeman et al., 1990) to determine the daily time series of 12 catchments in Australia under different land use conditions.
In this study, the implications of land use changes on river flow have been investigated, applying a hydrological model to two different potential future land use scenarios in a river basin located in South West England, the Exe at Thorverton. The applied model is based on the groundwater recharge model developed by Rushton et al. (2006) and allows to take into account the effects of different land uses in the processes of runoff generation. Both evapotranspiration from crops and evaporation from bare soil are included in the model.
2
Study area and dataset
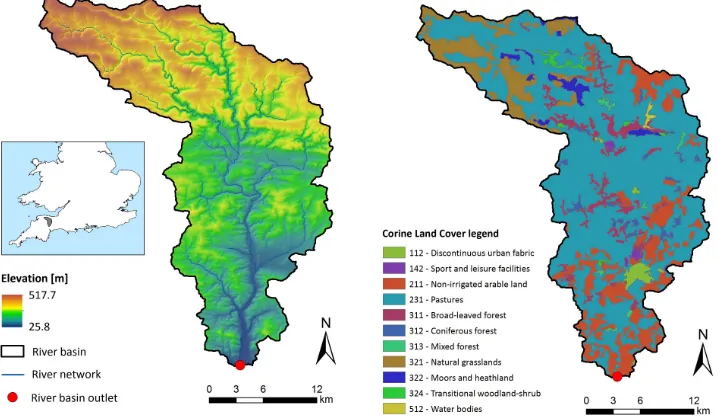
The study area is the Exe at Thorverton river basin, located in South West England. In the area of the basin (approximately 600 km2), land cover includes pasture (66.9%), woodlands (17.8%), arable (12.9%) and urban areas (2.4%). The prevalent crop in the arable areas is the winter wheat.
The geology is characterized by Devonian sandstones and Carboniferous Culm Measures, with subordinate Permian sandstones (in the East). The predominant soil type in the basin is the Dystric Cambisols, covering the 98% of the area, whereas the remaining 2% are Orthic Luvisols.
According to the Köppen classification, the climate of South West England is classified as oceanic, characterized by cool winters, warmer summers and precipitation distributed during the whole year. The average annual temperature is approximately 10°C. The warmest months are July and August, with an average annual temperature of 15-16°C. Average annual rainfall ranges between 1,200 and 1,300 mm/year. The average annual flow at the outlet is approximately 16.2 m3/s.
http://globalweather.tamu.edu/. Daily river flow data recorded at the Thorverton station (25.8 mAOD) have been provided by the National River Flow Archive of United Kingdom. The Corine Land Cover 2012 map has been used to obtain information about land use in the area of study. Figure 1 shows the digital elevation model of the basin, the outlet location and the land cover map.
3
Methodologies
3.1
Runoff modelling
The applied model is able to represent runoff and potential groundwater recharge processes based on soil moisture conditions, that are a function of catchment characteristics, in particular the crop types in arable areas and the related growth stages. The model is described in detail by Rushton et al. (2006).
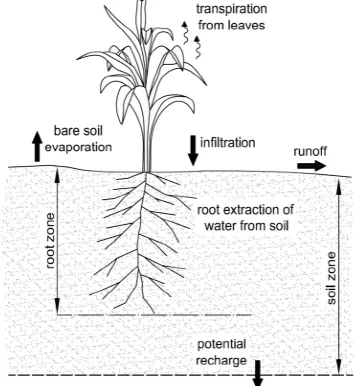
The processes included in the model can be summarized as follows (Figure 2): precipitation reaches the ground surface and, based on rainfall intensity and soil moisture conditions, some of it can generate runoff, while another part infiltrates in the soil zone. The amount of infiltrated water becomes available to supply potential evapotranspiration or to be stored as groundwater. Every time the potential evapotranspiration demand has been met, any further infiltrated water will be stored in the soil. This process will continue until the stored water reaches the field capacity, that is the point at which the soil becomes free draining and groundwater recharge occurs. During dry periods, the soil dries due to water uptake by the crop. The soil moisture deficit represents the depletion below field capacity that is the amount of water needed to bring the soil back to the field capacity. If enough water is available, actual evapotranspiration will occur at the potential rate.
In order to identify when the soil reaches the field capacity, the model simulates the soil moisture conditions on a daily basis throughout the year. Soil moisture distribution in the soil is linked with the permanent wilting point θWP that is the soil moisture content below which the plant roots are not able
to extract water, and the field capacity θFC. The main input for soil moisture balance is rainfall.
Interception and runoff reduce the actual infiltration to the soil zone. Runoff can be evaluated by means of coefficients that define the fraction of rainfall which becomes runoff. These coefficients depend on daily rainfall and soil moisture deficit.
The reference crop potential evapotranspiration ET0 is estimated using the FAO version of the
Penman-Monteith equation (Allen et al., 1998). The amount of water required by each crop is different, depending on the date of sowing and harvest, the growth of crop etc. The potential transpiration of the crop ETC is calculated as follows:
ܧܶ= ܭௌ∙ ܭ∙ ܧܶ (1)
where KS is the stress coefficient and KCis the crop coefficient (Allen et al., 1998). KS is estimated by
considering the depth of roots, the soil moisture deficit and the moisture holding properties of the soil, while KC depends on the growth stage of the crop, assuming the highest values during the
development and the mid stage, when the crop matures. Evaporation from bare soil occurs from crop harvest up to the complete coverage of ground by the crop.
The total water available to the plants (TAW) depends on the depth of the crop roots Zr and the
difference between the water content at the field capacity and the wilting point:
ܶܣܹ = 1000ሺߠி− ߠௐሻܼ (2)
In order to represent the condition in which the crop can obtained all the required water from the soil, the readily available water RAW is introduced in the model:
ܴܣܹ = ∙ ܶܣܹ (3)
where p is a factor that ranges between 0.2 and 0.7. Once the soil moisture deficit exceed the RAW, the crop in under stress conditions and will transpire at a reduced rate, whereas the crop transpires at the potential rate when RAW is higher than the soil moisture deficit.
In the soil moisture balance, it is assumed that groundwater recharge will occur on days when the soil moisture deficit become zero and the soil becomes free draining. Recharge is equal to the amount of water exceeding that required by the soil to reach the field capacity. All the stage of soil moisture balance calculation are fully described by Rushton et al. (2006).
3.2
Land use change scenarios
U.K. land use is currently dominated by agriculture. Approximately 14% of the U.K. territory is covered by urban areas, which increased by around 300,000 ha since 1998 (DEFRA, 2006). Some studied have developed future land use change scenarios for U.K. (Reynard et al., 2001; Johnes et al., 2007), nevertheless results of these analyses are affected by a high degree of uncertainty. Most of these scenarios are based on the following potential conditions (Rounsevell and Reay, 2009):
•a reduction of croplands used for food production, and an increase of those used for bioenergy; •an increase in urban areas, with different spatial patterns, as response to population growth and
residential location choices;
•an increase of forests that will replace the areas previously used for agriculture, but also due to the reforestation strategies included in rural development policy;
•a retreat in coastal land areas, due to coastal erosion and sea level rise.
The aspects involved in potential land use change are different and numerous, however, socio-economic factors and climate change are those that will mainly affect future changes (Rounsevell et al., 2006). In this study, two different land use change scenarios have been analysed, assuming the increase of croplands and urban areas:
•Scenario A: it has been assumed that woodland areas are completely replaced with arable areas farmed with winter wheat. In this scenario cropland areas cover the 30.7% of the river basin area;
•Scenario B: woodland areas are completely replaced with urban areas. In this scenario urban areas cover the 20.2% of the river basin area.
4
Results and discussion
Before the application to the land use change scenarios, the model has been calibrated and validated. To identify the set of model parameters that provides a good fit between observed and simulated discharges, a Monte Carlo procedure has been used, consisting in a random generation of parameters value in fixed ranges of variation. In this way, each model simulation has been characterized by a different combination of randomly generated parameters.
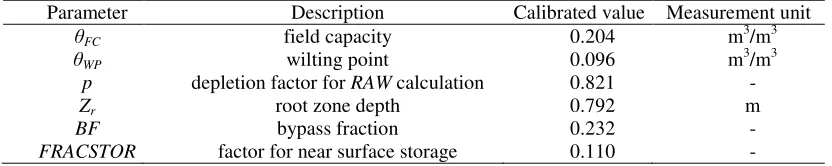
Daily river flow data recorded over the 2003-2008 period has been used for model calibration, while model validation has been performed using data measured from 2009 to 2012. Table 1 shows the set of parameters that provided the best simulation in model calibration.
Parameter Description Calibrated value Measurement unit
θFC field capacity 0.204 m3/m3
θWP wilting point 0.096 m3/m3
p depletion factor for RAW calculation 0.821 -
Zr root zone depth 0.792 m
BF bypass fraction 0.232 -
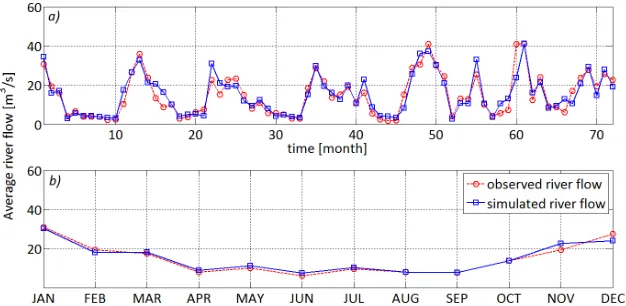
The Nash and Sutcliffe coefficient (NS) has been calculated to evaluate the model performance. At daily scale, the calibrated model provided a NS coefficient equal to 0.7, while at the monthly scale the performance improved, reaching a NS value equal to 0.85. Validation NS coefficients were 0.6 and 0.8 for daily and monthly river flow respectively. Figure 3a) shows the average river flow series simulated for each month of the 2003-2008 period compared with the observed series. The mean monthly values of the observed and simulated series are compared in Figure 3 b).
According to the previously described results, the model is able to reproduce the time pattern of the average monthly river flow, providing a reliable estimation of the available surface water resources. Thereafter, the calibrated model has been applied the land use change scenarios. The daily river flow has been simulated and then aggregated at the monthly scale in order to evaluate the available water volumes at the watershed outlet. In current land use conditions, the average annual river flow is equal to 15 m3/s, while the simulated river flow is equal to 16 m3/s and 17 m3/s in the Scenario A and B respectively. Table 1 shows the annual average water volumes in Mm3 at the river basin outlet in the different scenarios. Both Scenario A and B are characterized by an increase of water volume, that is slightly higher in the case of urban areas expansion (Scenario B).
Land use Volume [Mm3] ∆ [%]
Current conditions 476.4 -
Scenario A 546.2 +14.7%
Scenario B 556.6 +16.8%
Table 2 Available volumes of water [Mm3] in current land use conditions and in the two scenarios
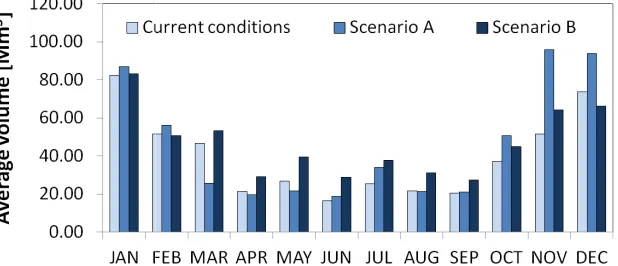
Figure 4 shows the monthly average water volumes in Scenario A and B, compared to the current conditions of land use. It can be observed that the monthly variability of water volumes is more evident in the case of Scenario A. Indeed, due to the increase of the crop areas, water balance is more affected by the evapotranspiration processes related to the growth stages of the winter wheat. The expansion of agricultural areas in scenario A and urban areas in scenario B caused the increase of surface runoff, and consequently of the water volumes at the river basin outlet. This increase is also due to the reduction of water infiltration into the soil and the groundwater recharge. In Scenario A, the highest increases of water volumes occur during autumn months (+85.4% in November), while in Scenario B during summer months (+76.9% in June). The increase of water volumes in both scenarios highlights the importance of the role of woodland areas in flood risk reduction.
The applied model allowed to estimate the groundwater recharge as the quantity of water that exceeds the amount required to bring the soil to field capacity.
observed in both scenarios, with the highest rates occurrin
the 50% less recharge in the two scenarios, if compared with current land use conditions). At the annual scale, recharge decreases by the 25.6% and the 37.4% in Scenario A and Scenario B, respectively. In both scenarios, the decrease in monthly groundwater recharge can be attributed to a reduction of soil infiltration, an increase of surface runoff and evapotranspiration. A reduction of base flow also occurred in the two land use change scenarios. Specifically, the aver
2.3 m3/s in the current conditions, while it is equal to 1.8 m respectively.
5
Conclusions
Changes in land use will have important impacts on water resources. The magnitude of these impacts need to be assessed in order to ensure an effective land planning and management.
describes the application of a hydrological model for the estimation of water resources in land use scenarios. The model has been calibrated and applied to
Thorverton river basin, located in South West England. Most of the land in the basin is covered by pasture. Two land use change scenarios have been investigated: in the first scenario, woodlands have been completely replaced with croplands, whereas in the second scenario all the woodlands have been replaced with urban areas. The model has been applied to calculate the average monthly water volumes available at the basin outlet and the groundwater recharge in each scen
an increase of water volumes and a decrease of groundwater recharge in both scenarios. Specifically, the recharge rate can be reduced up to 40% in annual average and to more than 50% in the summer season. This variation will surely aff
time, will have a relevant environmental impact on river ecosystems due to the reduction of base flows. Further development of this study could include the analysis of the effects of dif
changes (in term of type of land use and percentage of changed area) on the hydrological response of the river basin, including the increase of woodland areas.
Figure 4: Monthly average water volumes in Scenario A and B, compared to the current conditions of land use.
The applied model allowed to estimate the groundwater recharge as the quantity of water that exceeds the amount required to bring the soil to field capacity. A reduction of groundwater
observed in both scenarios, with the highest rates occurring during summer months (approximately the 50% less recharge in the two scenarios, if compared with current land use conditions). At the annual scale, recharge decreases by the 25.6% and the 37.4% in Scenario A and Scenario B, s, the decrease in monthly groundwater recharge can be attributed to a reduction of soil infiltration, an increase of surface runoff and evapotranspiration. A reduction of base flow also occurred in the two land use change scenarios. Specifically, the average annual base flow is /s in the current conditions, while it is equal to 1.8 m3/s and 1.5 m3/s for Scenario A and B,
Changes in land use will have important impacts on water resources. The magnitude of these mpacts need to be assessed in order to ensure an effective land planning and management.
describes the application of a hydrological model for the estimation of water resources in land use scenarios. The model has been calibrated and applied to estimate daily river flow in the Exe at Thorverton river basin, located in South West England. Most of the land in the basin is covered by pasture. Two land use change scenarios have been investigated: in the first scenario, woodlands have replaced with croplands, whereas in the second scenario all the woodlands have been replaced with urban areas. The model has been applied to calculate the average monthly water volumes available at the basin outlet and the groundwater recharge in each scenario. Results showed an increase of water volumes and a decrease of groundwater recharge in both scenarios. Specifically, the recharge rate can be reduced up to 40% in annual average and to more than 50% in the summer season. This variation will surely affect water resources availability in the near future and, at the same time, will have a relevant environmental impact on river ecosystems due to the reduction of base Further development of this study could include the analysis of the effects of different land use changes (in term of type of land use and percentage of changed area) on the hydrological response of the river basin, including the increase of woodland areas.
Monthly average water volumes in Scenario A and B, compared to the current
The applied model allowed to estimate the groundwater recharge as the quantity of water that groundwater recharge is g during summer months (approximately the 50% less recharge in the two scenarios, if compared with current land use conditions). At the annual scale, recharge decreases by the 25.6% and the 37.4% in Scenario A and Scenario B, s, the decrease in monthly groundwater recharge can be attributed to a reduction of soil infiltration, an increase of surface runoff and evapotranspiration. A reduction of base age annual base flow is /s for Scenario A and B,
Changes in land use will have important impacts on water resources. The magnitude of these mpacts need to be assessed in order to ensure an effective land planning and management. This paper describes the application of a hydrological model for the estimation of water resources in land use estimate daily river flow in the Exe at Thorverton river basin, located in South West England. Most of the land in the basin is covered by pasture. Two land use change scenarios have been investigated: in the first scenario, woodlands have replaced with croplands, whereas in the second scenario all the woodlands have been replaced with urban areas. The model has been applied to calculate the average monthly water ario. Results showed an increase of water volumes and a decrease of groundwater recharge in both scenarios. Specifically, the recharge rate can be reduced up to 40% in annual average and to more than 50% in the summer ect water resources availability in the near future and, at the same time, will have a relevant environmental impact on river ecosystems due to the reduction of base ferent land use changes (in term of type of land use and percentage of changed area) on the hydrological response of
References
Allen, R. G., Pereira, L. S., Raes, D., & Smith, M. (1998). Crop evapotranspiration-Guidelines for computing crop water requirements-. FAO Irrigation and drainage paper 56 , 300(9), p.D05109. Baker, T. J., & Miller, S. N. (2013). Using the Soil and Water Assessment Tool (SWAT) to assess
land use impact on water resources in an East African watershed. Journal of Hydrology, 486, 100-111.
DEFRA Department for Environment, Food and Rural Affairs. (2006). e-digest statistics. Retrieved from http://www.defra.gov.uk/environment/statistics/index.htm
Hundecha, Y., & Bárdossy, A. (2004). Modeling of the effect of land use changes on the runoff generation of a river basin through parameter regionalization of a watershed model. Journal of hydrology, 292, 281-295.
Im, S., Kim, H., Kim, C., & Jang, C. (2009). Assessing the impacts of land use changes on watershed hydrology using MIKE SHE. Environmental Geology, 57, 231–239.
Jakeman, A. J., Littlewood, I. G., & and Whitehead, P. G. (1990). Computation of the instantaneous unit hydrograph and identifiable component flows with application to two small upland catchments. Journal of hydrology, 117, 275-300.
Johnes, P. J., Foy, R., Butterfield, D., & Haygarth, P. M. (2007). Land use scenarios for England and Wales: evaluation of management options to support ‘good ecological status’ in surface freshwaters. Soil Use and Management, 23, 176-194.
Jothityangkoon, C., Sivapalan, M., & Farmer, D. L. (2001). Process controls of water balance variability in a large semi-arid catchment: downward approach to hydrological model development. Journal of Hydrology, 254 , 174-198.
Li, Z., Liu, W. Z., Zhang, X. C., & Zheng, F. L. (2009). Impacts of land use change and climate variability on hydrology in an agricultural catchment on the Loess Plateau of China. Journal of hydrology, 377, 35-42.
Niehoff, D., Fritsch, U., & Bronstert, A. (2002). Land-use impacts on storm-runoff generation: scenarios of land-use change and simulation of hydrological response in a meso-scale catchment in SW-Germany. Journal of Hydrology, 267(1), 80-93.
Reynard, N. S., Prudhomme, C., & Crooks, S. M. (2001). The flood characteristics of large U.K. rivers: Potential effects of changing climate and land use. Climatic Change, 48, 343-359.
Rounsevell, M. D., & Reay, D. S. (2009). Land use and climate change in the UK. Land Use Policy, 26, S160-S169.
Rounsevell, M. D., Reginster, I., Araújo, M. B., Carter, T. R., Dendoncker, N., Ewert, F., . . . Tuck, G. (2006). A coherent set of future land use change scenarios for Europe.
Rushton, K. R., Eilers, V. H., & Carter, R. (2006). Improved soil moisture balance methodology for recharge estimation. Journal of Hydrology, 318, 379-399.
Schilling, K. E., Kling, C. L., Campbell, T., Jha, M. K., Wolter, C. F., & Arnold, J. G. (2014). The potential for agricultural land use change to reduce flood risk in a large watershed. Hydrological processes, 28, 3314-3325.
Schreider, S., Yu., J. A., Letcher, R., Nathan, R., Neal, B. P., & Beavis, S. G. (2002). Detecting changes in streamflow response to changes in non-climatic catchment conditions: farm dam development in the Murray–Darling basin. Aust. J. Hydrol., 262.
Tang, Z., Engel, B. A., Pijanowski, B. C., & Lim, K. J. (2005). Forecasting land use change and its environmental impact at a watershed scale. Journal of environmental management 76, 35-45. Tellman, B., Saiers, J. E., & Cruz, O. A. (2016). Quantifying the impacts of land use change on