Iranian Journal of Fisheries Sciences 15(3) 995-1008 2016
Population genetic structure of the white sardine,
Sardinella
albella
, in the Persian Gulf and Sea of Oman by analysis of
mitochondrial control region
Rahimi P.
1*; Rezvani Gilkolaie S.
2; Ghavam Mostafavi P.
1;
Jamili Sh.
2; Rahnema M.
3Received: March 2015 Accepted: March 2016
Abstract
Several studies on the white sardine: Sardinella albella, have focused on the identification of stock composition and behavior. In this study population genetic structure and historical demography of S. albella along the cost of the Persian Gulf and Sea of Oman were investigated with a 500-bp segment of mt-DNA control region. In total 40 samples were collected from 3 locations: Jask in Sea of Oman, Qeshm in Strait of Hormuz and Lengeh in the Persian Gulf during 2012-2013. 33 haplotype were obtained none of which were presented in all sampling sites. Analysis of molecular variance (AMOVA) indicated low genetic differentiation among regions (FST=0.024,
p<0.05).The average pair wise differences between regional population were small but significant (0.0158-0.165). Molecular variance explained by differences among three regions was significantly different from zero but the FST did not show clear
phylogeographic isolation. This observation can support the conclusion that S. albella has a widespread dispersal potential.
Keywords: Sardinella albella, Clupeidae, Sardine Fish, Persian Gulf and Sea of Oman
1-Department of Marine Biology, Graduate School of Marine Science and Technology, Science and Research Branch, Islamic Azad University, Tehran, Iran.
2-Iranian Fisheries Science Research Institute, Agricultural Research, Education and Extension Organization, Tehran, Iran.
3-Department of Basic Science and Medicine, Zanjan Branch, Islamic Azad University, Zanjan, Iran
* Corresponding author's Email: prahimi1975@gmail.com
996 Rahimi et al., Population genetic structure of the white sardine, Sardinella albella, in the …
Introduction
The genetic structure of fish populations is important not only because of fundamental interest in biotic evolution (Tudela et al., 1999) but also for the management of fisheries (Roldan et al., 2000). So the biological and ecological knowledge about their populations can be relevant in devising suitable management strategies.
Sardines have a very important ecological role in marine ecosystems because they are first consumers in marine food chain and they are the main food of valuable species as tuna. So a decrease in their population will decline fishing of these species (Whithead, 1988). There are 10 genera of Clupeidae in the south of Iran. Sardinella albella is one of the most abundant species inhabiting the tropical and subtropical coastal regions in Indo –pacific from east of Africa, Red Sea, Persian Gulf, Sea of Oman and Indian ocean up to Indonesia and new Gionea (Whithead, 1985) (Fig. 1). In Iran Sardinella albella lives in estuaries along the north coast of the Persian Gulf and Sea of Oman. Adults make schools that can be maintained as a dark span during the day but at night schools scatter and migrate to deep areas to feed. In the breeding season, adults migrate to coastal areas from mid April to the end of June. Their eggs and larva are pelagic (Van Zailing et al., 1993). The life history of Sardinella albella and their passive and active dispersal mechanism have a direct influence on population structure (Liu et al., 2009). Because of the importance of the
identification of stock structure in stock assessment and harvest management (Whithead,1985), in this study we investigated the population of Sardinella labella in 3 sites located along the north coast of the Persian Gulf and Sea of Oman. The mitochondrial control region serves as the origin of replication for the mitochondrial genome and is usually more variable than other coding genes (Avis, 1994; Parker et al., 1998). So it is an ideal marker for assessing genetic structure of recently diverged or closely related species or populations (Avis, 1994; Rand, 2000). We used partial sequence of mitochondrial control region (D-Loop) to test the hypothesis that indicates: there are no significant genetic differences between sampling zones.
Materials and methods
Sampling
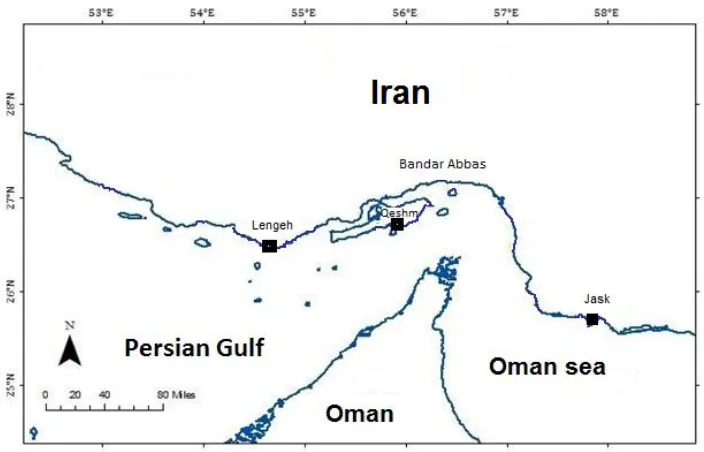
The white sardines used in the present study were collected between autumn 2012 and summer 2013 from commercial landing in Sea of Oman (Jask), strait of Hormoz (Qeshm) and the Persian Gulf (Lengeh). Geographic locations and sample sites are given in Fig. 2.
The dorsal fin of each individual was obtained and preserved in 98% ethanol for genomic DNA extraction.
Iranian Journal of Fisheries Sciences 15(3) 2016 997
Figure 1: The map of global distribution of Sardinella albella (Whithead, 1985).
Figure 2: Sampling sites in the Persian Gulf and Sea of Oman.
998Rahimi et al., Population genetic structure of the white sardine, Sardinella albella, in the …
DNA extraction, amplification, and sequencing
Genomic DNA was isolated using the phenol- chloroform standard method. The primers reported by Somante et al. 2000 were used to amplify a fragment of the control region (D-Loop) of mtDNA, (Fig. 3).
Polymerase chain reaction (PCR) was performed in a total volume of 25 μL reactions containing 1×PCR buffer, 200 mM dNTPs, 1.5 mM MgCl2, 0.3 mM of
each primer, 0.5 units Taq DNA polymerase (Fermentaze) and 1 μL of DNA. PCR cycling consists of an initial denaturation at 94° C for 5 min, followed by 30 cycles of 45 sec at 95°C, 45 sec at 52° C, and 2 min at 72° C, with a final elongation of 5 min at 72°C. After visualization on a 1% agarose gel, the appropriate PCR products were sent to the micro gen lab for sequencing. The primers used for sequencing were the same as those for PCR amplifications.
Data analyses
The sequences for all individuals were aligned and edited by BioEdit software (Hall, 1999) and Mega5 (Tamura et al., 2011) which uses Clustal w algorithm. Molecular diversity indices such as number of haplotypes, polymorphic sites, transition, transversions, and indels were obtained by using the program ARLEQUIN 3.5 (Excoffier et al., 2011). Population genetic structure was analyzed by using the analysis of molecular variation (AMOVA), which estimates the proportion of genetic variation within and among
populations. Genetic differentiation between populations was assessed by comparing the average number of pair wise differences between population, within populations (PiX and PiY) and the corrected average pair wise difference (PiXY-(PiX+PiY)/2) using the program ARLEQUIN 3.5 (Excoffier et al., 2011). The significance of differentiation between pairs of populations was tested by exact test (Raymond and Rousset, 1995) using 10,000 Markov chain steps. Molecular pairwise FST was estimated to evaluate
genetic differentiation between pairs of data set. The demographic history was investigated by examine the mismatch distributions (Rogers and Harpending, 1992; Ray et al., 2003; Excoffier, 2004). The parameters of demographic expansion τ, θ 0, θ1 were estimated. τ
index is the time since population expansion expressed as unites of mutational time (Rogers and Harpending, 1992). θ0 and θ1 are the
mutation parameters before and after population growth. The overall validity of the estimated demographic model is tested by the distribution of a tested statistic (SSD) (the sum of squared differences) between the observed and estimated mismatched distribution. To test whether the D-loop data confirm to neutrality's expectations, the Tajima's D (Tajima, 1989) and Fu's Fs (Fu, 1997) statistics were used. The significance of neutrality was tested with a coalescent simulation program (1000 simulations) as implemented in ARLEQUIN 3.5 (Excoffier et al., 2011).
999Rahimi et al., Population genetic structure of the white sardine, Sardinella albella, in the …
Results
Genetic diversity
A 500 bp fragment of the control region (D_Loop) of 40 specimens was sequenced. 15 polymorphic sites defined 33 haplotypes among specimens (GenBank accession no. are from KP714734 tile KP714763). This high genetic variability is evident by the large haplotype diversity. No haplotype was presented in all zones (Table 1). Average values of pair wise differences among populations were between 3.25 and 5.01 and corrected average of pair wise difference ranged from 0.051 to 0.1313 (Table 2). These results demonstrated that nucleotide diversity is low and haplotype diversity is high in Lengeh and both nucleotide diversity and haplotype diversity are high in Jask (Table 1). However in Qeshm the haplotype diversity is high and the nucleotide diversity is low.
Geographical structure of genetic variation
The genetic difference was detected in the average number of the pairwise differences (Table 2). The average number of pairwise differences and corrected number of pairwise differences
showed minor but significant differentiation between localities (Table 2). The most difference is between Qeshm and Lengeh. AMOVA test (k2 p,
p<0.05) of genetic diversity showed low variation between populations and high variation within them and fixation index of genetic diversities (FST)
between 3 localities was low too (Table 3). Pairwise FST between Lengeh and
Qeshm is low but is more than that between Jask and Qeshm (Table 4).
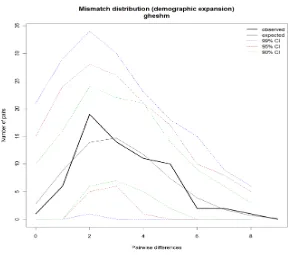
Patterns of historical demography None of the mismatched analyses deviated significantly (p>0.05) from expectations under the sudden expansion model, and hence analysis of demographic patterns was suitable (Table 5). The mismatch distribution for both Lengeh and Qeshm was unimodal, and closely matched the expected distribution under the sudden expansion modal. But the mismatch distributions for Jask were multimodal and much smoother, suggesting that this population has not always remained stationary (Fig.4). All Tajima’s D and Fu's Fs values were negative (p<0.05)
suggesting the effects of populations growth (Table 5).
J :TTTGGTTCCTATTTCAGGGCCA Samonte et al.,(2000).
N : GGGGCGCGGATCCCATCCTAATATCTTCAG Samonte et al.,(2000).
Figure 3: Structure of control region of mtDNA and the primers have been used from Samonte et
al., (2000).
Iranian Journal of Fisheries Sciences 15(3) 2016 999
Iranian Journal of Fisheries Sciences 15(3) 2016 1000
Table 1: Sample size (n), number of haplotype (nh), haplotype diversity (H), nucleotide diversity (π) and standard deviation (SD) for each group.
Stocks N nh H± SD π±SD Mean number of
pair wise differences Jask 13 10 0.9615± 0.0496 0.01287±0.0073 6.052±3.082
Qeshm 12 11 0.9848±0.0403 0.00808±0.004 3.789±2.05 Lengeh 15 11 0.8952±0.0704 0.00541±0.0034 2.536±1.44
Table2: Pair wise population differences for mitochondrial control region sequences of Sardinella albella (p<0.05). Above diagonal: average number of pair wise differences between populations (PiXY). Diagonal elements: average number of pair wise differences within population (PiX). Below diagonal: corrected average number of pairwise difference (PiXY-(PiX+PiY)/2).
Lengeh Qeshm Jask
Lengeh 2.535 3.294 4.347
Qeshm 0.1313 3.789 5.010
Jask 0.0513 0.0874 6.055
Table3: Hierarchical analysis of molecular variance (AMOVA) of mtDNA control region haplotypes of Sardinella albella (k2 p, p< 0.05).
Source of variation
df Sums of squares Variance
component
Percentage of variation Among populations 2 5.345 0.04876 va 2.35 Within populations 37 74.93 2.02513 vb 97.65
Total 39 80.275 2.07389
Fixation index FST: 0.024
Table 4: FST estimates between geographical populations of Sardinella albella based on mitochondrial control region sequences haplotypes (p<0.05).
Lengeh Qeshm Jask
Lengeh 0.000
Qeshm 0.044 0.000
Jask 0.01656 0.0158 0.000
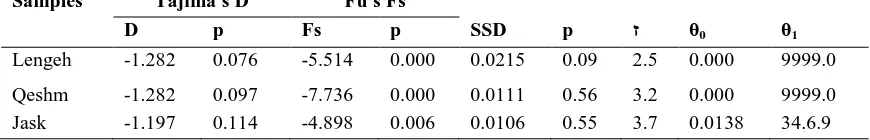
Table 5:Results of Tajima's D, Fu's Fs, mismatch distribution test (SSD), corresponding
p-value and the mismatch distribution parameter estimates based on the Sardinella albella mt DNA control region in three populations (p<0.05).
Samples Tajima's D Fu's Fs
D p Fs p SSD p ז θ0 θ1
Lengeh -1.282 0.076 -5.514 0.000 0.0215 0.09 2.5 0.000 9999.0 Qeshm -1.282 0.097 -7.736 0.000 0.0111 0.56 3.2 0.000 9999.0 Jask -1.197 0.114 -4.898 0.006 0.0106 0.55 3.7 0.0138 34.6.9
1000 Rahimi et al., Population genetic structure of the white sardine, Sardinella albella, in the …
Iranian Journal of Fisheries Sciences 15(3) 2016 1001
1002Rahimi et al., Population genetic structure of the white sardine, Sardinella albella, in the …
Figure 4: Mismatch distributions of the Sardinella albella mtDNA control region in populations of
Lengeh, Qeshm and Jask.
Discussion
The genetic structure of marine organisms can be attracted by many poorly understood variables such as physical oceanographic factors including currents, tides, and violent storms. The biological factors such as local recruitment, larval transport potential, or reproductive strategy can influence the populations too (Palumby, 1994). Some barriers such as large distances, massive river outflows or unsuitable habitats can separate the distribution of some marine fish populations (Liu et al., 2009). Some studies have provided evidence of long – distance dispersal linking populations at the scale of ocean basins (Bowen et al., 2001) and the others indicate that clear divisions have been found over relatively short geographic distances
(Guarnieo et al., 2002; Hoffman et al., 2005; Bernal – Ramirez et al., 2003; Carlin et al., 2003; Rodriguez, 2011). The meaningful divergence of genetic signals can be maintained for widely distributed fishes whose populations might have been subjected to the effects of such complex variables (Ward et al, 1994; Aripin and Showers, 2000; Atarhouch et al., 2006).
Historical demography and genetic diversity
Populations of fishes often show high haplotypes but medium to low nucleotide diversities (Vaughan et al., 1992; Grant and Bowen,1998 ; Dudgeon et al., 2000 ; Fauvelot et al., 2003 ; Chen et al., 2004 ;). In 1997 Bowen and Grant investigated the phylogeography of the sardines
Iranian Journal of Fisheries Sciences 15(3) 2016 1003
(Sardinops spp.) as a widely distributed species in temperate upwelling zones and assessed biogeography models for them. Bowen and Avise (1990) studied the influence of zoogeographic factors and life-history patterns of Atlantic menhaden, Brevoortia tyrannus. In 2004, Bay et al. investigated genetic structure of Chlorurus sordidus and found high genetic diversities in it. The high genetic diversities of these species were ascribed to their long stable evolutionary history (Grant and Bowen, 1998).
In this study the mismatch distribution (Fig.4) for both Lengeh and Qeshm were clearly unimodal and none of the mismatch distributions (Table 5) deviated significantly (p>0.05) from expectations under sudden expansion model (Rogers and Harpending, 1992) or there is a high rate of migration between near demes (Ray et al., 2003; Excoffier,2004). But the mismatch distribution of Jask population is bimodal and suggested that the population is in equilibrium (Rogers and Harpending, 1992). Although Fu’s value was negative and significantly deviated from a neutral rate, the Tajima’s D was negative but not significant (p>0.05). Population expansion and mutation rate heterogeneity have opposite effects on Tajima’s D statistics (Aris-Brosou and Excoffier, 1996). The negative amount of Tajima’s D and Fu’s Fs is due to genetic expansion of population in the 3 localities. The high amount of θ1 can confirm expansion of genetic diversity. The result of increase in genetic
diversity is stability of the population. These results demonstrated that our data fit well with the model of spatial expansions of population.
High haplotype diversity and low nucleotide diversity (Table 1) was found in the hyper variable portion at the 3' end of the mitochondrial control region among the three localities. According to Grant and Bowen’s (Grant and Bowen, 1998) populations in 3 localities have all experienced rapid population expansion after a period of low effective population size. This criterion enhances the retention of new mutation (Avise et al., 1984). The results were consistent with mismatch distribution analysis and the neutrality test (Table 5). However the high haplotype diversity and low nucleotide diversity in Qeshm may be result in migration of some groups for feeding in the sampling site (Grant and Bowen, 1998).
Population genetic structure
Pelagic marine fishes generally show low levels of genetic diversity among geographic regions because of high dispersal potential during planktonic eggs, larval or adult history stages as a migratory habit and absence of physical barriers between ocean basins or adjacent continental margins (Palumbi, 1994; Grant and Bowen, 1998; Hewitt, 2000). In 2006 Atarhouch et al. investigated populations of Moroccan sardines (Sardinia pilchardus) and find that the genetic diversity can be the result of adaptation of fish to the environment and stability of
1004Rahimi et al., Population genetic structure of the white sardine, Sardinella albella, in the …
populations, number of effective reproductive females and dimension of population. Mangulas et al. (2006) investigated the population structure in Atlantic and Mediterranean anchovy (Engraulis encrasicolus) by studying mitochondrial DNA. The results revealed a mosaic pattern of phylogeographical structures for this species and also diversity among populations became low and that within populations become high. Species characters and environmental conditions influence gene flow between localities and cause differences in phenotypic and genotypic characters. Rodriguez et al. (2011) investigated population structure of Pacific sardine (Sardinops sagax) and found that high ability of migration of adults and the California current system, which disperses eggs and larva, may be due to weak phylogeographic structures in this species. The adults of Sardinella albella have horizontal migrations and prefer to vertically migrate to costal margins for breeding and their larvae and juveniles are regarded as pelagic. So the high genetic diversity in Sardinella labella populations shows stability because of the creation of large schools. In contrast to the high genetic diversity within populations, low genetic diversity was detected among them (Table 3). These criteria show gene flow between localities. Oceanic and sea currents can effect dispersal of fishes. Among populations, differences might be the result of passive dispersal of eggs and larva and active dispersal of adults or existence of gene flow
between populations (Bowen and Grant, 1997; Grant and Bowen, 1998; Hewitte, 2000). There is in current water along north coastal areas of the Persian Gulf from the Sea of Oman (Hunter, 1983; Pous et al., 2004) that can be the cause of passive transports of eggs & larva from the Sea of Oman to the Persian Gulf and the occurrence of gene flow between them. Better environmental conditions in the Sea of Oman, and the monsoons of the Indian Ocean, resulted in differences in morphological characters between animals of the Sea of Oman and the Persian Gulf (Emara, 1990; Alabdessalam, 1995; Cole, 1998; Feron, 1999; Aripin, 2000; Salarpouri et al., 2003; FAO, 2010; Salarpouri et al., 2014; ). In our study morphological characters showed meaningful differences between sampling sites (Rahimi et al., 2013) but investigation of genetic populations of S. albella revealed no meaningful genetic differentiation between populations and Tajima’s D and Fu's Fs show genetic expansion in 3 localities. High amounts of θ1 also demonstrate expansion of
genetic diversity, so these results demonstrated that S. abella populations may be having stability and widespread dispersal in the Persian Gulf and the Sea of Oman. However the high haplotype diversity and low nucleotide diversity in Qeshm may be the result of migrations of some groups for feeding in the sampling site (Grant and Bowen, 1998). It seems that observed differences in morphological characters are only in the phenotype level and the
Iranian Journal of Fisheries Sciences 15(3) 2016 1005
populations of Sardinella albella in the Persian Gulf and Oman Sea have no genetical differences. On the other hand low observed genetic variation (Fst=0.02) did not have enough ability to separate the populations in the sample sites. So our hypotheses: there are no significant genetic differences between sampling zones, can be accepted. But more investigation with other gene targets must be done to approve this conclusion. These results can be useful to manage the source of this fish in the Persian Gulf and the Sea of Oman.
Acknowledgements
We would like to specially thank Salarpouri, Laloei and Taghavi in the Iranian Fisheries Science Research Institute (IFSRI) and Azad University of Tehran, Science and Research Branch and Azad University of Zanjan in sample collection and experimental works.
References
Alabdessalam, T.Z.S., 1995. Marine species of the Sultanate of Oman. Ministry of Agriculture and Fisheries. Sultanate of Oman publication, 412P.
Aripin, I.E.P. and Showers A.T., 2000. Population parameters of small pelagic fishes caught off Tawi-Tawi, Philippines. Nega, 23(4), 21-27.
Aris – Brosou, S. and Excoffier, L., 1996. The impact of population of expansion and mutation rate heterogeneity on DNA sequence
polymorphism. Molecular Biology and Evolution, 13, 494-504.
Atarhouch, T., Ruber, L., Gonzalez, E.G., Albert, E.M., Rami, M., Dakkak, A. and Zardoya, R., 2006. Signature of an early genetic bottleneck in a population of Moroccan sardines (Sardinia
pilchardus). Molecular
Phylogenetics and Evolution, 39, 373-383.
Avis, J.C., 1994. Molecular markers, Natural history and Evolution. Chapman and Hall, New York.
Bay, L.K., Choat , J.H ., Herwerden , L. and Robertson, D.R ., 2004. High genetic diversities and complex genetic structure in an Indo-Pacific tropical reef fish (Chlorurus sordidus): evidence of an unstable evolutionary past? Marine Biology, 144, 757-767.
Bernal-Ramirez, J.H., Adcock, G.J., Hauser, L., Carvalho, G.R. and Smith, P.J., 2003. Temporal stability of genetic population structure in the New Zealand snapper, Pagrus auratus and relationship to bicoastal currents. Marine Biology, 142, 567-574. Bowen, B.W. and Avise, J.C. 1990.
Genetic structure of Atlantic and Gulf of Mexico populations of sea bass, menhaden, and sturgeon: influence of zoogeographic factors and life-history patterns. Marine Biology, 107, 371-381.
Bowen, B.W. and Grant, W.S., 1997. Phylogeography of the sardines (Sardinops spp.): assessing biogeographic models and population histories in temperate
1006Rahimi et al., Population genetic structure of the white sardine, Sardinella albella, in the …
upwelling zones. Evolution, 51, 1601-1610.
Bowen, B.W., Bass, A.L., Rocha, L.A., Grant, W.S. and Robertson, D.R., 2001. Phylogeography of the trumpet fishes (Aulostomus): ring species complex on a global scale. Evolution, 55, 1029-1039.
Carlin, J. L., Robertson, D.R. and Bowen, B.W., 2003. Ancient divergences and recent connections in two tropical Atlantic reef fishes Epinephelus adscensionis and Rypticus saponaceous (Percoidei: Serranidae). Marine Biology, 143, 1057-1069.
Chen, C.A., Ablan, M.C.A., MacManus, J.W., Cabanban, A., Bell, J.D., Tuan, V.S., Cabanban, A.S. and Shao, K.T., 2004. Mitochondrial DNA analysis of the genetic structure aiming populations of Hardwicki wrass, Thallasoma hardwicki, in the northern South China Sea. MarineBiotechnology, 6, 312-326.
Cole, j. and Mc Glade, J., 1998. Clupeid population variability, The environment and satellite imagery in costal upwelling. Fish Biology and Fisheries, 8, 445-471.
Dudgeon, C.L., Gust, N., Blair, D., 2000. No apparent genetic basis to demographic differences in scared fishes across continental shelf of the great Barrier Reef. Marine Biology, 137, 1059-1066.
Emara, H.I., 1990. Study on oxygen and phosphate in the waters of the southern Persian Gulf and Gulf of Oman. Acta Adriatica, 31, pp. 45-57.
Excoffier, L., 2004. Patterns of DNA sequence diversity and genetic structure after a range expansion: lessons from the infinite-island model. Molecular Ecology, 13, 853-864.
Excoffier, L. and Lischer, H., 2011. Arlequin ver 3.5: An integrated software package for population genetics data analysis. Evolution Bioinform. Online
FAO, 2010. Workshop on the status of shared fisheries resources in the northern Arabian Sea-Iran (Islamic Republic of),Oman and Pakistan, Muscat, Oman.
Fauvelot, C., Bernardi, G. and Planes, S., 2003. Reductions in the mitochondrial DNA diversity of coral reef fish provide evidence of population bottlenecks resulting from Holocene sea-level change. Evolution, 57, 1571-1583.
Feron P., M.O.A., 1999. Dynamic of pelagic fish distribution and behavior effect if fisheries and stock assessment. U.K. University press, Comridge 348.
Fu, Y.X., 1997. Statistical tests of neutrality of mutations against population growth, hitchhiking and background selection. Genetics, 147, 915-925.
Grant, W.A.S. and Bowen, B.W., 1998. Shallow population’s histories in deep evolutionary line ages of marine fishes: insights from sardines and anchovies and lessons for conservation. Journal of Heredity, 89, 415-426.
Guarnieo, I., Franzellitti, S., Ungaro, N., Tommasini, S., Piccinetti, C.
Iranian Journal of Fisheries Sciences 15(3) 2016 1007
and Tinti, F., 2002. Control region haplotype variation in the central Mediterranean common sole indicates geographical isolation and population structuring in Italian stocks. Journal of Fish Biology, 60, 1459-1474.
Hall, T.A., 1999. BioEdit: a user-friendly biological sequences alignment edit and analysis program for Windows 95/98/NT. Nucleic
Acids Symposium Series, 41, 95-98.
Hewitt, G., 2000. The genetic legacy of the Quaternary ice ages. Nature, 405, 907-913.
Hoffman, E.A., Kolm, N., Berglund, A., Arguello, J.R. and Jones, A.G., 2005. Genetic structure in the coral-reef-associated Banggai cardinal fish, Pterapogon kauderni. Molecular Ecology, 14, 1367-1375. Hunter, J.R., 1983. Aspects of the
dynamics of the residual circulation of the Persian Gulf. Coastal oceanography, M.G. Gade, A. Edward and H. Svendsen, editors. Plenum Press, New York, pp. 31-12. Liu, J.Y., Brown, C.L. and Yang,
T.B., 2009. Population genetic structure and historical demography of grey mullet, Mugil cephalous, along the coast of China, inferred by analysis of the mitochondrial control region. Biochemical Systematics and Ecology, 37, 556-566.
Magoulas, A., Castilho R., Caetano S., Marcato S. and Patarnello T., 2006. Mitochondrial DNA reveals a mosaic pattern of phylogeographical structure in Atlantic and Mediterranean population of anchovy (Engraulis encrasicolus).
Molecular Phyogenetics and
Evolution, 39, 734-746.
Palumbi, S.R., 1994. Genetic divergence, reproductive isolation, and marine speciation. Annual Review of Ecology and Systematics, 25, 547-572.
Parker, P.G., Snow, A.A., Schug, M.D., Booton, G.C. and Fuerst, P.A., 1998. What molecules can tell us about populations: choosing and using a molecular marker? Ecology, 79, 361-382.
Pous, S.P.X. and Carton, P., Lazur, 2004. Hydrology and circulation in the Strait of Hormuz and Gulf of Oman -Results from the GOGP99. Journal of Geophysical Research,
109, c12037.
Rahimi, P., Rezvani, S., Mostafavi, P.G., Jamili Sh. and Rahnema, M., 2013. Study of morphological variation in different populations of white sardines (Clupeidae: Sardinella albella) in the Persian Gulf and Oman Sea. First Iranian Ichthyology Conference. Isfahan University, Iran.
Rand, E.E., 2000. Mitochondrial DNA. Blackwall, Oxford, UK. Ray, N., Currant, M. and Excoffier,
L., 2003. Intra-deme molecular diversity in expanding populations. Molecular Biology and Evolution, 20, 76-86.
Rodriguez, F.J., Garcia-Gasca, S.A., Cruz-Aguero, J. De La. and Costa-Gomes, V.M., 2011. A study of the population structure of the Pacific sardine Sardinops sagax (Jenyns, 1842) in Mexico based on
1008Rahimi et al., Population genetic structure of the white sardine, Sardinella albella, in the …
morphometric and genetic analysis. Fisheries Research, 107, 169-176. Rogers, A. R. and Harpending, H.,
1992. Population growth makes waves in the distribution of pair wise genetic differences. Molecular Biology and Evolution, 9, 552-569. Roldan, M.I., Perrotta, R.G., C0rtey,
M. and Pla, C., 2000. Molecular and morphologic approaches to discrimination of variability patterns in chub mackerel Scomber japonicus. Journal of Experimental Marine Biology and Ecology, 253, 63-74.
Rousset, F., Raymond, M., 1995, Testing heterozygote excess and deficiency, Genetics, 140:1413-1419.
Salarpouri, A., Kamrani, E., Zarshenas, Gh. Davishi, M., Djokar, K., Karim Zadeh, R. and Iran, A., 2003. A study on catch condition of small pelagic fishes (Sardine) in Jask area and its relationship with hydrological parameters. Iranian Fisheries Research Organization (IFRO). Salarpouri, A., Behzadi, S., Darvishi,
M., Momeni, M., Shojaei, M., Daghooghi, B. and Sobhani, A., 2014. Stock assessment of sardine and anchovy in Hormuzgan Province with emphasize on fisheries data. Iranian Fisheries Research Organization (IFRO).
Samonte, I. E., Pagulayan R.C. and Mayer W.E., 2000. Molecular phylogeny of Philippine freshwater Sardines based on mitochondrial DNA analysis. The American genetic Association, 91, 274-253.
Tajima, F., 1989. Statistical method for testing the neutral mutation hypothesis by DNA polymorphism. Genetics, 123, 585-595.
Tamura, K., Peterson, D., Peterson, N., Stecher, G., Nei, M. and Kumar, S., 2011. MEGA5: Molecular evolutionary genetics analysis using maximum likelihood, evolutionary distance, and maximum parsimony methods. Molecular Biology and Evolution, 28 (10), 2731-2739
Tudela, S., Garcya - Marynn, J.L. and Pla, C., 1999. Genetic structure of the European anchovy, Engraulis encrasicolus, in the north-west Mediterranean. Journal of Experimental Marine Biology and Ecology, 234, 95-109.
Van Zaling, N.P., Owfi, F., Ghasemi, S., Khorshidian, K. and Niamaimandi, N., 1993. Resources of small pelagic in Iranian Waters, a review. FAO/ UNDP Fisheries Development Project ir/ 83/013, 370P.
Vaughan, D.S., Huntsman, G.R., Manooch, C.S., Rohde, F.C. and Ulrich, G.F., 1992. Population’s characteristics of the red porgy, Pagrus pagrus, stock off the Carolinas. Bulletin of Marine Science, 50, 1-20.
Ward, R.D., Woodwark, M. and Skibinski, D.O.F., 1994. A comparison of genetic diversity levels in marine, freshwater and anadromous fishes. Journal of Fish Biology, 44, 213-232.