Issues
ISSN: 2146-4138
available at http: www.econjournals.com
International Journal of Economics and Financial Issues, 2016, 6(S2) 110-116.
Special Issue for “State and Municipal Regulation, Investment, Commerce: National and International Aspects of the Business”
Social Protection of the Poverty: Problems and Solutions
Nursafa Gafurovna Khairullina
1*, Oksana Vyacheslavovna Ustinova
2,
Haida Nurgalievna Sadykova
3, Oksana Vladimirovna Tretyakova
4, Juliya Zufarovna Bogdanova
51Industrial University of Tyumen, 38, Volodarskogo Street, 625000 Tyumen, Russia, 2Industrial University of Tyumen, 38,
Volodarskogo Street, 625000 Tyumen, Russia, 3Industrial University of Tyumen, 38, Volodarskogo Street, 625000 Tyumen, Russia, 4Tyumen State University, 10, Semakova Street, 625003 Tyumen, Russia, 5State Northern Trans-Urals Agrarian University, 7,
Respubliki Street, 625003 Tyumen, Russia. *Email: nursafa@inbox.ru
ABSTRACT
The term “social protection of people” is now increasing its popularity both internationally as well as on the national level. This is due to the fact that the transformation processes in the economy and social structure has led to an increase in the number of people needing social protection and support from the state. Today a significant part of Russia’s population is below the poverty line. Despite a steady reduction in the number of people with incomes below the subsistence minimum in Russia in general in most regions this indicator remains high. Socially vulnerable layers of the population such as disabled, pensioners, large families, etc. happened to be in particularly difficult conditions. Therefore, the main goal of social protection is to make away with much of the poor population and sometimes miserable existence of the population in an environment where average per capita family income was lower than the level of satisfaction of basic physiological needs. The article presents the results of the survey which diagnosticate the problem and reduce the effectiveness of the social protection system as well as offers the latest trends optimization.
Keywords: Social Protection of People, Social Work, Socially Vulnerable Groups
JEL Classifications: I30, D14, I38
1. INTRODUCTION
Over the past decade Russia has undergone substantial economic changes that have affected virtually all aspects of our society, including the social protection system (Gaisina et al., 2015). However, many social problems (unemployment, poverty, etc.) are not only outstanding but also greatly exacerbated in times of economic crisis (Sadykova et al., 2015). Attempts to “restore” the system of social protection of the population ongoing at present, unfortunately are not as effective as required by the social transformation processes. New approaches and mechanisms are enable to improve the efficiency of state social support for socially vulnerable population (Ustinova, 2014; Vaulina and Osipova, 2014).
The term “social protection” appeared in the social and legal practice of the Russian Federation in the early 1990s. The adoption
of the presidential decree of December 26, 1991 No. 328 “On additional measures for social support of the population in 1992” helped to establish the regional funds of social support of the population, whose funds were spent on the social protection of the population in rendering a material assistance to the destitute people (people, having an average per capita income below the subsistence level), the improvement of social services, etc. Social funds were considered as additional (reserve) sources of subsidization for social protection.
Today the scientific literature presented numerous approaches to the definition of “social protection”:
protection and administration, other benefits (Kurshakova, 2013)
2. Social safety come down to assist and is identified with the term “social assistance”; social support is activities aimed at enhancing their own power and possibilities of the person or group to change their financial and property status (Skinner, 2010; Kozer, 1994)
3. Social protection is seen as immaterial, information resource (job search assistance, employment, occupation, education, finding ways to overcome the current difficult situation, etc.) (Khairullina and Saifullin, 2013)
4. Social protection is identified with the concept of “social/ material support” and “social assistance.” This is due to the fact that social protection can take many forms, both corporeal (similar to the software) and natural (similar to the assistance), as well as incorporeal (Efimova, 2014).
In the context of reforming the social security system it is particularly important to study the relationship of socially vulnerable groups to ongoing innovation. In this context relevant sociological support reforms, firstly, allows greater account of the needs, expectations, mood, state of health of the population in need of social protection, as well as their response to the changes. And, secondly, the important fact is that any reform affects the subjective interests of large segments of the population, both in terms of going beyond the “familiarity” and the negative reaction to the problematic situations that inevitably arise in the implementation of any kind of changes (Yadov, 1995).
2. METHODS
In order to analyze the effectiveness of social protection of the poor, Tyumen authors in September-November 2015 conducted a sociological study. Totally 314 people were surveyed whose per capita income at the time the survey was below the subsistence minimum wage level in the region. The objectives of the study were defined such as:
• Identification of social well-being of the poor residents of Tyumen;
• Analysis of the main needs and expectations and assessments of the poor related to the current status and trends in the field of social protection.
Of the total sample of respondents 47.9% are male, 52.1% female. The age of the surveyed in percents: From 18 to 30 years 15.3%; from 31 to 50 years 34.5%; from 51 to 65 years 30.8%; over 65 years 19.4%.
Pensioners accounted for 38.7% of the total number of respondents, people with disabilities 16.7%, low-income families 44.6%.
3. RESULTS
70.4% of respondents have privileges (Table 1). They make up a large share of pensioners and disabled people (83.1 and 92.9%, respectively).
The vast majority of respondents have experience in approach to the establishments of social services (Table 2). However, this experience has almost all representatives of the indigent (Table 3).
Social service agencies are engaged in the decision of a wide range of issues related to the distribution and provision of social benefits to categories of the population in need, including poor citizens. Survey participants’ needs and related treatment in social service agencies are listed in Table 4.
Almost two thirds of respondents appeal to social service agencies in connection with the problem of calculation and payment of pensions, allowances and compensations (68.1%). Next in importance are the applications regarding registration for sanatorium treatment or relaxing in the day patient facility (18.9%). The following are registration of disability (10.1%), advice on legal questions concerning the privileges and compensations (9.3%), issues related to the application for benefits for children or the organization of their leisure and recreation (8.9%), obtaining natural assistance - food packages, coupons for meals, clothing, gift sets, and so forth, - 8.1%, receiving psychological assistance (5.6%). Applications on other issues are in small proportions.
Of course, when you contact people in the public service, especially when it comes to social assistance to those in need, the result is important, which is manifested not only in the quality of services, but also the process of care (Table 5).
According to the Table 5 we can see that the bulk of the requests and claims of citizens resonates in the services of social protection.
Table 1: Distribution of answers to the question about the use of social privileges
Possible
answer Total Categories of the poor population of Tyumen Pensioners Disabled
people Low-income families
Use 70.44 83.08 92.86 55.32
Don’t use 29.56 16.92 7.14 44.68
Table 2: Experience of circulation of respondents in the establishment of social services, %
Possible
answer Total Categories of the poor population of Tyumen Pensioners Disabled
people Low-income families
Applied 95.44 96.41 98.81 95.74
Didn’t apply 4.56 3.59 1.19 4.26
Table 3: Frequency of respondents’ appeal in the institutions of social services, %
Possible answer Total Categories of the poor population Pensioners Disabled
people Low-income families
Apply usually or
appealed more than once 59.73 64.10 73.81 53.72
Applied once or twice 37.50 35.38 25.00 43.62
Table 4: The subject of references of respondents in social service agencies, %
Possible answer Total Categories of the poor population Pensioners Disabled
people Low-income families
Questions of calculation and payment of pensions, allowances, compensations 68.06 67.18 25.99 75.00
Reception of in-kind aids (food packages, food coupons, clothing, gift sets, etc.) 8.13 10.77 8.33 31.71
The provision of home-based services by a social worker or a nurse 2.78 15.38 10.71 4.79
Registration of vouchers for sanatorium treatment, rest in day stay 18.85 26.15 23.81 10.11
Execution of the contract of social patronage 1.39 1.54 1.19 1.60
Foster care, custodial care, adoption 0.99 2.05 - 0.53
Enrollment of the child in a summer camp, group of day care, children’s circle
at the center of social service 8.93 5.13 7.14 14.89
Registration of disability 10.12 7.18 34.52 3.72
Enrollment of a disabled child in a children’s rehabilitation center 2.58 0.51 7.14 2.66
Specialists legal advice 9.33 12.31 9.52 6.38
Psychological care (for themselves or one’s closest people) 5.56 6.15 2.38 7.45
Other 0.40 0.51 -
-Table 5: Evaluation of the assistance provided by the social service of the population, %
Possible answer Total Categories of the poor population
Pensioners Disabled people Low-income families
Assistance was provided fully 72.4 71.2 78.6 72.3
Assistance was provided partly 21.2 22.0 19.1 22.9
There was an attempt to assist, but in the end were able to help 2.0 3.0 1.2 1.1
Refused to help at all 1.0 2.0 - 0.5
Other 3.4 1.5 1.2 3.2
Table 6: Evaluation of respondents opinion about attitude of employees of social services to the citizens who applied for support, %
Possible answer Total Categories of the poor population Pensioners Disabled
people Low-income families
Attentively 90.7 94.3 92.9 88.3
Indifferently 5.6 4.6 3.6 7.5 Employees were
speaking in a gross
manner and remained
a negative impressions
0.8 0.5 - 1.6
Other 3.0 0.5 3.6 2.7
More than two thirds of respondents (72.4%) indicated that they had received assistance entirety. Another 21.2% reported that at least partially but the aid has been received. Only 1.0% of respondents indicated directly that they were denied help. An important point in this case is whether it was related to the reluctance of officers of social services to provide it, or the request was not feasible (the same can be said about the partial assistance provided).
Results of responses to the stated question show that in general that it can be evaluated as positive (Table 6).
Analyzing the data in Table 6, the authors noted the following. The vast majority of respondents (90.7%) indicated that they were treated with due share of attention. But noting the good in every measure we also note that the 100% mark is not still received. More than 5% of the respondents noted the indifference of staff, another 0.8% acknowledged gross treatment. Of course, a separate issue
is the reasons for such situations may be different and. moreover, provoked by visitors themselves. However, such esteem may occur due to the refusal of requests and petitions that do not have a real reason for. However, it is possible to speak not only of a problem but also about a precedent that cannot be left unattended.
On the question, what problems come more often to low-income residents while visiting the institutions of social services, the answers were divided in a certain way (Table 7).
Table 7 shows that in the first place by far is the problem of papers and documents that need to be collected to solution of a problem of any difficulty level. In particular, it pointed out more than half of the respondents (57.7%).
Respondents also noted that the establishments of social services are overwhelmed and they have to stand in line (32.7%). Another 13.7% of the participants expressly stated that the main problem citizens faced when applying to institutions of social protection is a kind of “defects” in government policy in this area. That is that this group of respondents does not tend to associate the problems and shortcomings with the actual activity in the sphere of social protection at the municipal level. Finally, other reason is defined as the high level of bureaucracy (5.8%).
to the confusion taking place in the social protection services; 1.8% complained about the lack of competence of employees; 1.6% said that they were treated rudely.
Perception of problems by representatives of the various groups of poor people does not specially differ. However, the families of low-income are more critical to the institutions of social services. They showed disapproval towards workflow system, bureaucracy, queues, and employees’ behavior.
Pensioners took tolerant position related to almost all issues of the institutions of social services. This is explained among other things by their comparative experience of social protection carried out in the country in previous years. Many of them as representatives of their generation were inclined to see the cause and nature of the problem in a global context and in government policy as a whole. However, disabled were even more “tolerant” group.
It is also of interest to estimate the role of social protection in the formation of social well-being of the population (Table 8).
Analyzing the data in Table 8 attention is drawn to the fact that the majority of respondents (67.1%) appreciate the role of social protection in the formation of social well-being of the population as high as possible. Significantly fewer respondents recognized the insignificance of this role, but at the same time they don’t deny the existence of the role (13.4%). And only 1.8% of the participants came to a complete denial of communication activities of social protection and social well-being of the population.
A look at the respondents’ views through the prism of their age characteristics allows to itemize the following points. The older the respondents assessing the role of social protection as an important factor of health of the population of different age categories subject to the understandable logic, the more they tend to associate these two factors (according to research 59.2% of respondents estimate it as essential role between the ages of 18 to 30, 66.1% of age 31 to 50, 65.8% of age 51 to 65 and 76.5% of age 65).
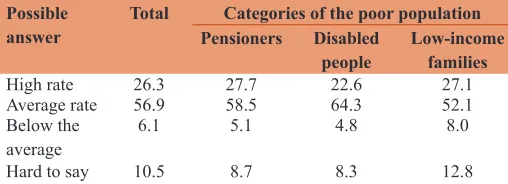
Among other indicators, the evaluation of the level of social work in the areas where participants of the study live is also interesting (Table 9).
The majority of respondents assessed the level of social work as average (56.9%). Thus, assessment of representatives of
the main categories of respondents which are pensioners, disabled and families with low incomes are not fundamentally different.
Level of evaluation of social work is not the highest but it is compensated by the results of answers to the question: “Do you trust the staff of social services?” (Table 10).
From Table 10 the absolute majority of respondents expressed
that the staff of social services of the city is of a high degree of confidence (76.0%) while categorical discredit is 9.5%. The respondents’ assessment of the support provided by social services was more problematic (Table 11).
From Table 11, only 18.1% of respondents indicated that the
assistance they receive is constant and sufficient; 31.9% of respondents recognized it enough but periodic; 23.0% periodic and insufficient. Finally, 8.7% of respondents cited a lack of help and support.
Help and support from the social services, however, is evaluated differently by different categories of participants of the study. Disabled turned out more satisfied. Among them the highest Table 7: The problems that respondents faced by when they applying to institutions of social protection, %
Possible answer Total Categories of the poor population
Pensioners Disabled people Low-income families
Inattention, indifference of staff 5.8 4.6 3.6 6.9
Rudeness 1.6 2.1 - 2.1
Congestion in institutions of social protection, long-term waiting 32.7 32.3 31.0 35.6
High levels of bureaucracy 5.8 4.6 4.8 6.9
The need to collect a large number of papers, documents 57.74 58.5 54.8 60.1
Confusion 5.0 5.6 4.8 5.3
Low professional level of employees 1.8 1.5 3.6 1.6
Legal “gaps” in the field of social protection 13.7 15.4 20.2 9.0
Other - - -
-Table 8: Assessing the role of social protection in the formation of social well-being of the population, %
Possible
answer Total PensionersCategories of the poor populationDisabled people Low-income families
Important 67.1 68.7 66.7 67.6
Not much
significant 13.5 13.9 16.7 11.2
Not significant 1.8 1.0 1.2 3.2
Hard to say 17.7 16.4 15.5 18.1
Table 9: Respondents’ evaluation of the level of social work, %
Possible
answer Total PensionersCategories of the poor populationDisabled people Low-income families
High rate 26.3 27.7 22.6 27.1
Average rate 56.9 58.5 64.3 52.1
Below the
average 6.1 5.1 4.8 8.0
number indicated that the help and support given to them is constant and sufficient (31.0%), the lowest number referred to the lack of assistance (2.4%) in the absence of the respondents who believe that they receive non-recurrent and insufficient support. In turn, members of families with low income proved to be the most critically-minded. Among them the lowest percentage believes that they support is periodic but insufficient (15.7%) and the highest believes that support is non-recurrent and insufficient (respectively, 7.5% and 13.8%). Pensioners occupied an intermediate position.
Among other issues the problem of the poors’ awareness of the implemented measures in the municipality under the social welfare is of some interest. These studies have shown that in this regard the situation is not the best (Table 12).
As it turned out, only one-fifth of respondents (20.6%) indicated availability of more or less comparable information on the measures implemented in the field of social protection. Half of the respondents (50.4%) indicated that only heard about it but do not have accurate information. A significant number of survey participants do not know the full information about ongoing social activities. If this category included respondents who had issues answering this question then their number will be 29.0%.
Distribution of answers depending on the category of the poor can be inferred by bigger awareness of the issue of people with disabilities and members of low-income families.
Much greater awareness was manifested by respondents in the matter of activities of relevant non-governmental organizations (Table 13). It is close to the awareness level of 50%.
Interesting is the fact that participants of the study support the monopoly of the state in carrying out the functions of social work (Table 14).
From Table 14, the possibility of attracting the corresponding activity of private companies and public organizations was expressed only by 14.3% of respondents, while 46.0% of respondents indicated the unacceptability of such option. At the same time a high percentage of respondents found it difficult to express this by a certain opinion (39.7%). Among the major categories of participants the family members of low-income turned out to be the most loyal of the issue and pensioners are the least loyal.
Assessment of what changed in the lives of poor people living in Tyumen over the past year is not very optimistic (Table 15).
These answers to the question about the changes over the past year have shown the prevalence of negative assessments of the nature. Among other things the essential basis for evaluating the effectiveness of the social protection system is the evaluation of the respondents as personal effort in a device of one’s own life and achieving the necessary level of personal and family well-being (Table 16).
While analyzing the data in Table 16 it can be assumed that the participants in the study do not lead sedentary behavior. Thus, the vast majority of them (80.4%) directly or partially connect their activity with improving their own lives, and half of the respondents believe that this connection is complex (51.4%).
Meantime, a significant part of the respondents said that the security to some extent depends on personal effort. It turns out that most of the respondents value their possibilities optimistically, including obviously terms of employment and work.
Based on these results we can definitely say that a significant part of the lives of socially vulnerable population will be less reliable on the social policy of the state.
Table 10: The problem of trust to the leadership of social services in the places of residence, %
Possible
answer Total PensionersCategories of the poor populationDisabled people Low-income families
Trust 76.0 76.4 81.0 72.9
Don’t trust 9.5 12.8 4.8 8.0
Hard to say 14.5 10.8 14.3 19.1
Table 11: Evaluation by the respondents of assistance and support for social services, %
Possible answer Total Categories of the poor population
Pensioners Disabled people Low-income families
Support is constant and sufficient 18.11 16.9 31.0 16.0
Support is periodic but sufficient 31.9 36.9 32.1 27.7
Support is periodic but insufficient 23.0 26.7 23.8 22.9
Support is non-recurrent and insufficient 6.6 6.7 - 7.5
There is no support 8.7 4.1 2.4 13.8
Hard to say 11.7 8.7 10.7 12.2
Table 12: Awareness of respondents about social protection measures implemented in Tyumen, %
Possible answer Total Categories of the poor population of Tyumen region Pensioners Disabled people Low-income families
Have complete and timely information 20.6 18.5 20.2 21.3
Heard that there are some, but do not know exactly 50.4 52.3 52.4 50.0
Heard nothing about it 9.5 10.3 13.1 7.5
4. DISCUSSION
Analysis of the results of a sociological survey has allowed the authors to draw the following conclusions.
As it turned out, the poor citizens of Tyumen has a relatively high level of evaluation of the current system of social protection in the formation of social well-being of the population. It was found that the majority of applications in social security authorities seek to solve the material and everyday problems. Here we can reasonably argue that the vast majority of applications are not ignored that, ultimately, is the cause of a sufficiently high level of public
satisfaction with the work of social service (three-quarters of the respondents indicated that their issues have been solved fully).
The system of social services and its benefits are accessible for the population in need of social support from the state. More problematic aspects of the organization of work with the poor are the complexity of the document, the congestion in social institutions leading to long waiting in queues in a mess. In other words one way or another but the question of implementation of customer-oriented technologies in the current environment is becoming more relevant. Belly-aches are voiced directly to the social security authorities and their staff and the lack of professionalism of some of them. Also the facts of inattention, indifference and rudeness even in a small amount (this is indicated by 5.8-1.8% of the participants) is unacceptable. This is another aspect of management activities of social protection in the city of Tyumen.
Appraisal score of the level of social security is sufficiently positive. Moreover, it is of the average values. However, a major factor is the high degree of confidence in the staff of local social protection. With a total positivity on the whole with regard to assistance and support almost one-third of the survey participants acknowledged its failure and 8.8% - its absence. At the same time, nearly 80% of the number of surveyed noticed its importance for their own life sustaining activity.
It is obvious that another circumstance significantly affects the mood and feeling of social need of the population. It is the level of awareness of the implemented measures of social support of the population in the studied municipal education. In this matter only one-fifth of respondents proved fully competent. Thus, another problem that needs treatment is determined.
The level of awareness about the activities of relevant public and non-profit organizations does not exceed 50%. It is obvious that the lack of such information leads to underestimation of their real possibilities. Meanwhile, in the world and also in our country there is a great and positive practice of the non-profit sector in the implementation of the tasks of social services.
5. CONCLUSION
Results of the study revealed a problem that can be solved with the implementation of certain areas to optimize the social protection system.
In order to strengthen and develop the resource base of the industry it is required:
• To improve the system of training, focusing on innovative transformation;
• To improve the system of motivation of staff of social services, including through a system of performance criteria, increasing the efficiency of social technologies;
• Implement in the social protection system private sector; • Actively promote inter-sectoral cooperation, volunteerism
and charity. Table 13: Awareness of respondents about the activities
of public services and organizations dealing with social issues, %
Possible answer Total Categories of the poor population Pensioners Disabled
people Low-income families
Informed 46.2 44.1 50.0 46.3
Heard about this
kind of organizations but don’t know then
34.7 36.9 29.8 35.6
Know nothing about
them 19.1 19.0 20.2 18.1
Table 14: Evaluation by the respondents of the possibility
of delegating powers of state social workers, private firms
and public organizations, %
Possible answer Total Categories of the poor population Pensioners Disabled
people Low-income families
Supports the possibility
of delegating powers 14.3 10.8 13.1 18.6
Disagree with the
delegation of authority 46.0 51.3 50.0 36.7
Hard to say 39.7 38.0 36.9 44.7
Table 15: Evaluation of changes by respondents over the past year, %
Possible answer Total Categories of the poor population Pensioners Disabled
people Low-income families
Life has become better 17.06 17.44 16.67 17.02
Life has not changed 49.21 51.28 38.10 51.60
Life has become worse 18.25 20.51 22.62 15.43
Do not think about it 15.48 10.77 22.62 15.96
Table 16: The dependence of the well-being of the personal efforts of the poor, %
Possible
answer Total PensionersCategories of the poor populationDisabled people Low-income families
Yes 51.4 45.6 42.9 60.6
At some extent 29.0 31.8 33.3 24.5
No 10.5 14.9 6.0 8.0
In order to improve implementation of the functions of the state in the sphere of social protection it is necessary:
• To improve the system of budgeting industry, make it result-oriented;
• To actively implement in the activities of social services public contracts;
• To improve the regulatory framework and institutional structure of the industry.
It is necessary to improve the social service work to the population especially:
• To actively implement customer-oriented technologies; • To improve public awareness about the social programs and
activities;
• To continuously monitor the social well-being of residents.
REFERENCES
Efimova, I.N. (2014), Social Protection and Social and Labor Warranties on the System of Social and Labor Activity. Available from: http:// www.rusnauka.com/TIP/All/psyhology/12.html.
Gaisina, L.M., Gareev, Z.S., Valitova, N.E., Khairullina, N.G., Ustinova, O.V. (2015), The role of the media in the spiritual and
moral evolution of society. Mediterranean Journal of Social Sciences, 6(5), 2-9.
Khairullina, N.G., Saifullin F.F. (2014), The problem of identification in mixed families. Life Science Journal, 11(8), 364-367.
Kozer, L. (1994), Completion of the Conflict, American Sociological Thought: Texts, Under the Editorship of V. I. Dobrenkov. Moscow: Publishing House of MSU.
Kurshakova, N.B. (2013), Social Management. St. Petersburg: Peter. Sadykova, H.N., Khairullina, N.G., Ustinova, O.V., Pelkova, S.V.,
Efremova, T.M. (2015), Socio-cultural code as a factor of unity and variability of generations. International Journal of Economics and Financial Issues, 5, 313-319.
Skinner, K.K. (2010), Social Management. Moscow: Grevtsov Publisher. Ustinova, O.V. (2014), An investigation into the motives behind the
reproductive conduct of the Ural federal district Scopus. World Applied Sciences Journal, 31(5), 910-914.
Vaulina, Е.А., Osipova, L.L. (2014), Poverty as a global problem of modern Russia. In the Book: Problems of formation of a common space of economic and social development of the countries of the CIS. In: Burlakov, O.M., editor. Proceedings of the Annual International Scientific-Practical Conference. p426-432.