Issues
ISSN: 2146-4138
available at http: www.econjournals.com
International Journal of Economics and Financial Issues, 2017, 7(3), 69-81.
Measuring the Nonmonetary Component of General Value for
Goods and Services
Sergey K. Aityan
1*, Alexey K. Ivanov-Schitz
2, Eugenia Logunova
21Lincoln University, Oakland, CA, USA, 2Moscow Institute of International Relations, Moscow, Russia, *Email: [email protected]
ABSTRACT
The recently introduced theory of general value addresses two distinct components of value: Monetary and nonmonetary. The introduction of the nonmonetary component of value helps explain many types of decisions and choices, which were not clearly understood before, and helps with the strategic planning and actions. This paper introduces a methodology of measuring nonmonetary value of goods and services in the perception of people. The indifference point between two choices is used to measure the difference of nonmonetary components in terms of the difference of the monetary components with the opposite sign. This method was used to measure relative nonmonetary values (the difference of the monetary components) of various goods and services in the perception of different social groups.
Keywords: Value, Nonmonetary, Utility, Preference, Behavioral Economics, Decision-making, Personal Choice
JEL Classifications: A130, D01, D03
1. INTRODUCTION
People make decisions by assessing values and choosing scenarios that offer the best values. Money is an important factor in the decision-making process. However, most decisions are made with some additional considerations in mind that bring value assessment beyond just the assessment of the amount of money. For instance, price is not the only parameter that impacts on the decision on buying a product or a service. The need for the product or the service, brand name, fashion, public opinion and many other factors are also contributing to the buying decision.
The concept of value has always been one of the major focus points in the economic theories since the inception of economics as a discipline. Value relates to such categories as price, demand, utility, usability, assessment, choice, decision-making, and many others. It is important to distinguish value form price. The same price for a good or service may be charged to different consumers but they may see quite different value in the same good or service. Air, for instance, is normally available free of charge but its value for everybody is extremely high. This controversy is known as paradox of value.
The notion of value has been evolving over time, engaging different approaches from the labor theory of value in classical economics through utility theory in neoclassical economics to a mostly psychological approach in behavioral economics.
The variety of the theories of value can be divided into two major categories:
• Intrinsic or objective theories • Subjective theories.
1.1. Objective Theories: Classical Economics
Intrinsic theories attempt to define value objectively with human perception taken out of picture. These theories are based on classical economics that defines value as labor involved in the production of goods or rendering services (Smith, 1776; Ricardo, 1817). Labor value measures the quantity of labor put in the product. Marx1 (1867) divided value into two categories, use value and exchange value, use value represents the utility of a product or a service or the need for the product or service.
Exchange value measures the ability of products or services to exchange in certain proportions and hence represents price. According to the precepts of classical and Marxian economics, use value is impossible to measure and therefore, the only measurable is exchange value that is measured by the labor involved in the production of a good of rendering a service. Adam Smith (1776) wrote, - “it was not by gold or by silver, but by labor, that all the wealth of the world was originally purchased; and its value, to those who possess it, and who want to exchange it for some new productions, is precisely equal to the quantity of labor which it can enable them to purchase or command.” Thus classical economics did not address the relationship between the use value and exchange value and stayed on the purely objective grounds of labor theory of value.
Money in economics may play a similar role as energy in physics. (Ksenzhek, 2007; Aityan, 2011). This paper extends the analogy between general value in economics and energy in physics.
1.2. Subjective Theories: Neoclassical Economics
Marginalism laid foundations for neoclassical economics in the late 19th century. Gossen (1854), a Prussian economist, was the first who introduced a general approach to marginal utility though many other economists by that time had already elaborated on various specific aspects of value in terms of human perception.
Subjective theories originated from Marginalism were independently developed by Gossen (1854), Jevons in 1879 (Jevons, 2010), Menger in 1871 (Menger, 2007), and Walras in 1874 and 1877 (Walras, 2010) in the second part of the 19th century. Subjective theories define value in terms of human perception of satisfaction with goods or services and limitations in their supply. Menger argued that value is essentially subjective. The concept of utility as a measure of satisfaction was introduced in neoclassical economics to measure value, thus replacing the objective concept of value in classical economics with the purely subjective approach. It is important to emphasize that by replacing the labor approach in the definition of value in classical economics with the perceptional approach in neoclassical economics has denoted a fundamental shift in the view on value from producers to consumers.
Marginalism suggests that value of a good or a service is determined by an additional satisfaction (marginal utility) from the most recently added unit of the good or service. The more quantity of something you have, the less quantity of something else you would be willing to give up for one additional unit of it. This law is referred to as a law of diminishing marginal utility. Thus value represents the most recent rate of exchange. The concept of marginal utility and the law of diminishing marginal utility can be easily illustrated with a diamond-water paradox which was first introduced in 1880s. Water under normal circumstances has a much higher practical utility for a human, than diamonds, but diamonds have a higher value because marginal utility of diamonds is much higher than a marginal utility of water (Rhoads, 2007). However, value of water in case of water shortage may significantly exceed the value of diamonds in terms of marginal utility because humans cannot survive without water.
The principles of neoclassical economics have become the major platform for majority of economic theories of the twentieth century. The major criticism of neoclassical approach in economics relates to the presumption of the exclusively rational behavior of market participants. A comprehensive review of neoclassical economics and its view on the concept of value is widely available in the literature (Kahn, 1979; McKenzie and Tullock, 1981; Pollis and Koslin, 1962).
The next step in the development of neoclassical concepts in economics was related to Marshall (1890), a British economist, who developed the well-known supply and demand chart, that forms market equilibrium and establishes the relationship between quantity and price in regards to supply and demand. However, Marshall did not distinguish between price and value and presumed, that all market participants possess full information about the related market conditions.
Samuelson and Nordhaus (2004) wrote, - “…but you should definitively resist the idea that utility is a psychological function or feeling that can be observed or measured. Rather, utility is a scientific construct that economists use to understand how rational consumers divide their limited resources among commodities that provide them with satisfaction.”
Let’s apply the neoclassical concept of value to employment, compensation, and the impact of non-financial factors on job selection decisions. There are many other factors beyond financial compensation that impact the job selection decisions such as job prestige, professional challenges, work environment, proximity to the residence. These factors contribute to the value of the job in the perception of an employee or a job candidate. It is evident, that less prestigious jobs should offer a higher financial compensation to equalize the value of the job in the perception of employees or job candidates. This issue was addressed in the theory of equalizing differences (Brown, 1980; Rosen, 1983). The theory attempted to explain why employees in similar positions receive different compensations in different geographic locations. The results of this analysis showed that employees receive additional compensation for adverse work conditions. However Rosen made a simplifying assumption about the uniformity of individual preferences that ignores the fact that employees may prefer different activities under all equal conditions. Challenges of heterogeneous models of human capital have been recently addressed in the literature (Blackaby and Murphy, 1995; Han and Yamaguchi, 2015).
Becker (1968) tried to apply the neoclassical utility approach to the analysis of criminal behavior. However, the model assumed rational behavior of criminals though most of the time rational factors do not play a decisive role.
1.3. Subjective Theories: Behavioral Economics
decisions and act. Humans in their decision-making, mostly rely on habits, customs, beliefs, advices, or even on mimicking or imitating others rather than on shear rationality. This issue has been brought up for discussion by many authors for a long time. Simon (1955, 1972) addressed the concept of bounded rationality of market participants. Kahneman and Tversky (1979) conducted an extensive analysis of human decision-making under risk and showed that the decisions were different from rationally induced. Finally, a new direction in the economics was formed by closely tying up economics with human psychology and behavioral patterns (Simon, 1972; Kahneman and Tversky, 1979; 2000; Kahneman et al., 1982). This direction in economics is referred to as behavioral economics. According to this approach, human psychology and behavioral patterns play the major role in making judgments, choices, and decisions.
2. A MISSING LINK TO A NONMONETARY
COMPONENT OF VALUE
Typically, fiat money, have none or a very low commodity value, but is commonly accepted only because of the explicit or implicit common perception of money as value. However there are other values beyond money, which are of the nonmonetary nature and represent the subjective perception specific to an individual, a community, or a country, a culture, or to the entire mankind. Such nonmonetary values are completely subjective and contribute to the decision on action or transaction in addition to the monetary values. The notion of utility, introduced in neoclassical economics to account for individual perception of value, does not separate the monetary and the nonmonetary parts of value and for this reason falls short of describing the perception of nonmonetary values (Schulak and Unterköfler, 2011; Skousen, 2005; Gale and Swire, 2006).
The approach of compensating variations was introduced by Hicks (1939) as a measure of utility change in terms of additional money, an individual should be compensated for a change in price or product quality to keep the same level of satisfaction. With this approach, consumer’s surplus can be used as a welfare measure (Chipman and Moore, 1980). The theory of hedonic prices (Rosen, 1974) addresses the spatial equilibrium for differentiated product in which the entire set of implicit prices guides both consumers and producers locational decisions in characteristics space. This theory utilizes the hedonic hypothesis that goods are valued for their utility-bearing attributes or characteristics on the bases of the theory of equalizing differences. The theory of compensating variations has addressed the changes in utility with price, but still was confined within the concept of monetary utility.
The theory of equalizing differences (Brown, 1980; Rosen, 1983) made a step towards a separation of monetary and nonmonetary perception in labor market stated that “workers receive compensating wage premiums when they accept jobs with undesirable nonwage characteristics, holding the worker’s characteristics constant” (Brown, 1980). Despite its attempt to separate monetary and nonmonetary perception, the theory of equalizing differences could not go beyond the labor market due to its conceptual limitations.
The principles of behavioral economics are based on human “bounded rationality” (Kahneman and Tversky, 1979; 2000; Kahneman et al., 1982; Kahneman, 2011; Simon, 1955; 1972). Behavioral economics has implicitly addressed nonmonetary values by engaging subjective rules of thumb, beliefs, and hopes as major driving forces in economic decisions but still kept it closely tied up with the monetary values.
Thus the mainstream directions of the economic ideas related to the concept of value have shown a clear trend towards incorporating subjective and nonmonetary aspects in the definition of value. However all economic theories up to quite recent time now were unclear about the relationship between the monetary and nonmonetary aspects of value. A new approach that addresses the concept of value was recently proposed by Aityan (2013). This theory, which is referred to as the theory of general value, explicitly distinguishes monetary and nonmonetary components of value. This approach is helpful in solving many challenges related to the concept of value by analyzing separately its monetary and nonmonetary components.
The purpose of this paper is to develop a practical methodology of measuring nonmonetary component of general value for the purpose of applying it to the assessment of decision-making processes in economics.
3. THE THEORY OF GENERAL VALUE
3.1. Definition of General Value
The recently introduced notion of general value (Aityan, 2013) presents value as a linear composition of the monetary and nonmonetary components of value, i.e.
V=VM+VN (1)
where V is general value, VM and VN are the monetary and nonmonetary components of value respectively. Both, monetary and nonmonetary components of value may, include various sub-components. For the sake of simplicity, we will often refer to general value simply as value.
Monetary value can be measured in monetary units of perception of money, i.e. utility of money, or just in the amounts of money. It is important to note that due to linear relationship between the monetary and nonmonetary components of value presented in Eq. (1), these two components should be measured in the same units. However this fact does not mean that these two components are identical by their nature.
3.2. Principle of Increasing General Value
An individual decides to pursue with an action if the general value after the action, VAfter, is greater than the general value before the action, VBefore, i.e.
VAfter>VBefore (2)
ΔV=VAfter−VBefore>0 (3)
Decisions on choices between two products or services are made in a similar way. For example, product A is preferred to product B if;
VA>VB (4)
or
ΔVAB=VA−VB>0 (5)
The difference of general values, ΔVAB, in Eq. (5) represents an increment of general value of product A versus product B. It is important to point out that in the decision-making process, individuals assess the difference of general values rather than the absolute values associated with the choices. We will refer to possible choices as scenarios. This notion is similar to the concept of ordinal utility in neoclassical economics. People choose scenarios with a higher general value.
3.3. The Indifference Point
The monetary component of general value can be measured in terms of perception of the related amount of money similarly to as it has been done in terms of utility of money in neoclassical economics (Menger, 1871) or in terms of value function in behavioral economics (Kahneman and Tversky, 1979). For simplicity, the monetary component can be measured simply as the amount of money. However, it is important to figure out how to measure the nonmonetary components of general value. Let’s note that the choice between A and B is made based on the difference of their general values as it was mentioned above. We suggest measuring the differences of nonmonetary values in the point of indifference, i.e. when the difference of general values equals zero. The point of indifference means that a given individual does not have any preference, i.e.
VAM+VAN=VBM+VBN (6)
whereVAM and VAN are monetary and nonmonetary components
of general value for scenario A and VBM and VBN are monetary
and nonmonetary components of general value for scenario B in the perception of the individual.
According to Eq. (6), the difference of general values at the point of indifference equals zero, i.e.
M N
AB AB AB
V = V + V =0
∆ ∆ ∆ (7)
or
∆VABN =−∆VABM (8)
where M AB
V
∆ and N AB
V
∆ are the differences of monetary and nonmonetary components of general values for two scenarios A and B, i.e.
∆VABM = V∆ AM−∆VBM and ∆VABN = V∆ AN−∆VBN (9)
Eq. (9) means that the individual is indifferent of gaining some nonmonetary value for giving up the equal monetary value or
vice versa.
3.4. General Value versus Utility
Both, general value and utility, address individual perception of the consumption or usage of money, goods, or services. However, there is a fundamental difference between these two concepts.
The notion of utility does not separate monetary and nonmonetary components of value while general value explicitly presents these components separately.
3.5. Examples of General Value
To clarify the approach let’s discuss the examples related to a choice of goods or services.
3.5.1. Choice of a product to purchase
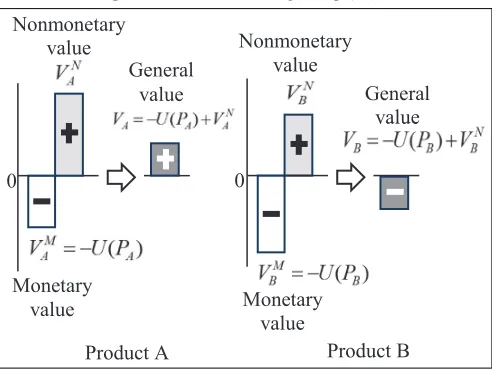
Suppose an individual must choose between buying product A or product B with the respected prices PA and PB. The general value resulted from buying product A would be VA and the general value resulted from buying product B would be VB
V =V +V = U(P )+V
V =V +V = U(P )+V
A A
M A
N
A A
N
B B M
B N
B B
N −
− (10)
where U(PA) and U(PB) are the monetary components of purchasing products A and B expressed in the terms of utility of money. Utility of money, U(P), relates to a specific individual, where P is the amount of money. The monetary value in Eq. (10) is presented with the negative sign because the price is paid by the individual, i.e. the higher price the lower is the satisfaction with the product for the individual. The nonmonetary values of the products are positive if the buyer expects satisfaction with the products, possibly different satisfaction with different products that results in different nonmonetary values of the products. An example of general values of products A and B as in Eq. (10) is shown in Figure 1. The general value of product A, as the sum of monetary and nonmonetary values, is positive for the buyer in the example presented in Figure 1 that leads to a favorable decision about buying the product. The nonmonetary value of product B is lower than the negative monetary value of the product, thus the general value of product B is negative for buyer in the example presented in Figure 1. This leads to the unfavorable decision about buying the product. In result, the individual considers buying product A but rejects buying product B.
3.5.2. Comparison of products
In a comparative assessment of two products, say, product A and product B, the individual compares their general values as:
∆VAB=VA−V = Vk ∆ ABM + V∆ ABN (11)
where M AB
V
∆ and N AB
V
∆ are the differences of monetary and nonmonetary values of products A and B as expressed in Eq. (9), i.e.
M M M
AB A B A B
N N N
AB A B
V =V V = (U(P ) U(P ))
V =V V
− − −
−
∆
∆ (12)
If the individual shows neutral perception of money, i.e.
U(P)=P (13)
Then Eq. (10) for general values can be rewritten in terms of amount rather than in terms of utility of money, i.e.
V =A −P +VA AN or V =B −P +VB BN (14)
Thus
∆ ∆
V =V V = (U(P ) U(P ))= (P P )
V =V V
AB M
A M
B M
A B A B
AB N
A N
B N
− − − − −
− (15)
The difference of general values of products A and B, ΔVAB, defines the individual’s preference between the products. If ΔVAB>0 then the individual prefers product A, if ΔVAB<0 the individual prefers product B, and if ΔVAB=0 the individual is indifferent about the products. These choices are presented in Eq. (16) below:
N
AB AB AB
N
AB AB AB
N
AB AB AB
if V > P V >0 Preference of product A if V < P V <0 Preference of product B if V = P V =0 No preference
∆ ∆ → ∆ →
∆ ∆ → ∆ →
∆ ∆ → ∆ →
(16)
Where
ΔPAB=PA−PB (17)
As is evident from Eq. (16), the preference of one product over another is determined by the relationship between the differences in the monetary and the nonmonetary values of the products. Product A may be more expensive than product B but shows a sufficiently higher nonmonetary value to be chosen over product B.
An example of a comparison of products A and B is shown in Figure 2. Both products show positive general values in the perception of individual k but product A has a higher general value than product B, i.e. ΔVAB>0, that results in the preference of product A over product B.
4. METHODOLOGY OF MEASURING
NONMONETARY VALUES
4.1. The Methodology
The purpose of this research is to develop a methodology of measuring nonmonetary component of general value. Speaking more accurately, we measure the difference between nonmonetary values of the alternative choices. The method was based on the analysis above by finding the point of indifference of choice. For this purpose, we developed the appropriate questionnaires that help find points of indifference in choices. As the point of indifference is reached, i.e. ΔVAB=0, the difference of nonmonetary values was calculated as the difference of monetary values with the opposite sign as:
∆VABN =−∆VABM (18)
In the assumption that the individual has neutral perception of money, at least in the given range of prices, Eq. (18) can be simplified as
∆VABN =PA−PB (19)
Nonmonetary value
Monetary value
General value
Product A 0
Nonmonetary value
Monetary value
General value
Product B 0
∆VAB
Figure 2: An example of a choice between two products, A or B, for an individual with neutral perception of money, i.e., with U(P)=P and
according to Eq. (15)
Figure 1: An example of the added general value of purchasing
4.2. The Research Domain
We analyzed and measured the difference of nonmonetary values in two domains:
• buying decision (smartphones, cars, shoes)
• decision on choosing a service provider (an auto service or an airline).
The methodology of measuring the nonmonetary component of general value in case of choosing a job was recently discussed in Aityan et al. (2016).
4.3. Questionnaires
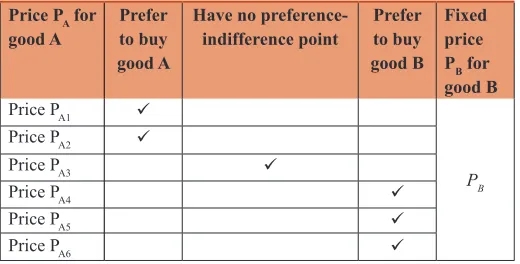
Questionnaires for the surveys were developed to identify the indifference point between two products or two services for the respondent as shown in a sample in Figure 3. The respondents were offered to choose between two well-known products (goods or services), so the respondents had clear understanding of these products. One of two products had a fixed price while the other product was offered at a variety of different prices. The respondents were asked to indicate their preference on what product to buy at each pair of prices.
For example, the sample questionnaire in Figure 3 offers two products, A and B. Product A is offered at various prices PA1,…, PA6 while product B is offered at a fixed price PB. A respondent should indicate his personal preference of buying product A or B for each price PAN for product A from the list of prices in the second column. The answers shown in Figure 3 indicate that the respondent prefers product A over product B at prices PA1 and PA2 for product A. On the other hand, the respondent prefers product B over product A at prices PA4 and higher for product A. However, the respondent has no preference of buying good A or B at price PA3 for product A. Let’s refer this choice to as the indifference point. At the indifference point, both products have equal general values for the individual, thus the difference of the nonmonetary values of products A and B are compensated by the difference of prices (monetary value) and can be calculated according to Eq. (19).
To avoid confusion of the respondents on how to fill up the questionnaire, each actual questionnaire contained an example of an answer similar to one shown in Figure 3.
Figure 4 illustrates the logical schema of the sample questionnaire shown in Figure 3. As soon as the respondent comes to the indifference point at price PA3 for product A, it means that the difference in prices, i.e. PA3−PB, offsets the difference in nonmonetary values that makes the general values of both products equal in the perception of the respondent. Then according to Eq. (19), the difference of the nonmonetary values of product A and B is PA3−PB.
Both rightmost columns in Figure 4 look identical. However these two columns are numerically equal only in case of neutral utility of money, U(P)=P, as in Eq. (13) in a buying transaction when the difference of nonmonetary values equals the difference in prices (Eq. (19)) because in a buying transaction price negatively contributed to the general value (Eq. (10)). In a more general case the rightmost columns in Figure 4 may look differently.
4.4. Sampling, Sample Size, Data Verification, and Processing
The survey was conducted in Moscow, Russia in 2014 and 2015 mostly among students of the Moscow Institute of International Relations, Russia.
Due to high volatility of the Russian ruble (RUB) exchange rate, all data are given in rubles as it was originally measured without conversion to USD.
All incomplete, wrongly or ambiguously filled questionnaires were declared invalid and removed from the survey. The portion of invalid responses varied from 20% through 40% per each survey. In result, the sample sizes of valid responses for different surveys varied from 130 through 170 correctly answered questionnaires per survey.
All valid results were collected and statistically processed with the significance level of 90% (error 10%).
5. MEASURING NONMONETARY VALUES
OF CONSUMER PRODUCTS AND
SERVICES
5.1. Measuring Nonmonetary Values of Consumer Products
5.1.1. Measuring nonmonetary value of the iPhone 6 Brand In the survey on iPhone 6 versus a NoName smartphone, respondents had to make a choice between iPhone 6 and a hypothetical smartphone of an unknown brand that has the same features and technical characteristics as iPhone 6. The respondents
Figure 3: A sample questionnaire
Figure 4: The logical schema of the sample questionnaire shown in Figure 3
Price PA for
good A Prefer to buy good A
Have no
preference-indifference point Prefer to buy good B
Fixed price PB for good B
Price PA1
PB
Price PA2
Price PA3
Price PA4
Price PA5
had to fill out the questionnaire similar to one shown in Figure 3 to indicate the indifference point by choosing the price at which they would have no preference of buying a NoName smartphone or an iPhone 6. The price of a NoName smartphone was fixed in the questionnaire while a variety of prices for an iPhone 6 were suggested. The questionnaire suggested a finite list of distinct prices for an iPhone 6 such as 15, 30, 47, 62, and 80 thousand rubles which were higher than the price for an NoName smartphone by 0, 15, 32, 47, and 65 thousand rubles, respectively. In the period of conducting this survey, the exchange rate of RUB against USD was fluctuating in the range between 35.8 and 36.6 RUB per USD. The respondents had to indicate their preferences in choosing either NoName smartphone or iPhone 6 at each suggested price. At one of the prices for iPhone 6, the respondent may have no preference of buying either iPhone or a NoName smartphone that indicates the indifference point. The finite list of prices for iPhone 6 limits the respondent’s choice but nonetheless reasonably well reflects values.
The nonmonetary value of iPhone versus the NoName smartphone was calculated according to Eq. (19) by the difference in prices of iPhone 6 and the NoName smartphone at the indifference point, i.e. at the price for iPhone 6 that makes the respondent indifferent in choosing between iPhone 6 and NoName smartphone.
The logical schema of the questionnaire on iPhone 6 versus the NoName smartphone is shown in Figure 5. The left column in the figure shows the fixed price for the NoName smartphone. The second column shows the list of suggested prices for iPhone 6, the third column shows the markup suggested for iPhone 6 versus the NoName smartphone as PiPhone 6–PNoName, and the fourth column shows the relative nonmonetary value of iPhone 6 versus the NoName smartphone calculated in accordance to Eq. (19). The numbers in Red on the arrows between the third and fourth columns indicate the number of respondents for whom the appropriate markup price sets the indifference point.
The total number of respondents participated in the survey was 130 but only 85 completed questionnaires have passed the validity test. The survey results based on 85 valid questionnaires are shown in Table 1 and Figure 6. The calculated nonmonetary values in Table 1 are presented against the number of respondents, who provided those values. The upper row in the Table 1 show the calculated nonmonetary value of iPhone 6 versus the NoName smartphone and the lower row shows the number of respondents who made the appropriate choice in the valid questionnaires similarly to what was presented in Figure 5.
The mean value, standard deviation and confidence interval calculated with significance level of 90% (10% error) on the iPhone survey sample are presented in Table 2. The dotted line in Figure 6 shows the normal distribution on the sample that matches the mean value and the standard deviation presented in Table 2.
The results of the survey lead to the conclusion that the nonmonetary value of iPhone 6 as a brand is on average 20 thousand rubles among the respondents, i.e. the respondents are ready to pay 20 thousand rubles more for the brand rather than for technical characteristics and features of a smartphone.
Figure 5: The logical schema of the questionnaire on iPhone 6
Figure 6: The survey results on the nonmonetary value of iPhone 6
versus a NoName smartphone
Table 1: The survey results on measuring the nonmonetary value of iPhone 6 versus a NoName smartphone
Nonmonetary value of iPhone 62 (×1000 rubles)
0 15 32 47 65
Number of respondents 19 32 25 9 0
Table 2: Statistical parameters calculated from the survey on nonmonetary value of iPhone 6 versus a NoName smartphone
Statistical results on the nonmonetary value
of iPhone 6 (×1000 rubles)
Mean value 20
Standard deviation 16
Confidence interval (calculated with
significance level of 90%) 17-23
2 The term “nonmonetary value” will be used here and below in the paper as the difference of the nonmonetary values in each particular choice. 5.1.2. Measuring the nonmonetary value of the iPhone 5S versus iPhone 5
the survey. The survey was conducted at the same time and on the same population stratum as the previous survey on iPhone 6.
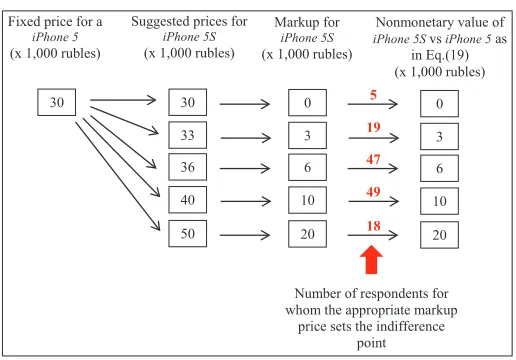
In this survey, we tried to find a difference of nonmonetary values between iPhone 5S and iPhone 5 by the amount, which the respondents were willing to pay for iPhone 5S extra to iPhone 5. The price of iPhone 5 was fixed at 30 thousand rubles and each respondent had to choose from a finite list of suggested prices for iPhone 5S that price, at which the respondent is indifferent about what model to buy. In the period of conducting this survey, the exchange rate of RUB against USD was fluctuating in the range between 68 and 61 RUB per USD. The logic of the questionnaire, the suggested prices, and the number of respondents who have chosen the appropriate indifference points are shown in Figure 7.
The total number of respondents was 162, but the number of valid responses was 138. The invalid questionnaires were disqualified and removed from the sample. The results of this survey are shown in Table 3 and Figure 8. The upper row in Table 3 shows the list of the offered markup prices for iPhone 5S versus iPhone 5 and hence, according to Eq. (19), the nonmonetary value of iPhone 5S versus iPhone5. The lower row in Table 3 shows the number of respondents who had chosen the appropriate price difference as the point of indifference of choice. Figure 8 shows the same results as a chart.
The mean value, standard deviation and confidence interval calculated with 90% significance (10% sampling error) on the sample for iPhone 5 are presented in Table 4. The dotted line in Figure 8 shows the normal distribution on the sample that matches the mean value and the standard deviation presented in Table 4.
The results of the survey led to the conclusion that the students on average are willing to pay extra 8.6 thousand rubles for iPhone 5S versus iPhone 5. It means that the respondents attach a nonmonetary value to iPhone 5S by 8.6 thousand ruble higher than to iPhone 5 with the standard deviation of 5.2 thousand rubles. The 90% (or 10% error) confidence interval was (7.9-9.3 thousand rubles).
5.1.3. Measuring the nonmonetary value of the “Christian Louboutin” brand
The next survey was conducted to measure the nonmonetary value of Christian Louboutin brand for ladies’ shoes versus similar shoes of a NoName brand, i.e. of an unknown manufacturer.
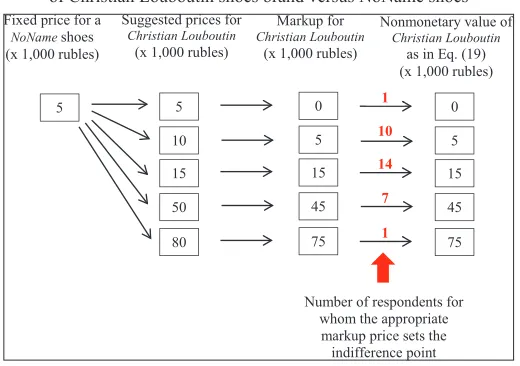
A sample of 52 female respondents was randomly chosen from the students; 33 completed questionnaires were qualified as valid in the survey. According to the survey logic, the fixed price was set of a NoName pair of shoes while the finite list of the suggested prices was offered for Christian Louboutin shoes. The number of respondents with the corresponding indifference points are shown in Figure 9. At the time of conducting this survey, the exchange rate of RUB against USD was fluctuating in the range between 35 and 36 RUB per USD.
The markup prices for the Christian Louboutin brand for the indifferent choice along with the number of respondents selected those prices in the survey are shown in Table 5 in accordance to the information shown in Figure 10. The markup prices represent the nonmonetary value of the brand according to Eq. (19).
Table 6 shows the statistical parameters calculated in the survey. The mean value of the nonmonetary value of the Christian Louboutinbrand was 20 thousand rubles with a quite high standard deviation of 18 thousand rubles. The dotted line in Figure 10 shows the normal distribution on the sample that matches the mean value and the standard deviation presented in Table 6. The confidence interval calculated on the sample with 90% significance (10% sampling error) was 15-25 thousand rubles.
Figure 7: The logical schema of the questionnaire on iPhone 5Sversus
iPhone 5
Figure 8: The survey results on the nonmonetary value of iPhone 5S versus iPhone 5
Table 3: The survey results on measuring nonmonetary value of iPhone 5S versus iPhone 5
Nonmonetary value of iPhone 5S versus
iPhone 5 (×1000 rubles) 0 3 6 10 20
Number of respondents 5 19 47 49 18
Table 4: Statistical parameters calculated from the survey on the nonmonetary value of iPhone 5S versus iPhone 5 Statistical results on the nonmonetary value of
iPhone 5S versus iPhone 5 (×1000 rubles)
Mean value 8.6
Standard deviation 5.2
Confidence interval (calculated with significance
Thus female students set the mean nonmonetary value to the Christian Louboutin brand for shoes as 20 thousand rubles.
5.1.4. Measuring the nonmonetary value of the “Mazda” car brand
In our next survey, we measured the nonmonetary value of the “Mazda” car brand. We chose Mazda 3 model for the research because this model is very popular among the youth including students. For the comparison, we used an imaginary car with the similar body style, technical characteristics, and features but made by a NoName manufacturer. In the questionnaire, we priced a NoName car as much as 450 thousand rubles. In the period of conducting this survey, the exchange rate of RUB against USD was fluctuating in the range between 68 and 61 RUB per USD. The questionnaire suggested the following list of prices for Mazda 3 as shown in Figure 11 together with the calculated markup and nonmonetary value of Mazda 3.
The initial sample size included 170 students but only 112 completed questionnaires passed the validity check and were used for the further processing and analysis. The results of the survey are shown in Table 7 and Figure 12. The upper row in Table 7 shows the nonmonetary values of Mazda 3 brand versus the NoName car
as the markup price suggested in the questionnaire according to Eq. (19) while the lower row shows the number of the respondents, who chose those values as their indifference point.
Figure 12 shows the same data as in Table 7 as well as the normal distribution matching the statistical data on the sample shown in Table 8. As presented in Table 8, the mean nonmonetary value of the Mazda 3 brand was assessed as 80 thousand rubles versus a similar NoName car with the standard deviation of 56 thousand rubles. The confidence interval calculated on the sample with 90% confidence (10% sampling error) was 71-89 thousand rubles.
5.2. Measuring Nonmonetary Values of Services
Consumers may also have nonmonetary preferences for services based on details, which are not reflected in the monetary components. For example, consumers would prefer to use services where providers are friendlier to their customers.
In this part of our research, we tried to identify the nonmonetary value of the specialized car services at specialized dealerships versus other car services by finding the point of indifference of the respondents similarly to what we did in the surveys described above.
In this part of our research, we focused our research on car services and airlines.
Figure 9: The schema of the questionnaire on the nonmonetary value of Christian Louboutin shoes brand versus NoName shoes
Table 5: The survey results on measuring the nonmonetary value of “Christian Louboutin” brand Nonmonetary value of Christian
Louboutin (×1000 rubles) 0 5 15 45 75
Number of respondents 1 10 14 7 1
Table 6: Statistical parameters calculated from the survey on the nonmonetary value of “Christian Louboutin” Statistical results on the nonmonetary value of
“Christian Louboutin” brand (×1000 rubles)
Mean value 20
Standard deviation 18
Confidence interval (calculated with significance
level of 90%) 15-25
Table 7: Survey results on measuring the nonmonetary value of Mazda 3 car brand
Nonmonetary value of Mazda
car brand (×1000 rubles) 0 25 50 100 150 250
Number of respondents 6 20 29 40 12 5
Table 8: Statistical parameters calculated from the survey on nonmonetary value of “Mazda 3” car brand
Statistical results on the nonmonetary value of
“Mazda 3” car brand (×1000 rubles)
Mean value 80
Standard deviation 56
Confidence interval (calculated with significance
level of 90%) 71-89
5.2.1. Measuring the nonmonetary value of specialized car services
In the survey dedicated to car services, the questionnaire offered a choice between a NoName private garage service versus service at a service center at a specialized dealership at a premium price relative to the NoName garage service. The price for the service at a NoName garage was set to 7 thousand rubles and a list of the suggested prices for the same service at a specialized dealership was set to 7, 8, 10, 12, 15, and 20 thousand dollars as shown in Figure 13. During the period of conducting this survey, the exchange rate of RUB against USD was fluctuating in the range between 68 and 61 RUB per USD. The Figure 13 also shows the calculated markup price and the appropriate nonmonetary value. The respondents had to make their choices of the service. The nonmonetary value of the service at a specialized dealership was calculated according to Eq. (19) and shown in the right hand side column of Figure 13.
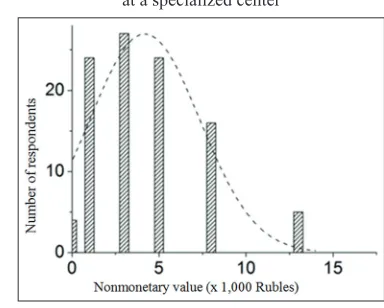
The total number of respondents in this survey was 169 but the number of valid responses was 100. The other returned questionnaires were disqualified and discarded due to their incompleteness or inaccuracies, which could lead to ambiguities. The valid indifferent points chosen in the valid questionnaires are presented in Figure 13 in red. The summary of the nonmonetary values of the specialized car services versus a NoName service is shown in Table 9 and Figure 14. The dotted line in Figure 14 shows the normal distribution on the sample that matches the mean value and the standard deviation presented in Table 9.
Table 10 presents the mean nonmonetary value of a car service at a specialized service center versus a service at NoName garage along with the standard deviation and confidence intervals calculated on the sample with 90% confidence (10% sampling error).
5.2.2. Measuring the nonmonetary value of airlines
Many airlines operate throughout the world and offer a huge diversity of fares and levels of services. Some passengers prefer to go with the cheapest airlines while other passengers prefer quality of services over the price. In this part of our research, the goal was to measure the nonmonetary value of airlines in the perception of passengers. We compared two Russian airlines: The Russian major airline Aeroflot3 with a small airline KavMinVodyAvia4. Both
Figure 11: The logical schema of the questionnaire on the nonmonetary value of Mazda 3versus a NoName car with the similar
technical characteristics, features, and body style
Figure 12: The survey results on nonmonetary value of “Mazda” car brand
Figure 13: The logical schema of the questionnaire on the nonmonetary value of car services
Table 9: Survey results on measuring nonmonetary value of car service at a specialized center versus service at NoName garage
Nonmonetary value of specialized car service center versus a NoName
garage (×1000 rubles)
0 1 3 5 8 13
Number of respondents 4 24 27 24 16 5
Table 10: Statistical parameters calculated from the survey on the nonmonetary value of a car service at a specialized service center
Statistical results on the nonmonetary value of
car service at a specialized center (×1000 rubles)
Mean value 4.2
Standard deviation 3.2
Confidence interval (calculated with significance
level of 90%) 3.7-4.70
route Moscow-Sochi is the airline’s brand name and prestige, i.e. the nonmonetary value of the airline in the perception of passengers. To calculate the difference of the nonmonetary values of these two airlines, we have to identify the indifference points in the perception of the passengers, i.e. how much passengers are ready to pay extra to fly with Aeroflot rather than with KavMinVodyAvia.
In the survey questionnaire, we used a fixed fare of 11 thousand rubles for one roundtrip ticket Moscow-Sochi on KavMinVodyAvia. In the period of conducting this survey, the exchange rate of RUB against USD was fluctuating in the range between 68 and 61 RUB per USD. The suggested round-trip airfare on Aeroflot, the difference of the fares, and nonmonetary value calculated as in Eq. (19) are shown in Figure 15 together with the number of respondents, for whom the suggested airfare with Aeroflot created the indifference point (shown in red).
The total number of students participating in this survey was 160, however only 138 completed questionnaires were qualified as valid. The numbers of respondents by their indifferent points are shown in Figure 15 and the appropriate nonmonetary values along with the number of respondents are shown in Table 11 and Figure 16.
Table 12 shows the statistical results of the survey. The mean nonmonetary value of a round-trip flight with Aeroflot versus a similar flight with KavMinVodyAvia was 5.0 thousand rubles, the standard deviation was 3.0 thousand rubles, and confidence interval was 4.6-5.5 thousand rubles calculated with 90% confidence factor (10% sampling error).
6. CONCLUSION
This paper proposed and practically used a methodology of measuring the nonmonetary component of general value based on
indifference points. General value (Aityan, 2013) consists of two components: Monetary and nonmonetary. Most of the time, we refer to the nonmonetary component of general value simply as to nonmonetary value. These two terms, nonmonetary component of general value and nonmonetary value, are synonymous. It was also mentioned that there is no need to measure the absolute level of nonmonetary value because only the difference of nonmonetary values of two goods, brands, or services are needed for making decisions. This is similar to the notion of potential energy in physics where only the difference in potential energies makes
Figure 14: The survey results on the nonmonetary value of car service at a specialized center
Figure 15: The logical schema of the questionnaire on the nonmonetary value of airlines
Figure 16: The survey results on the nonmonetary value of a
round-trip flight with Aeroflot versus a similar flight with KavMinVodyAvia
Table 11: The survey results on nonmonetary value of a
round‑trip flight with Aeroflot versus a similar flight with
KavMinVodyAvia Nonmonetary value of a
roundtrip ticket on Aeroflot versus a similar flight on KavMinVodyAvia (×1000 rubles)
0 2 4 7 10 14
Number of respondents 11 31 32 45 19 0
Table 12: Statistical parameters calculated from the
survey on nonmonetary value of round‑trip flight with Aeroflot versus a similar flight with KavMinVodyAvia
Statistical results on the nonmonetary value of
round‑trip flight on Aeroflot versus a similar flight on KavMinVodyAvia
(×1000 rubles)
Mean value 5.0
Standard deviation 3.0
Confidence interval (calculated with significance
level of 90%) 4.6-5.5
3 Аэрофлот (in Russian).
real sense while the absolute value of the potential energy is just a purely theoretical concept.
The proposed methodology of measuring nonmonetary value is based on the consumer’s indifference point. This indifference point is set by the differences in monetary values (prices, wages, etc.) of two different goods, brands, services, or states of the same object that leave the individual no preference about these two goods, brands, services, or states of the same object, i.e., keep the general value on the same level as in Eq. (4). In result, the difference of nonmonetary values can be measured by the difference of monetary values with the opposite sign as presented in Eq. (6).
In case of purchasing, the price of a good or service contributes to the general value in the form of utility of money with the opposite sign, because the higher price the lower the general value for the consumer from this particular good or service. Thus the difference of nonmonetary values of two goods or services can be measured according to Eq. (12) as a difference between the utilities of their prices, i.e. a difference of the individual perception of the prices.
In this research for simplicity, we used neutral perception of money, i.e., we used price itself instead of the individual utility of price because the main accent in this research was placed on the methodology of measuring nonmonetary value through the indifference point. In the future research, we will take the perception of money into account too.
In the application of the proposed methodology to the job market (Aityan et al., 2016), the difference of nonmonetary values of two jobs were measured by the difference of the utility of the monetary compensation with the opposite sign because higher compensation adds value in contrast to high purchase prices which reduce values.
In our future research, we plan to measure and compare nonmonetary values of goods and services for different social group of people and expect to see the difference in their assessment of the nonmonetary values reflecting perceptional differences in different social groups.
The authors would like to thank Andrey Lakalin and Alexandr Podvizhenko, students of MIIR, for their help in conducting the surveys and initial data processing.
REFERENCES
Aityan, S.K. (2011), Price-value potential for near-perfectly
competitive markets. American Journal of Economics and Business Administration, 3(4), 623-635. Available from: http://www.
thescipub.com/PDF/ajebasp.2011.623.635.pdf.
Aityan, S.K. (2013), The notion of general value in economics.
International Journal of Economics and Finance, 5(5), 1-14. Available from: http://www.ccsenet.org/journal/index.php/ijef/
article/view/26698/16304.
Aityan, S.K., Ivanov-Schitz, A.K., Thapa, S. (2016), Measuring the
nonmonetary component of general value for jobs. Advances in Social Sciences Research Journal, 3(4), 1-33.
Becker, G. (1968), Crime and punishment: An economic approach. The
Journal of Political Economy, 76(2), 169-217. Available from: http://
www.jstor.org/discover/10.2307/1830482?sid=21106242972313&u id=4&uid=2&uid=3738936.
Blackaby, D.H., Murphy, P.D. (1995), Earnings, unemployment and
Britain’s North-South divide: Real or imaginary? Oxford Bulletin of
Economics and Statistics, 4, 487-512. Available from: http://www.
onlinelibrary.wiley.com/doi/10.1111/j.1468-0084.1995.tb00036.x/
pdf.
Brown, C. (1980), Equalizing differences in the labor market. Quarterly Journal of Economics, 94(1), 113-134. DOI: 10.2307/1884607. Chipman, J.S., Moore, J.C. (1980), Compensating variation, consumer’s
surplus, and welfare. American Economic Review, 70(5), 933-949. Gale, B.T., Swire, D.J. (2006), Value-Based Marketing & Pricing.
Working Paper of Customer Value, Inc. p1-19. Available from: http://
www.cval.com/pdfs/VBMarketingAndPricing.pdf.
Gossen, H.H. (1854), Die Entwickelung der Gesetze des Menschlichen
Verkehrs, und Der Daraus fließenden Regeln für menschliches
Handeln. English: The Laws of Human Relations and the Rules of Human Action Derived. Cambridge, Mass: MIT Press.
Han, S., Yamaguchi, S. (2015), Compensating wage differentials in
stable job matching equilibrium. Journal of Economic Behavior and Organization, 114(C), 36-45.
Hicks, J.R. (1939), Value and Capital: An Inquiry into Some Fundamental Principles of Economic Theory. Oxford: Clarendon Press.
Jevons, W.S. (2010), The Theory of Political Economy. Whitefish, MT: Kessinger Publishing. (Original Work Published 1879).
Kahn, A.E. (1979), Applications of economics to an imperfect world. American Economic Review, 69(2), 1-13.
Kahneman, D., Tversky, A. (1979), Prospect theory: An analysis of decision under risk. Econometrica, 47(2), 263-291.
Kahneman, D., Slovic, P., Tversky, A. (1982), Judgment Under Uncertainty: Heuristics and Biases. Cambridge: Cambridge University Press.
Kahneman, D., Tversky, A. (2000), Choices, Values, and Frames.
Cambridge: University Press.
Kahneman, D. (2011), Thinking, Fast and Slow. New York: Farrar, Straus
and Giroux.
Ksenzhek, O. (2007), Money: Virtual energy: Economy through the prism
of thermodynamics, Universal Publishers, 212 p.
Marshall, A. (1890), Principles of Economics. London: Macmillan and
Co., Ltd.
Marx, K. (1992), Capital: A Critique of Political Economy. Vol. 1-3.
London: Penguin. (Original Work Published 1867).
McKenzie, R.B., Tullock, G. (1981), The New World of Economics: Explorations into the Human Experience. Ch. 2, 20. New York: Irwin. Menger, C. (2007), Principles of Economics, Seattle, WA: CreateSpace.
(Original Work Published in 1871).
Pollis, A., Koslin, B.L. (1962), On the scientific foundations of Marginalism. American Journal of Economics and Sociology, 21(2), 113-130. Available from: http://www.dx.doi.org/10.1111/j.1536-7150.1962. tb00829.x.
Ricardo, D. (1817), The Principles of Political Economy and Taxation.
Mineola, NY: Dover Publications. p320.
Rhoads, S.E. (2007), Henderson, D.R., editor. Concise Encyclopedia of
Economics (Marginalism). Indianapolis: Liberty Fund, Inc. Rosen, S. (1974), Hedonic prices and implicit markets: Product
differentiation in pure competition. Journal of Political Economy,
82(1), 34-55. DOI: 10.1086/260169.
Rosen, S. (1983),The Equilibrium Approach to Labor Market, NBER
Working Paper Series, Working Paper 1165. Available from: http://
www.nber.org/papers/w1165.pdf.
Samuelson, P.A., Nordhaus, W.D. (2004), Economics. New York:
Schulak, E.M., Unterköfler, H. (2011), Austrian School of Economics.
Auburn, AL: Ludwig von Mises Institute.
Simon, H.A. (1955), A behavioral model of rational choice. Quarterly
Journal of Economics, 69, 99-118. DOI: 10.2307/1884852.
Simon, H.A. (1972), Theories of Bounded Rationality. North Holland Publishing Company, pp. 161-176. Available from: http://www.
mx.nthu.edu.tw/~cshwang/teaching-economics/econ5005/Papers/
Simon-H=Theoriesof%20Bounded%20Rationality.pdf.
Skousen, M. (2005), Vienna & Chicago, Friends or Foes? A Tale of Two Schools of Free-Market Economics. Washington, DC: Capital Press. Smith, A. (1776), The Wealth of Nations. Chicago: Simon and Brown.
p482.
Walras, L. (2010), Elements of Pure Economics. London: Routledge.