Issues
ISSN: 2146-4138
available at http: www.econjournals.com
International Journal of Economics and Financial Issues, 2016, 6(2), 492-496.
Asymmetric Flow-performance Relationship: Case of Chinese
Equity Funds
Zia-ur-Rehman Rao
1*, Muhammad Zubair Tauni
2, Ajid ur Rehman
31School of Accounting, Dongbei University of Finance and Economics, Dalian, China, 2School of Accounting, Dongbei University of Finance and Economics, Dalian, China, 3School of Accounting, Dongbei University of Finance and Economics, Dalian, China. *Email: [email protected]
ABSTRACT
This study investigates the relationship of fund flow and fund performance by using the sample of 557 Chinese equity mutual funds for the period of 11-year. We apply fixed effect regression model on unbalanced panel data and find that relationship between fund flow and fund performance is positive. Like previous studies, findings of this study also exhibit the asymmetric flow-performance relationship which implies that investors’ response is more sensitive to good past performance as compared to bad past performance. Furthermore, size and age of fund weaken the flow-performance relationship.
Keywords: Fund Flow, Mutual Funds, China, Flow-performance Relationship
JEL Classifications: G23, L14
1. INTRODUCTION
Plenty of research has been done on the mutual fund industry of developed markets like US but there is scarcity of literature on mutual funds of developing economies like China. Mutual fund industry has witnessed a robust growth in China in last 20 years and this big size of mutual fund industry has some impact on financial market. China has developed its financial institutions with the objective that these institutions will improve the efficiency and corporate governance of the companies and help stabilize the financial markets (Firth et al., 2016). The impact of mutual fund industry in China’s economy proposes that dependence of fund flow on past performance has implications for risk and return that investors face in stock and bond markets. However, little is known about how this flow-performance relationship works in China and we try to fill this gap in literature and provide new insights into the flow-performance relationship in Chinese mutual fund industry.
Fund flow means the cash inflow and outflow from the mutual funds. In US, the response of mutual fund investors to fund past performance is more sensitive to good performance of funds as compared to bad fund performance (Ippolito, 1992; Sirri and
Tufano, 1998; Del Guercio and Tkac, 2002). Therefore, well-performing funds attract superfluous big cash inflows in following time periods whereas worst performing funds undergo little cash outflows (Fant and O’Neal, 2000). There are different explanations for this non-linear flow-performance relationship. One is the transaction cost that halts investors to move cash in and out from the funds (Ippolito, 1992). Second is the cognitive dissonance (Goetzmann and Peles, 1997). Third is the advertisement expense and media involvement (Sirri and Tuffano, 1998). Gruber (1996) asserts that factors like transaction cost, marketing effect and broker advice suppress the response of investors towards worst performance of fund. Fourth is the disposition effect (Shefrin and Statman, 1985). Fifth is the impact by different clientele of investors (Christoffersen and Musto, 2002).
investor move cash into the fund if fund gives good return and move cash out from the fund if the fund gives bad return.
This study examines the relationship of fund flow and fund past performance by using the data of 557 Chinese equity mutual funds for the period from January 2004 to December 2014. We use fixed effect regression on unbalanced panel data and find the positive flow-performance relationship as reported in previous studies. It is further found that flow-performance relationship is asymmetrical as investors of well-performing funds show more sensitivity to funds’ past performance as compared to investors of worst-performing funds. This study has its implications for both academics and practitioners. From academic point of view, this study gives understanding of trading behavior of mutual fund investors. Moreover, Asset management companies need to know the investment behavior of investors and overall environment of mutual fund business.
The rest of the paper is organized as follows. Section 2 gives data description. Section 3 explains research methodology and discusses results. Finally, Section 4 concludes.
2. DATA DESCRIPTION
The data is taken from RESSET1 financial database and only equity
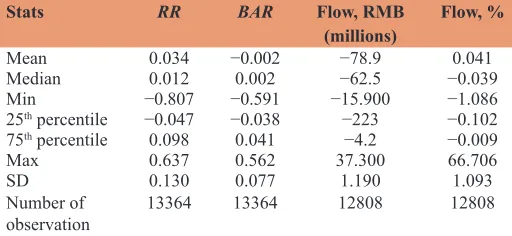
funds are studied for the period from January 2004 to December 2014. This study takes only actively managed funds and excludes index funds, qualified domestic institutional investor funds and principal guaranteed funds. Because of these filters, the final sample consists of only 557 Chinese equity funds. Descriptive statistics are given in table I. Raw return (RR) is quarterly raw reported return in RESSET database and this is net of all operating expenses. Benchmark-adjusted return (BAR) is the excess (difference) of quarterly raw return of fund from quarterly market return. Benchmark-adjusted return (BAR) is widely used by practitioners for evaluating the funds’ performance (Busse et al., 2010 and Bauer et al. (2009). Market return is the return on China A-share composite stock exchange index. Like Bollen (2007) and Rao et al. (2015) we take Dollar flow as the net flow which is measured as follows:
Flowi,t = TNAi,t−TNAi,t−1 (1+Ri,t) (1)
Where Flowi,t is the flow (net flow) of fund i in time t, TNAi,tis the total net assets of fund i in quarter t, TNAi,t−1is the total net assets of fund i in previous quarter (t−1), Ri,tis the return of fund
i in quarter t.Flow, % is the percentage net flow which is Flowi,t/ TNAi,t−1.
3. RESEARCH DESIGN AND DISCUSSION
3.1. Flow-performance Relationship
For fund performance we take two measures. One is the raw reported return given on RESSET database and second is the AR
which is the excess return of fund from the benchmark market. This AR is not risk adjusted. To investigate flow-performance
1 www.resset.cn
relationship, like Nanda et al. (2004) we run fund fixed effect regression on unbalanced panel data, which is as follows:
Flowi,t (Flow, %i,t) = αi+β1RRi,[t−4,t−1]+β2Ln(TNA)i,t−1+
β3Ln(age)i,t−1+µi,t (2)
Where Flowi,t(Flow, %i,t) is the net flow in RMB, millions (net flow percentage) in fund i in quarter t, RRi,[t−4, t−1] is the RR of fund
i in previous 4 quarters (t−4to t−1), Ln(TNA)i,t−1 is the log of total net assets of fund i in previous quarter i.e. t−1, Ln(age)i, t−1
is the log of age of fund i at the end of previous quarter, t−1, measured in years, and µi,t is the error term. Flowi,t(Flow, %i,t) is the independent variable and other variables in Equation (2) are dependent variables. We take the log of TNA in order to cater the growth potential of mutual funds as it is hard for big funds to expand (Chavelier and Elison, 1995). As age of fund affects the investor preferences and older funds grow slowly than younger funds, we take the log of funds age in regression equation.
Table 2 presents the results of regression Equation (2). The coefficients on RR are positive which show that there is a positive relationship between fund performance and fund flow.Our findings about flow-performance relationship with RR. Our finding about this flow-performance relationship is consistent with the findings in previous literature on this topic. For robustness we divide the whole sample period into two time windows: One for 5 years, from 2004 to 2008 and second for 6 years, from 2009 to 2014. In both windows, we find same positive relationship between fund performance and fund flow. This positive flow-performance relationship is significant in our results. Like Shrider (2009), we also find that total net assets and age, both witness negative relationship with fund flow. It implies that larger older funds show comparatively less sensitivity to fund performance. Results of Ln
TNA and Ln age are significant at 1%.
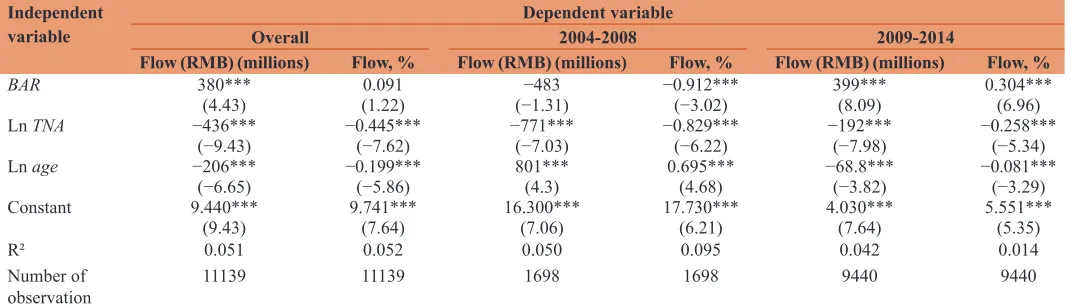
The second measure for observing the performance of mutual funds we have taken is benchmark-adjusted return. We use benchmark-adjusted return (BAR) instead of RR in Equation (2) and run the fund fixed effect regression on unbalanced panel data, as follows:
Table 1: Descriptive statistics
Stats RR BAR Flow, RMB
(millions) Flow, %
Mean 0.034 −0.002 −78.9 0.041
Median 0.012 0.002 −62.5 −0.039
Min −0.807 −0.591 −15.900 −1.086
25th percentile −0.047 −0.038 −223 −0.102
75th percentile 0.098 0.041 −4.2 −0.009
Max 0.637 0.562 37.300 66.706
SD 0.130 0.077 1.190 1.093
Number of
observation 13364 13364 12808 12808
Sample consists of 557 equity funds for the period from January 2004 to December 2014 with 13368 quarterly return observations. Raw return, Benchmark-adjusted return, Flow, RMB (millions) and flow% are reported in this Table 1. Raw return is the quarterly raw reported return taken from RESSET database. Benchmark-adjusted return is the excess
quarterly return from the market return. Flow, RMB (millions) is TNAi,t - TNAi,t-1(1+Ri,t).
Flow % is the Flow, RMB (million) divided by TNAi,t-1 (total net assets at the end of
Flowi,t (Flow,%i,t)=αi+β1BARi,[t−4,t−1]+β2Ln(TNA)i,t−1 +
β3Ln(age)i,t−1+µi,t (3)
Where Flowi,t (Flow,%i,t) is the net flow in RMB, millions (net flow percentage) in fund i in quarter t, BARi,[t−4, t−1] is the excess return of fund i from the benchmark market in previous 4 quarters (t−4to t−1), Ln(TNA)i,t−1 is the log of total net assets of fund i at the end of previous quarter (i.e. t−1), Ln(age)i,t−1 is the log of age of fund i at the end of previous quarter (t−1), measured in years, and µi,t is the error term. Flowi,t(Flow,%i,t) is the independent variable and other variables in Equation (2) are dependent variables.
Results of regression Equation (3) are presented in Table 3. Like RR, Benchmark-adjusted return (BAR) also shows significant positive relationship with the fund net flow. When fund performance increases, the fund net flow sensitivity also increases. The coefficients of total net assets and age show the almost same results as presented in Table 2. It indicates that for older and bigger funds, it is difficult to grow rapidly (Del Guercio and Tkac, 2002).
3.2. Flow-performance Relationship for Good and Bad Funds
In above portion we find that fund flow sensitivity shows positive relationship towards fund performance. Now we want to see whether this fund flow sensitivity shows the same level of response towards all ranges of performance. For this purpose, all funds are divided on the basis of performance in previous four quarters, into two groups: High and low. Two interaction dummy variables are created: One interaction variable is RRi,[t−4,t−1]*Highi,[t−4,t−1] and second interaction variable is RRi,[t−4,t−1]*Lowi,[t-4,t-1]. Following Jun et al. (2014), we run the following time fixed effect regression model where standard errors are clustered by fund:
Flowi,t(Flow,%i,t) = αt+α1Highi,[t−4,t−1]+β1RRi,[t−4,t−1]*Highi,[t−4,t−1]+
β2RRi,[t−4,t−1]*Lowi,[t−4,t−1]+β3Ln(TNA)i,t−1+β4Ln(age)i,t−1+µi,t (4)
Where Flowi,t (Flow,%i,t) is the net flow in RMB, millions (net flow percentage) in fund i in quarter t, RRi,[t−4,t−1] is the RR of fund i in previous 4 quarters (t−4to t−1), Ln(TNA)i,t−1 is the log of total net assets of fund i in previous quarter (i.e. t−1), Ln(age)i,t−1 is
Table 2: Results of regression Equation 2
Independent
variable Overall Dependent variable2004-2008 2009-2014
Flow (RMB) (millions) Flow, % Flow (RMB) (millions) Flow, % Flow (RMB) (millions) Flow, %
RR 560*** 0.503*** 1.150*** 0.971*** 21.2 0.184***
(8.54) (9.98) (9.5) (8.36) (0.76) (6.36)
Ln TNA −457*** −0.468*** −991*** −1.016*** −181*** −0.272***
(−9.49) (−7.76) (−7.56) (−6.43) (−7.06) (−5.44)
Ln age −122*** −0.119*** 1.430*** 1.247*** −70.4*** −0.095***
(−4.94) (−4.05) (5.94) (5.36) (−3.62) (−3.82)
Constant 9.740*** 10.067*** 20.000*** 20.863*** 3.790*** 5.874***
(9.39) (7.73) (7.44) (6.39) (6.76) (5.46)
R² 0.073 0.071 0.098 0.147 0.027 0.014
Number of
observation 11139 11139 1698 1698 9440 9440
Relationship between fund flow and fund past performance: Table 2 shows the flow-performance relationship in Chinese equity funds. We run fund fixed effect regression on unbalanced
panel data. Flow RMB (Flow%) is dependent variable and RR (raw return: Raw quarterly return in previous four quarters), Ln TNA, Ln age are independent variables. Flow(RMB) is measured in millions and Flow,% is the Flowi,t (RMB)/TNAi,t-1. Ln TNA is the log transformation of total net assets of fund i at the end of previous quarter. Ln age is the log transformation of age of fund i at the end of previous quarter. Age is measured in years.R2 is presented in last row. t-statistics are presented in parenthesis. ***Indicate the significance at 1% level
Table 3: Results of regression Equation 3
Independent
variable Overall Dependent variable2004-2008 2009-2014
Flow (RMB) (millions) Flow, % Flow (RMB) (millions) Flow, % Flow (RMB) (millions) Flow, %
BAR 380*** 0.091 −483 −0.912*** 399*** 0.304***
(4.43) (1.22) (−1.31) (−3.02) (8.09) (6.96)
Ln TNA −436*** −0.445*** −771*** −0.829*** −192*** −0.258***
(−9.43) (−7.62) (−7.03) (−6.22) (−7.98) (−5.34)
Ln age −206*** −0.199*** 801*** 0.695*** −68.8*** −0.081***
(−6.65) (−5.86) (4.3) (4.68) (−3.82) (−3.29)
Constant 9.440*** 9.741*** 16.300*** 17.730*** 4.030*** 5.551***
(9.43) (7.64) (7.06) (6.21) (7.64) (5.35)
R² 0.051 0.052 0.050 0.095 0.042 0.014
Number of
observation 11139 11139 1698 1698 9440 9440
Relationship between fund flow and fund past performance: Table 3 shows the flow-performance relationship in Chinese equity funds. We run fund fixed effect regression on unbalanced
the log of age of fund i at the end of previous quarter (i.e. t−1), measured in years, and µi,t is the error term. High takes the value of 1 if the fund i is among the top 50% who have performed well in the previous 4 quarters and 0 otherwise. Note that the dummy
Low variable is not included in the equation to avoid the problem of multicolinearity. Our purpose is to check whether flow sensitivity is same in both good (high) and bad (low) mutual funds. The coefficient β1−β2 serves this purpose.. If β1−β2=0, it means that there is no difference in fund net flow sensitivity of good and bad funds. But if β1−β2>0 then it implies that investors show more response to past performance in well-performing funds than in worst-performing funds, which is convex relationship as reported in prior studies.
Results of regression Equation (4) are reported in Table 4. As our main concern is to see the difference (β1−β2) in flow sensitivity to past performance in good funds and bad funds, we use F-test for this purpose and find that null hypothesis (β1−β2=0) is rejected. We find that β1−β2>0. The difference (β1−β2) is significant in our findings. It implies that response to past performance by investors of well-performing funds is more sensitive than the response to past performance by investors of worst-performing funds. Our results are in line with the previous literature that also shows asymmetric flow-performance relationship in mutual funds (Ippolito, 1992 and Goetzmann and Peles, 1997). However, our results are not in line with the findings of Jun et al. (2014) where they show symmetric flow-performance relationship in Chinese equity funds.
Table 4: Results of regression Equation 4
Independent
variable Overall Dependent variable2004-2008 2009-2014
Flow (RMB) (millions) Flow, % Flow (RMB) (millions) Flow, % Flow (RMB) (millions) Flow, %
RR * High (β1) 2.360*** 1.530*** 4.010*** 2.539*** 1.220*** 1.168***
(9.53) (7.00) (5.48) (4.27) (8.79) (6.48)
RR * Low (β2) 359*** 0.412*** −564 0.894* 198** 0.202***
(3.59) (3.58) (-1.07) (1.81) (2.44) (2.36)
β1−β2 2.000*** 1.118*** 4.580*** 1.645** 1.020*** 0.966***
(F-test, P value) (7.77) (5.13) (5.18) (2.27) (7.39) (5.13)
Ln TNA −649*** −0.601*** −1.360*** −1.219*** −233*** −0.342***
(−9.51) (−7.49) (−7.76) (−5.81) (−8.3) (−5.43)
Ln age −31.6 −0.085 516 −0.338 49.3** 0.075
(−0.47) (−1.01) (0.91) (−0.58) (1.98) (1.17)
R² 0.166 0.116 0.184 0.201 0.122 0.027
Number of
observation 11139 11139 1698 1698 9440 9440
Test of flow sensitivity to fund performance for high and low performance funds. Table 4 presents the results of time fixed effect regression where standard errors are clustered by fund.
RR is the raw return of fund i in previous four quarters (t-4 to t-1). The dummy variable high (low) takes the value of 1 if the fund i is among the top (bottom) 50% who have performed
well (worst) in the previous four quarters (t-4 to t-1) and 0 otherwise. The coefficients on the interaction variables RRi,[t-4,t-1]*Highi,[t-4,t-1](β2) and RRi,[t-4,t-1]*Lowi,[t-4,t-1] (β2) measure flow
sensitivity to performance for good (i.e. in the top 50%) and poor performing funds (i.e. in the bottom 50%), respectively. We apply F-test to see the difference (β1-β2) between flow
sensitivity for good and bad performance. Flow (RMB) is measured in millions and Flow,% is the Flowi,t (RMB)/TNAi,t-1. Ln TNA is the log transformation of total net assets of fund i at
the end of previous quarter. Lnage is the log transformation of age of fund i at the end of previous quarter. Age is measured in years.R2 is presented in last row. t-statistics are presented in
parenthesis. ***,**,*Indicate the significance at 1%, 5% and 10% level respectively
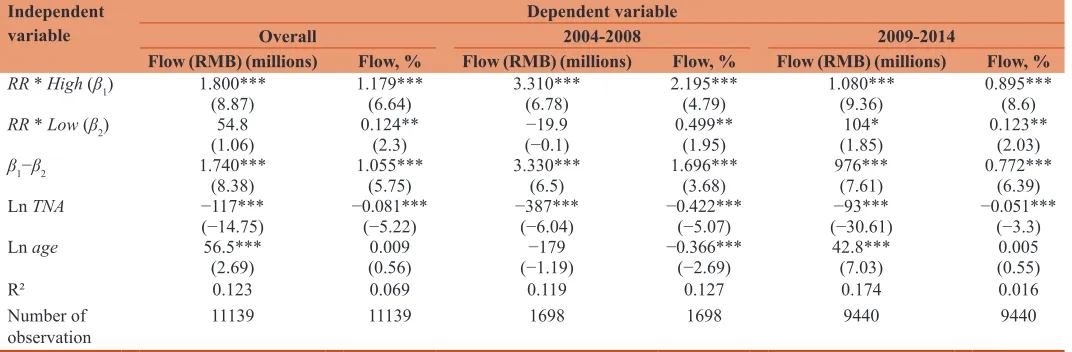
Table 5: Results of OLS regression model
Independent
variable Overall Dependent variable2004-2008 2009-2014
Flow (RMB) (millions) Flow, % Flow (RMB) (millions) Flow, % Flow (RMB) (millions) Flow, %
RR * High (β1) 1.800*** 1.179*** 3.310*** 2.195*** 1.080*** 0.895***
(8.87) (6.64) (6.78) (4.79) (9.36) (8.6)
RR * Low (β2) 54.8 0.124** −19.9 0.499** 104* 0.123**
(1.06) (2.3) (−0.1) (1.95) (1.85) (2.03)
β1−β2 1.740*** 1.055*** 3.330*** 1.696*** 976*** 0.772***
(8.38) (5.75) (6.5) (3.68) (7.61) (6.39)
Ln TNA −117*** −0.081*** −387*** −0.422*** −93*** −0.051***
(−14.75) (−5.22) (−6.04) (−5.07) (−30.61) (−3.3)
Ln age 56.5*** 0.009 −179 −0.366*** 42.8*** 0.005
(2.69) (0.56) (−1.19) (−2.69) (7.03) (0.55)
R² 0.123 0.069 0.119 0.127 0.174 0.016
Number of
observation 11139 11139 1698 1698 9440 9440
OLS: Ordinary least squares. Test of flow sensitivity to fund performance for high and low performance funds. Table 5 presents the results of time fixed effect OLS regression with robust
standard errors. RR is the raw return of fund i in previous four quarters (t-4 to t-1). The dummy variable high (low) takes the value of 1 if the fund i is among the top (bottom) 50% who
have performed well (worst) in the previous four quarters (t-4 to t-1) and 0 otherwise. The coefficients on the interaction variables RRi,[t-4,t-1]*Highi,[t-4,t-1] (β2) and RRi,[t-4,t-1]*Lowi,[t-4,t-1] (β2)
measure flow sensitivity to performance for good (i.e. in the top 50%) and poor performing funds (i.e. in the bottom 50%), respectively. We apply F-test to see the difference (β1-β2)
between flow sensitivity for good and bad performance. Flow (RMB) is measured in millions and Flow,% is the Flowi,t (RMB)/TNAi,t-1. Ln TNA is the log transformation of total net assets
of fund i at the end of previous quarter. Ln age is the log transformation of age of fund i at the end of previous quarter. Age is measured in years.R2 is presented in last row. t-statistics are
We also investigate the asymmetry in fund-flow relationship by applying ordinary least squares (OLS) regression model with robust standard errors. This also serves the purpose of robustness. We use the same Equation (4) and apply OLS regression model, which is as follows:
Flowi,t (Flow,%i,t)=αt+α1Highi,[t−4,t−1]+β1RRi,[t−4,t−1]*Highi,[t−4,t−1]+
β2RRi,[t−4,t−1]*Lowi,[t-4,t-1]+β3Ln(TNA)i,t−1 + β4Ln(age)i,t−1 +µi,t (5)
Where Flowi,t (Flow,%i,t) is the net flow in RMB, millions (net flow percentage) in fund i in quarter t, RRi,[t−4,t−1] is the RR of fund i in previous 4 quarters (t−4to t−1), Ln(TNA)i,t−1 is the log of total net assets of fund i in previous quarter (i.e. t−1),Ln(age)i,t−1 is the log of age of fund i at the end of previous quarter (t−1), measured in years, and µi,t is the error term.
Table 5 presents the results of OLS regression model. Findings in Table 5 are similar to previous findings in Table 4. We find asymmetric relationship between fund flow and fund performance. In Table 5, β1−β2 s positive and is >0 (β1−β2>0) which implies that investors’ response to good performance is more sensitive than investors’ response to bad performance. This difference (β1−β2) in flow sensitivity for good and bad performance is significant at 0.1%. Good performance leads to large cash inflows into well-performing funds whereas bad performance causes little cash outflow from worst-performing funds. For robustness, we also divide the whole sample time period into two time windows. Results in these two time windows are qualitatively same and corroborate our findings in overall time period. Our results are in line with the findings of Ippolito (1992), Sirri and Tufano (1998), and Del Guercio and Tkac (2002), where they also find asymmetric flow-performance relationship in mutual fund industry.
4. CONCLUSION
The non-linearity in flow-performance relationship in mutual funds is one of the acknowledged regularity in finance literature and we re-examine this non-linearity in Chinese mutual fund market. We apply fund fixed effect and time fixed effect regression model on unbalanced panel data by using the sample of 557 Chinese equity funds for the period of 11 years. We find that there is a positive relationship between fund flow and fund past performance. We also find that size and age of fund suppress this flow-performance relationship. It is difficult for bigger and older funds to grow rapidly.
We further find that this positive relationship between fund flow and fund past performance is asymmetric. The response by investors of well-performing funds to past performance is more
sensitive than response by investors of worst-performing funds. It implies that mutual funds that have performed well in previous year get disproportionately large cash inflow in the subsequent period whereas those funds that have showed bad performance in last year, experience minimal cash outflow in the subsequent period.
5. ACKNOWLEDGEMENTS
We would like to thanks Prof. Chi Guo Hua at Dongnei University of Finance and Economics, China and Mr.Tanveer Ahsan and Mr.Muhammad Umar, PhD Scholars at Dongbei University of Finance and Economics for their valuable comments and suggestions.
REFERENCES
Bollen, N.P. (2007), Mutual fund attributes and investor behavior. Journal of Financial and Quantitative Analysis, 42(03), 683-708.
Christoffersen, S.K., Musto, D.K. (2002), Demand curves and the pricing of money management. Review of Financial Studies, 15, 1499-1524.
Del Guercio, D., Tkac, P. (2002), The determinants of the flow of funds of managed portfolios: Mutual funds versus pension funds. Journal of Financial and Quantitative Analysis, 37, 523-558.
Fant, L.F., O’Neal, E.S. (2000), Temporal changes in the determinants of mutual fund flows. Journal of Financial Research, 23, 353-371. Goetzmann, W.N., Peles, N. (1997), Cognitive dissonance and mutual
fund investors. Journal of Financial Research, 20, 145-158. Gruber, M.J. (1996), Another puzzle: The growth in actively managed
mutual funds. Journal of Finance, 51, 783-810.
Ippolito, R.A. (1992), Consumer reaction to measures of poor quality: Evidence from the mutual fund industry. Journal of Law and Economics, 35, 45-70.
Jun, X., Li, M., Shi, J. (2014), Volatile market condition and investor clientele effects on mutual fund flow performance relationship. Pacific-Basin Finance Journal, 29, 310-334.
Lynch, A.W., Musto, D.K. (2003), How investors interpret past fund returns. Journal of Finance, 58, 2033-2058.
Nanda, V., Jay Wang, Z., Zheng, L. (2004), Family values and star phenomenon: Strategies of mutual fund families. Review of Financial Studies, 17, 667-698.
Rao, Z., Tauni, M.Z., Iqbal, A. (2015), Comparison between Islamic and general equity funds of Pakistan: Difference in their performances and fund flow volatility. Emerging Economy Studies, 1(2), 211-226. Shefrin, H., Statman, M. (1985), The disposition to sell winners too early
and ride losers too long: Theory and evidence. Journal of Finance, 40, 777-790.
Shrider, D.G. (2009), Does size matter? An analysis of mutual fund transaction size. Journal of Money Investment and Banking, 7, 29-42. Sirri, E., Tufano, P. (1998), Costly search and mutual fund flows. Journal