The Effect of Problem-Based Learning on Learning
Outcomes of Accounting Students
Chih-shun Hsu
Department of Accounting, Tamkang University
No.151, Yingzhuan Rd., Tamsui Dist., New Taipei City 25137, Taiwan (R.O.C.)
E-mail: [email protected]
Sin-hui Yen
Department of Accounting, Tamkang University
No.151, Yingzhuan Rd., Tamsui Dist., New Taipei City 25137, Taiwan (R.O.C.)
E-mail: [email protected]
Wei-hung Lai (The corresponding author)
Graduate Institute of Management Sciences in Accounting Section, Tamkang University
No.151, Yingzhuan Rd., Tamsui Dist., New Taipei City 25137, Taiwan (R.O.C.)
E-mail: [email protected]
Received: August 19, 2016 Accepted: Nov. 1, 2016 Published: December 1, 2016
doi:10.5296/ajfa.v8i2.9917 URL: http://dx.doi.org/10.5296/ajfa.v8i2.9917
Abstract
literature related to the application of PBL in accounting education and presents five suggestions to facilitate further research in such applications.
Keywords: Problem-based Learning, Learning Outcomes, Experimental research,
1. Introduction
Accounting educators and practitioners have been calling for reorientation in the content and delivery of accounting curriculum (AAA, 1986; AECC, 1990; AICPA, 1999; Wells, 2011). Their response has suggested that accounting students should be encouraged to be more active and independent and prepare themselves for lifelong learning. They also pointed out the need for a shift in the design of accounting curriculum from content-based to competency-based.
One possible response to calls for reform would be the adoption of problem-based learning (PBL). Milne and McConnell (2001) and Johnstone and Biggs (1998) both advocated the incorporation of PBL into accounting education.
Unlike traditional teacher-led instruction, PBL places the primary emphasis on active learning. Through teamwork, students collectively gather, interpret, and analyze data as they seek answers and construct their own meaningful knowledge systems. PBL moves beyond knowledge-oriented teaching by emphasizing competence-oriented teaching with the aim of enhancing independent-learning abilities, teamwork, and the integration of knowledge as well as problem-solving skills, critical thinking, and lifelong learning capacity. PBL emphasizes situational teaching (contextual learning) based on lesson plans designed to expose students to actual problematic situations. Students can then learn how to integrate knowledge into their analysis and solving problems endeavors (Yang, 2012).
This study attempts to investigate the relationship between the PBL method and learning outcomes in an accounting course. Our objective in this exploratory study was to compare traditional teaching methods with the PBL method using an experimental design.
Unlike previous studies (Stanley and Marsden 2012; Giguere, 2006; Milne and McConnell, 2001), we adopted an experimental approach with pre-tests and post-tests in conjunction with an open-ended qualitative questionnaire to explore the effects of PBL on students’ learning outcomes. This approach using objective exam scores to gauge learning outcomes in conjunction with the subjective views of the students is rare in existing research. We therefore administered an after-class questionnaire survey to elucidate the subjective feelings of students and their degree of acceptance for this form of teaching.
Our results demonstrate that the learning outcomes of students in the PBL accounting course (experimental group) were superior to those in the control group. Further analysis of student attributes revealed the improvements of male students were more pronounced than those of female students, and male students who had passed the elementary accounting review exam improved more than those who had not passed. In the after-class survey, students in the experimental group reported that PBL encouraged self-direct learning, and promoted their ability to think and learn independently.
future researchers.
The remainder of this paper is organized as follows: Section 2 provides a review of the literature related to learning outcomes, the application of PBL to accounting education, and the formulation of our hypotheses in this research. Section 3 describes the research method, including the experiment design and survey on the perceptions of PBL students and the results are presented in Section 4. Section 5 summarized and concludes the study.
2. Literature review
2.1 Teaching Models of PBL
Barrows (1985) described how the basic model of PBL involves a teacher giving students a series of problems based on a particular theme. The students then engage in self-study via situated learning before participating in group discussion, or engage in group discussion to achieve consensus prior to self-study. Teacher-student discussion is used to deepen the understanding of at the individual level before sharing the results with other groups during class (Barrows, 1985; Barrows and Tamblyn, 1980).
Researchers have proposed modifications to PBL model based on their personal opinions or individual circumstances; however, even these modifications tend to follow the underlying principles upon which the PBL model was devised. Breton (1999) implemented a 10-step problem solving methodology while Tan (2003) used a 7-step PBL process. Although PBL follows many different processes in a course or curriculum (Debessay, 2003), its implementation must take into consideration teaching skills, familiarity with the PBL model, conciseness and feasibility, as well as investment time and other factors. Stanley and Marsden (2012) developed FRIDE (see Table 1), a model that uses a five-step problem-solving process to make it easier for students through shared discussions, listening exercises, encouraging respect for the ideas of peers, and interaction with fellow team members. This approach is suitable for students new to PBL and helps them to improve their communication and problem-solving skills, as well as enhancing their learning outcomes (Stanley and Marsden, 2012).
Hong (2004) argued that the choice of teaching mode is contingent on student ability and the depth of the problem. PBL is effective because teachers are able to combine various teaching methods and strategies within the system. Teachers should seek to tailor PBL teaching methods according to specific educational goals (Barrows, 1985; 1986; 1996). Using Barrow’s PBL model as a framework, Hong (2001; 2004) sought to achieve the advantages of traditional teaching by developing a hybrid PBL model. His model has operation processes such as student self-study; small panel discussions, discussions with teacher, small panel reconvene, and class discussions in groups.
2.2 PBL and Learning Outcomes
traditional teaching approaches. They established four categories based on the assessment of learning outcomes: (1) Non-performance, non-skill-oriented and non-knowledge-based assessment (2) knowledge assessment (3) performance or skill-based assessment (4) mixed knowledge and skill-based assessment.
Table 1. FIRDE PBL Approacha
Step Action
Facts Define the problem, gather Facts and ask relevant probing questions Ideas Generate Ideas and consider alternatives
Research Research each issue pertaining to the problem Decide Collaborate, share ideas and make a Decision
Execute Communicate the decision to the client and/or Execute the chosen option Note (a): Stanley, T. and Marsden, S. 2012. Problem-based learning: Does accounting education need it? Journal of Accounting Education, 30, p. 273
Strobel and van Barneveld (2009) indicated that PBL is positively associated with learning outcomes in the first category of the assessment, including measures of student satisfaction. Vernon and Blake (1993) found that PBL is significantly superior to the traditional teaching method with regard to program evaluations. They found PBL students were less prone to depression, anxiety, hostility and somatic complaints than were their traditional counterparts.
In the second category, the knowledge assessment includes short-term knowledge acquisition (i.e., true/false questions, multiple choice questions) as well as long-term knowledge retention (i.e., short answers, essay questions, and free recall). Although the previous studies of knowledge assessment produced mixed results, Gijbels et al. (2005) claimed that traditional teaching methods favor short-term knowledge, while the PBL appears to be more effective in the long-term retention of knowledge and know-how (Strobel and van Barneveld, 2009).
The relationship between PBL and learning outcomes is significant and positive, particularly when using standardized rating scales for the evaluation of student performance (Gijbels et al., 2005; Strobel and van Barneveld, 2009). This does not appear to vary whether the evaluations are made during or at the end of the term by the supervisor (performance or skill-based assessment), or if the students are assessed by the oral examinations or case-based examinations (mixed knowledge and skill-based assessment).
long-term. In 2000, Giguere (2006) implemented PBL in a cost accounting course, in which it was found that the learning outcomes of PBL students were significantly better than those of students using the conventional approach to cost accounting (as rated using semester grade point averages).
Milne and McConnell (2001) adopted PBL in accounting education, using a case study approach as an incentive for students to acquire new knowledge in order to grant them the freedom to learn and develop on their own, and in so doing promote their independent learning ability. In a case discussion of foundation courses in accounting information systems, Heagy and Lehmann (2005) performed an investigation into the use of PBL using high school graduates as well as students still enrolled in school. No significant differences were observed between traditional or PBL teaching pedagogies with regard to learning results. It was also pointed out that PBL does not necessarily adversely affect access to basic knowledge and tends to promote the satisfaction of learners.
Stanley and Marsden (2012) adopted a novel Accountancy Capstone unit. From the562students enrolled over seven semesters, 481 filled out questionnaires. The quantitative and qualitative data collected from these questionnaires revealed that these students generally found PBL to be effective, particularly in terms of developing skills in questioning, teamwork, and problem solving.
Despite these findings and the widespread use of PBL, it was found that experimental research on the application of PBL to accounting education is very limited, particularly with regard to outcomes. To the best of our knowledge, only two studies used experimental methodology in this area (Heagy and Lehmann, 2005; Breton, 1999).
Through the implementation of PBL, collaborative learning can be used to guide students in the gathering of information pertain to the situational learning. This also helps to teach students the importance of listening and respecting the opinions of others while developing communication and problem solving skills. Through guided participation, students learn to organize a variety of learning resources and acquire the ability to deal with complex issues similar to those they are expected to face in the future. As such, PBL can be considered a method that puts situational learning into practice. In this manner, students obtain professional knowledge in accordance with the conceptual framework of accounting and develop a deeper expertise in the basics of accounting. Based on the above discussions, we propose the following hypothesis:
H1: PBL can improve the learning outcomes of accounting students more than the traditional
teaching method.
3. Research method
3.1 Participants
Class A consisted of 55 students and functioned as a control group who received lessons based on traditional teaching methods. Class B consisted of 60 students and functioned as the experimental group who received PBL-based instruction. The Intermediate Accounting (Accounting II) course in this study was extended from Elementary Accounting (Accounting I). Both of these are required courses for all accounting students. The period of the experiment spanned 18 weeks throughout the first semesters of 2011 and 2012. Students in both groups spent four hours per week on the course. Among the total of 115 individuals, 89 were female. A total of 59 students had passed the review exam in elementary accounting, while 56 students did not. Only 25 students had work-study experience, and 47 students have experience with writing reports.
3.2 Experiment Design
We adopted a pre-test/post-test design with a control group. For the first eight weeks of the experiment, the two groups of students took the same course on Intermediate Accounting using the same teaching method with the same schedule. Students in both groups were given a midterm exam in the ninth week to evaluate the progress of students in the acquisition of accounting knowledge in the two groups. The midterm exam paper was collaboratively designed by the two participating teachers. These exam results were used to determine whether there was a significant difference between the groups with regard to an understanding of course content related to intermediate accounting.
In the second half of the experiment, the two groups were taught the same content using different teaching methods. On the 18th week (the final week of the semester), both groups of
students took the same final exam designed by an independent third party (an accounting teacher). This made it possible to observe differences in learning outcomes between the two groups. During the period of the experiment (from the 10th - 17th weeks), the students in Class B (PBL group) were divided into eight groups, each consisting of six to eight students. According to Lohman and Finkelstein (2000), this is considered the optimal size for learning groups of this type.
According to Duch (2001), the problems used for PBL are easily adapted from the cases in textbooks. Thus, we did not completely design the experimental lessons based on situational problems. Instead, we revised essay questions and cases from each unit in the existing textbooks on Intermediate Accounting. This led to three major themes, for which we designed four problems each. Thus, our modified problems also conformed to the principles of PBL.
3.3 Variables
Dependent Variables: Learning outcomes were measured either by the change in the test scores achieved in the midterm and final examinations, or percentage difference between pre-test and post-test scores.
Independent Variable: Teaching method was represented using a dummy variable in which the experimental group was identified as 1 and the control group as 0. The effect of teaching method on learning outcomes was expected to be positive (i.e., a more pronounced improvement in the learning outcomes of the experimental group than the control group).
Control Variable:
(1) Gender: Several studies have identified differences between men and women regarding their willingness to seek feedback (Fletcher, 1999; Roberson et al., 2003; Opdecam and Everaert, 2012; Zhang et. al, 2012).
(2) Elementary Accounting Review Exam Passed (EAREP): Opdecam and Everaert (2012) used the exam scores of the students prior to the experiment as a measure of their ability in accounting. Accordingly, we used whether the student passed the Elementary Accounting Review Exam as an indication of the students’ knowledge related to elementary accounting.
(3) Average Grade before Midterm (AVGBM): This variable was calculated by averaging students’ scores on the three tests prior to the midterms of Accounting II. We used this to indicate the average learning performance of the students prior to the experiment.
(4) Grade Variation (GRDVR): This variable was calculated using the variation coefficient of the scores on the Elementary Accounting Review Exam as well as the three tests prior to the midterms. We used this to measure the discrete learning ability of the students before the experiment as an indication of stability in their learning performance.
(5) Work Study Experience (WSEXP) and Writing Report Experience (WREXP): Students with work study experience or experience with writing report tend to be more sophisticated and present a higher degree of socialization, which makes their opinions more diversified. During PBL, these individuals are more likely to express distinctive ideas, participate actively in discussions, and/or be more knowledgeable regarding where to the find information required to solve problems (Zhang et al., 2012). All of the skills help to improve learning outcomes; therefore, we included them as the control variables in this study.
3.4 Perceptions of PBL Students
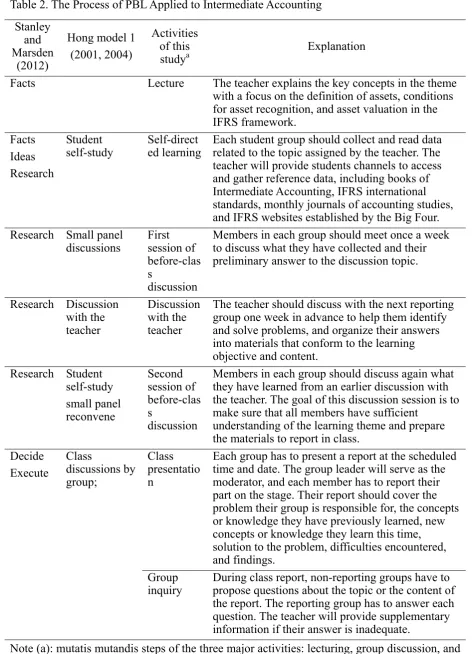
Table 2. The Process of PBL Applied to Intermediate Accounting
Stanley and Marsden
(2012)
Hong model 1 (2001, 2004)
Activities of this
studya Explanation
Facts Lecture The teacher explains the key concepts in the theme
with a focus on the definition of assets, conditions for asset recognition, and asset valuation in the IFRS framework.
Facts Ideas Research
Student
self-study Self-directed learning Each student group should collect and read data related to the topic assigned by the teacher. The teacher will provide students channels to access and gather reference data, including books of Intermediate Accounting, IFRS international standards, monthly journals of accounting studies, and IFRS websites established by the Big Four. Research Small panel
discussions First session of before-clas s
discussion
Members in each group should meet once a week to discuss what they have collected and their preliminary answer to the discussion topic.
Research Discussion with the teacher
Discussion with the teacher
The teacher should discuss with the next reporting group one week in advance to help them identify and solve problems, and organize their answers into materials that conform to the learning objective and content.
Research Student self-study small panel reconvene Second session of before-clas s discussion
Members in each group should discuss again what they have learned from an earlier discussion with the teacher. The goal of this discussion session is to make sure that all members have sufficient
understanding of the learning theme and prepare the materials to report in class.
Decide Execute Class discussions by group; Class presentatio n
Each group has to present a report at the scheduled time and date. The group leader will serve as the moderator, and each member has to report their part on the stage. Their report should cover the problem their group is responsible for, the concepts or knowledge they have previously learned, new concepts or knowledge they learn this time, solution to the problem, difficulties encountered, and findings.
Group
inquiry During class report, non-reporting groups have to propose questions about the topic or the content of the report. The reporting group has to answer each question. The teacher will provide supplementary information if their answer is inadequate.
3.4.1 Post-class Impressions Assessed Using Statements
This consisted of 7 statements to be rated using a scale from 1 to 7 (1 for strongly disagree and 7 for strongly agree). These statements were meant to measure the post-class perceptions of participants learning outcomes. Each respondent could assign a score ranging from a low of 7 to a high of 49. The expected score was 28. The Cronbach’s alpha coefficients were 0.704 respectively. The value exceeded 0.70, which indicates a high degree of reliability.
3.4.2 Open-ended Questionnaire
This section included three questions. Content analysis was applied to the students’ responses in order to identify key phrases in their answers to each question.
Question 1: What is the main factor that makes PBL suitable for application in the Intermediate Accounting course? What is the main factor that makes it unsuitable?
Question 2: What are the main strengths and main weaknesses of the PBL course you took last semester?
Question 3: How could the PBL course be further improved?
4. Results
4.1 Descriptive Statistics
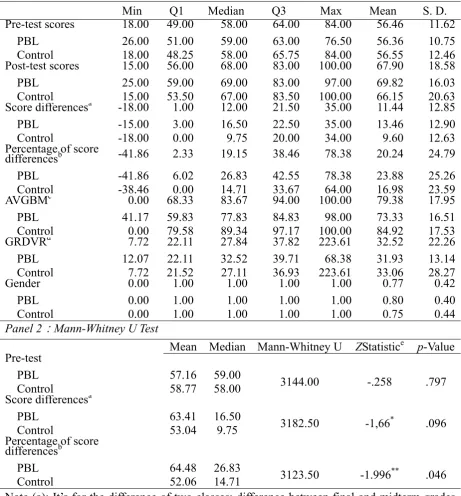
Panel 1 in Table 3 lists the descriptive statistics of the experimental and control groups with regard to the pre-test, post-test, score differences, percentage of score differences, average grade before midterm(AVGBM), Grade variation(GRDVR), gender, including Q1, Q3, median, maximum, minimum, average, and standard deviation. The Q1, Q3, median, maximum, and minimum of the pre-test scores of the two groups shows that they do not differ significantly, and no skewness is apparent.
The mean pre-test scores are as follows: PBL group (experimental) 56.36 (S.D. =10.75) and Control group 56.55 (S.D. =12.46). Following completion of the experimental instruction, the mean post-test scores are as follows: PBL group (experimental) 69.82 (S.D. =16.03) and Control group 66.15 (S.D. =20.63). The mean AVGBM scores are as follows: PBL group (experiment) 73.33 (S.D. =16.51) and Control group 84.92 (S.D. =17.53). The mean GRDVR scores are as follows: PBL group (experimental) 31.93 (S.D. =13.14) and Control group 33.06 (S.D. =28.27).
4.2 PBL and Learning Outcomes
4.2.1 Mann-Whitney test
Panel 2 in Table 3 presents Mann-Whitney test results in the form of pre-test scores1, score differences, and percentage of score differences between the two groups. As the score difference may not conform to the normal distribution assumption, the nonparametric Mann-Whitney test is more appropriate to adopt for the sound analysis. The results indicate
that the difference in pre-test scores is not significant. This suggests that no significant differences existed between the two groups with regard to accounting knowledge prior to the experiment.
However, after the experiment, significance differences were observed with regard to the extent of improvement, which validates our hypothesis. The difference in scores shows only the absolute difference between the data obtained in the two periods, whereas the percentage of score difference standardizes the base period (midterm exam) using the same frame of reference, thereby eliminating the size-effect and thus enabling a comparison of the magnitude of difference based on this standard.
Meanwhile in the panel 1 of Table 3, for the PBL and the control group, respectively, the mean of the score difference is 13.46 (S.D.=12.90) and 9.6 (S.D.=12.63), while mean of the percentage of score differences is 23.88% (S.D. =25.26) and 16.98% (S.D. =23.59). Mann-Whitney results show the significant difference between the PBL group and control group in term of the score difference and percentage of score difference. This implies that the adoption of PBL can have a significant influence on learning outcomes.
4.2 PBL and Learning Outcomes
4.2.1Mann-Whitney test
Panel 2 in Table 3 presents Mann-Whitney test results in the form of pre-test scores, score differences, and percentage of score differences between the two groups. As the score difference may not conform to the normal distribution assumption, the nonparametric Mann-Whitney test is more appropriate to adopt for the sound analysis. The results indicate that the difference in pre-test scores is not significant. This suggests that no significant differences existed between the two groups with regard to accounting knowledge prior to the experiment.
However, after the experiment, significance differences were observed with regard to the extent of improvement, which validates our hypothesis. The difference in scores shows only the absolute difference between the data obtained in the two periods, whereas the percentage of score difference standardizes the base period (midterm exam) using the same frame of reference, thereby eliminating the size-effect and thus enabling a comparison of the magnitude of difference based on this standard.
Table 3. Descriptive Statistics for Univariate t-test
Panel 1:Descriptive Statistics
Min Q1 Median Q3 Max Mean S. D.
Pre-test scores 18.00 49.00 58.00 64.00 84.00 56.46 11.62
PBL 26.00 51.00 59.00 63.00 76.50 56.36 10.75
Control 18.00 48.25 58.00 65.75 84.00 56.55 12.46
Post-test scores 15.00 56.00 68.00 83.00 100.00 67.90 18.58
PBL 25.00 59.00 69.00 83.00 97.00 69.82 16.03
Control 15.00 53.50 67.00 83.50 100.00 66.15 20.63
Score differencesa -18.00 1.00 12.00 21.50 35.00 11.44 12.85
PBL -15.00 3.00 16.50 22.50 35.00 13.46 12.90
Control -18.00 0.00 9.75 20.00 34.00 9.60 12.63
Percentage of score
differencesb -41.86 2.33 19.15 38.46 78.38 20.24 24.79
PBL -41.86 6.02 26.83 42.55 78.38 23.88 25.26
Control -38.46 0.00 14.71 33.67 64.00 16.98 23.59
AVGBMc 0.00 68.33 83.67 94.00 100.00 79.38 17.95
PBL 41.17 59.83 77.83 84.83 98.00 73.33 16.51
Control 0.00 79.58 89.34 97.17 100.00 84.92 17.53
GRDVRd 7.72 22.11 27.84 37.82 223.61 32.52 22.26
PBL 12.07 22.11 32.52 39.71 68.38 31.93 13.14
Control 7.72 21.52 27.11 36.93 223.61 33.06 28.27
Gender 0.00 1.00 1.00 1.00 1.00 0.77 0.42
PBL 0.00 1.00 1.00 1.00 1.00 0.80 0.40
Control 0.00 1.00 1.00 1.00 1.00 0.75 0.44
Panel 2:Mann-Whitney U Test
Mean Median Mann-Whitney U ZStatistice p-Value Pre-test
PBL 57.16 59.00
3144.00 -.258 .797
Control 58.77 58.00
Score differencesa
PBL 63.41 16.50 3182.50 -1,66* .096
Control 53.04 9.75
Percentage of score differencesb
PBL 64.48 26.83 3123.50 -1.996** .046
Control 52.06 14.71
Note (a): It’s for the difference of two classes: difference between final and midterm grades (i.e., final minus midterm).
(b): It’s for the difference of two classes: percentage difference between final and midterm grades (i.e., final minus midterm, divided by midterm grade).
(c) AVGBM: represents the average scores in the 3 tests before the mid-term exam of intermediate accounting.
(d) GRDVR: represents the variation coefficient of the scores on the elementary accounting review exam and the 3 tests before the mid-term exam of intermediate accounting.
Sample size is 55 for PBL group and 60 for Control group.
4.2.2 Regression Analysis and Learning Outcomes
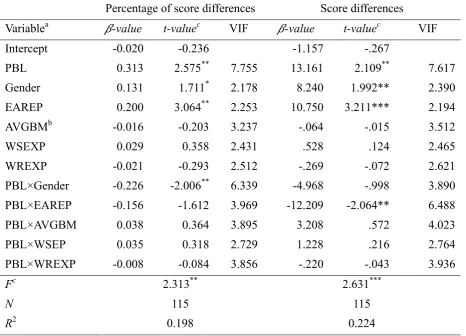
Panel 1 in Table 4 presents our regression analysis of the learning outcomes. Both by percentage of score difference and score differences as the dependent variable, our results indicated that PBL can have a significant and positive effect on learning outcomes. In other words, the adoption of PBL improved student performance in Accounting II, which our hypothesis that PBL-based lessons could improve the learning outcomes of accounting students.
In addition, female students displayed learning achievements superior to those of their male counterparts. Furthermore, students that had passed the Elementary Accounting Review Exam outperformed those who had not passed. In terms of the interaction effects between PBL and student attributes, our results revealed that gender moderates the relationship between PBL and learning outcomes (t=-2.006, p<0.05) under the learning outcome measured by the percentage of score differences.
We then segmented the data according to gender and investigated the influence of PBL on the learning outcomes in the two groups (see Panel 2 in Table 4). Our results indicate that the positive effects of PBL are more apparent in the learning outcomes of male students than that of female students (t=2.297; 2.120, p<0.05), regardless of whether we used percent difference or score difference. Furthermore, the positive effects of PBL are more apparent among male students that had passed the Elementary Accounting Review Exam than those who had not (t=2.202; 3.072, p<0.05).
4.3 After-class Perceptions Based on Student Statements
We distributed qualitative after-class surveys to students in the experimental group in order to capture their subjective impressions and their degree of acceptance toward PBL implementation. The survey consisted of two sections: declarative statements to evaluate student impressions related to the PBL course and open-ended questions to collect comments and suggestions regarding the implementation of PBL in the Intermediate Accounting course.
Table 4. Learning Outcome Differences
Panel 1:The overall sample
Percentage of score differences Score differences
Variablea ߚ-value t-valuec VIF ߚ-value t-valuec VIF
Intercept -0.020 -0.236 -1.157 -.267
PBL 0.313 2.575** 7.755 13.161 2.109** 7.617
Gender 0.131 1.711* 2.178 8.240 1.992** 2.390
EAREP 0.200 3.064** 2.253 10.750 3.211*** 2.194
AVGBMb -0.016 -0.203 3.237 -.064 -.015 3.512
WSEXP 0.029 0.358 2.431 .528 .124 2.465
WREXP -0.021 -0.293 2.512 -.269 -.072 2.621
PBL×Gender -0.226 -2.006** 6.339 -4.968 -.998 3.890
PBL×EAREP -0.156 -1.612 3.969 -12.209 -2.064** 6.488
PBL×AVGBM 0.038 0.364 3.895 3.208 .572 4.023
PBL×WSEP 0.035 0.318 2.729 1.228 .216 2.764
PBL×WREXP -0.008 -0.084 3.856 -.220 -.043 3.936
Fc 2.313** 2.631***
N 115 115
Panel 2:Subsample by gender (with no interaction between PBL and control variables)
Percentage of score differences Score differences
Female Male Female Male
Variablesa ߚ-value t-valuec VIF ߚ-value t-valuec VIF ߚ-value t-valuec VIF ߚ-value t-valuec VIF Intercept 0.093 1.478 0.089 1.015 5.172 1.494 2.475 0.593
PBL 0.041 0.724 1.379 0.235 2.297** 1.396 1.069 0.342 1.482 10.312 2.120** 1.396
EAREP 0.102 1.931* 1.175 0.226 2.202** 1.429 6.796 2.471** 1.145 14.986 3.072*** 1.429
AVGBMb 0.043 0.733 1.284 -0.161 -1.596 1.355 3.577 1.134 1.330 -5.734 -1.196 1.355
WSEXP 0.075 1.330 1.035 -0.349 -1.988* 1.202 2.256 0.762 1.045 -15.279 -1.826* 1.202
WREXP 0.001 0.013 1.249 -0.107 -1.128 1.162 1.036 0.349 1.282 -4.597 -1.020 1.162
Fc 1.773 4.802*** 2.132* 5.727***
N 89 26 89 26
R2 0.097 0.546 0.118 0.589
Note (a): Variable definition: PBL (1 for experimental group, 0 for control group), Gender (1 for female, 0 for male), EAREP (1 for passed, 0 for failed), AVGBM (average scores in the 3 tests prior to mid-terms), WSEXP: (1 for students with work-study experience, 0 for none), and WREXP (1 for students with written reports experience, 0 for none).
(b) We attempt to use grade variation (GRDVR) in place of average grade (AVGBM) in the regression model. Unfortunately, the result is not statistical significance and its VIF value of the GRDVR is 10.257, greater than 10. Therefore, we exclude the GRDVR variable from the regression model.
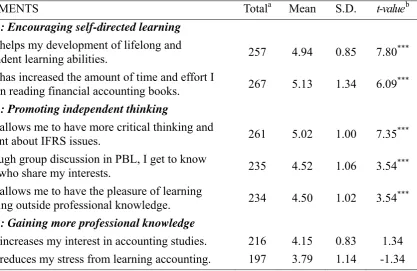
Table 5. PBL Students’ Perceptions about Learning Outcomes
STATEMENTS Totala Mean S.D. t-valueb
Panel 1: Encouraging self-directed learning
1. PBL helps my development of lifelong and
independent learning abilities. 257 4.94 0.85 7.80
***
2. PBL has increased the amount of time and effort I
spend on reading financial accounting books. 267 5.13 1.34 6.09
***
Panel 2: Promoting independent thinking
1. PBL allows me to have more critical thinking and
judgment about IFRS issues. 261 5.02 1.00 7.35
***
2. Through group discussion in PBL, I get to know
people who share my interests. 235 4.52 1.06 3.54
***
3. PBL allows me to have the pleasure of learning
something outside professional knowledge. 234 4.50 1.02 3.54
***
Panel 3: Gaining more professional knowledge
1. PBL increases my interest in accounting studies. 216 4.15 0.83 1.34 2. PBL reduces my stress from learning accounting. 197 3.79 1.14 -1.34
Note (a): Using 7 points of the Likert Scale (7=strong agreement, 6=agreement, 5=less agreement, 4
=inconclusive, 3=less disagreement, 2=disagreement, 1=strong disagreement),The total scores is the sum of the response score from the 52 students
(b) It denotes *:p< 10%, **: p < 5%, ***: p < 1%. Sample size is 52.
5. Conclusion and suggestions
This study addressed the reforms called for by accounting professionals and practitioners of accounting education to improve the quality of accounting education. We employed an experimental approach to the study of PBL within the context of a course on Intermediate Accounting at the University level. The PBL teaching mode used in this study was a combination of FIRDE, proposed by Stanley and Marsden (2012), and Hong’s (2001) PBL operation mode. Our findings indicate that PBL can significantly improve learning outcomes. Gender was shown to influence learning outcomes as was whether the student had passed the Elementary Accounting Review Exam. The improvements of male students were more pronounced that than those of female students. Furthermore, male students that had passed the Elementary Accounting Review Exam performed better than those who had not.
abilities. The profession of accounting requires of its employees the ability to identify problems, seek information, make decisions, and acquire documentation. PBL learning appears to be right on target in helping students develop the skills that will enhance their future competitiveness in the workplace.
In the following, we provide concrete suggestions for accounting educators wishing to apply PBL to a curriculum in accounting, or for researchers interested in the implications of PBL for future study:
(1) Provide sufficient explanations about PBL prior to implementation.
(2) Use lecture-based and PBL approaches alternately and adjust the teaching approach according to the feedback from students.
(3) Use real-world problems moving from easier to harder. Guide students in the
identification of problems and seek to induce their interest in order to reduce their resistance to this new approach.
(4) Use one example topic to familiarize students with the steps of PBL. Give students more time for preparation and discussion, and reduce the frequency of reporting to an appropriate level. Build an online sharing platform that provides references for problem discussion.
(5) Use diverse evaluation methods, including teacher assessment, student self-evaluation, and peer evaluation. Tests can be essay questions or exercises of practical problems.
References
Accounting Education Change Commission, & American Accounting Association. (1990). Objectives of education for accountants: Position statement no. one. Position and issues statements of the Accounting Education Change Commission(Accounting Education Series, (13). Sarasota, FL: Author.
American Accounting Association (AAA). (1986)’ Future accounting education: preparing for the expanding profession: Bedford committee on the future structure, content, and scope of accounting education’, Issues in Accounting Education, 1(1), 168-195.
American Institute of Certified Public Accountants. (AICPA). (1999). AICPA core competency framework for entry into the accounting profession.
Barrows, H. S., & Tamblyn, R. M. (1980). Problem-based learning: An approach to medical education. Springer Publishing Company.
Barrows, H. S. (1985). How to design a problem-based curriculum for the preclinical years (8)? Springer Pub Co.
Barrows, H. S. (1986). A taxonomy of problem‐based learning methods. Medical education, 20(6), 481-486.http://dx.doi.org/10.1111/j.1365-2923.1986.tb01386.x
Barrows, H. S. (1996). Problem‐based learning in medicine and beyond: A brief overview.
New directions for teaching and learning, 1996(68), 3-12.
http://dx.doi.org/10.1002/tl.37219966804
Breton, G. (1999). Some empirical evidence on the superiority of the problem-based learning
(PBL) method. Accounting Education, 8(1), 1-12.
http://dx.doi.org/10.1080/096392899331008
Debessay, A. (2003)’ Application of problem-based learning in accounting’, The Accounting Educator Newsletter of the Teaching and Curriculum Section of the American Accounting Association, 12(2),1-7.
Duch, B. J. (2001) Models for problem-based instruction in undergraduate courses, In B. J. Duch, S. E. Groh, and D. E. Alen (Eds.), The power of problem –based learning−A practical “How to” for teaching undergraduate courses in any discipline. Sterling: Stylus Publishing, LLC.
Fletcher, C. (1999)The implications of research on gender differences in self-assessment and
360 degree appraisal, Human Resource Management Journal, 9(1), 39.
http://dx.doi.org/10.1111/j.1748-8583.1999.tb00187.x
Giguère, P. (2006). Improving the cost accounting advantage. CMA Management, 80(2), 15-17.
Heagy, C., & Lehmann, C. (2005). Is PBL an improved delivery method for the accounting curriculum? Advances in Accounting Education, 7, 221-251.
Hong, R. J. (2001) PBL Teaching Strategies. Quarterly Journal of Technological and Vocational Education, 61, 10-12.
Hong, R. J. (2004) Problem-Based learning (PBL) Teaching Strategies, Teachers World, 128, 45-48.
Johnstone, K. M., & Biggs, S. F. (1998). Problem-based learning: Introduction, analysis, and accounting curricula implications. Journal of Accounting Education, 16(3), 407-427. http://dx.doi.org/10.1016/S0748-5751(98)00026-8
Lohman, M. C., & Finkelstein, M. (2000). Designing groups in problem-based learning to promote problem-solving skill and self-directedness. Instructional Science, 28(4), 291-307. http://dx.doi.org/10.1023/A:1003927228005
Milne, M. J., & McConnell, P. J. (2001). Problem-based learning: a pedagogy for using case material in accounting education. Accounting Education, 10(1), 61-82. http://dx.doi.org/10.1080/09639280122712
Opdecam, E., &Everaert, P. (2012). Improving student satisfaction in a first-year undergraduate accounting course by team learning. Issues in Accounting Education, 27(1), 53-82. http://dx.doi.org/10.2308/iace-10217
Roberson, L., Deitch, E. A., Brief, A. P., & Block, C. J. (2003). Stereotype threat and feedback seeking in the workplace. Journal of Vocational Behavior, 62(1), 176-188. http://dx.doi.org/10.1016/S0001-8791(02)00056-8
Stanley, T., & Marsden, S. (2012). Problem-based learning: Does accounting education need
it? Journal of Accounting Education, 30(3), 267-289.
http://dx.doi.org/10.1016/j.jaccedu.2012.08.005
Strobel, J., & Van Barneveld, A. (2009). When is PBL more effective? A meta-synthesis of meta-analyses comparing PBL to conventional classrooms. Interdisciplinary Journal of Problem-based Learning, 3(1), 4. http://dx.doi.org/10.7771/1541-5015.1046
Tan, O. S. (2003). Problem-based learning innovation: Using problems to power learning in the 21st century. Thomson Learning Asia.
Vernon, D. T., & Blake, R. L. (1993). Does problem-based learning work? A meta-analysis of
evaluative research. Academic medicine, 68(7), 550-63.
http://dx.doi.org/10.1097/00001888-199307000-00015
Wells, M. J. (2011). Framework-based approach to teaching principle-based accounting standards. Accounting education, 20(4), 303-316.
Zhang, Y., Fang, Y., Wei, K. K., & Wang, Z. (2012) Promoting the intention of students to continue their participation in e-learning systems: the role of the communication environment. Information Technology & People, 25(4), 356-375.
http://dx.doi.org/10.1108/09593841211278776
Appendix 1. PBL Students’ Responses to Opened-Questions regarding Learning Outcomes
Panel 1: Encouraging self-directed learning
1. 1. PBL encourages us to be active learners. It enables us to acquire more accounting concepts than we could from books and it did not matter whether these concepts were highly important or not.
2. PBL enables us to use logic to think and learn, so we can gain a deeper impression of the learning material.
3. Everyone is responsible for motivating themselves to preview themes, divide up the labor, and learn how to prepare reports.
4. This innovative method of learning increased learning pleasure.
Panel 2: Promoting independent thinking
1. PBL is suitable for many IFRS issues. It facilitates independent thinking.
2. PBL allowed me to gain a deeper understanding of accounting procedures. I learned how to gather data to solve problems, rather than simply doing textbook exercises. 3. PBL gave me a clearer understanding of the definitions, and enabled me to escape the
conventional way of learning through the repetition of exercises.
Panel 3: Gaining more professional knowledge
1. Using PBL, I gained a deeper understanding of Intermediate Accounting content, rather than just to prepare for exams.
2. It appears easier to learn from practical, real-world cases.
3. Using PBL, I am motivated to look up international bulletins and related
extracurricular books to obtain the data that I need. This makes the learning more in-depth and gives me a much better understanding of the blind spots I encounter.