World Maritime University
The Maritime Commons: Digital Repository of the World
Maritime University
World Maritime University Dissertations Dissertations
2000
Relationship between trade imbalance and the
competitiveness of container manufacturing
industry in Vietnam
Van Truong Pham World Maritime University
Follow this and additional works at:http://commons.wmu.se/all_dissertations Part of theEconomics Commons
This Dissertation is brought to you courtesy of Maritime Commons. Open Access items may be downloaded for non-commercial, fair use academic Recommended Citation
Pham, Van Truong, "Relationship between trade imbalance and the competitiveness of container manufacturing industry in Vietnam" (2000).World Maritime University Dissertations. 142.
WORLD MARITIME UNIVERSITY
Malmö, Sweden
RELATIONSHIP BETWEEN TRADE
IMBALANCE AND THE
COMPETITIVENESS OF
CONTAINER PRODUCTION
Opportunities for developing the container manufacturing
industry in Vietnam
By
PHAM VAN TRUONG
Vietnam
A dissertation submitted to the World Maritime University in partial fulfilment of the requirements for the award of the degree of
MASTER OF SCIENCE
in
SHIPPING MANAGEMENT
2000
DECLARATION
I certify that all the material in this dissertation that is not my own work has been identified, and that no material is included for which a degree has previously been conferred on me.
The contents of this dissertation reflect my own personal views, and are not necessarily endorsed by the University.
Signature : ……….
Date : ……….
Supervised by:
Dr. Shuo Ma
Course Professor, Port and Shipping Management World Maritime University
Assessor:
Dr. Tor Wergeland
Associate Professor, Shipping Management World Maritime University
Co-assessor:
Hans Broby Hansen Director Global Sales A. P. Möller a/s
ACKNOWLEDGEMENTS
I wish to express my wholehearted appreciation and gratitude to the following persons who in one way or the other have made my study at World Maritime University a success:
To The General Director of Vietnam Sea Transport and Chartering Company (VITRANSCHART), Vo Phung Long for having the faith and confidence in me and nominating me to the Shipping Management course at the World Maritime University;
To the people behind The Carl Duisberg Gesellschaft e.V. (CDG) of Germany for their generosity in granting my fellowship for this study;
To my supervisor, Course Professor. Shuo Ma for being supportive in the preparation of this paper; and to all Professors and Lecturers who have given solid knowledge in maritime field to me;
To the staff of the WMU Library for their patience and never fading smile when assisting me in the search for books and other materials; and Teachers of English for improving my English;
To my wife Nguyen Kim Oanh, who had to manage and undergo the hardships alone for this time;
To my parents and other family members, who encourage and support me to realise my ideal;
To all my colleagues and other fellow students whose togetherness has been a source of strength all along;
ABSTRACT
Title of Dissertation: Relationship between Trade Imbalance and The Competitiveness of Container Production
- Opportunities for developing the container manufacturing industry in Vietnam
Degree: M.Sc.
The serious effects of trade imbalance have significantly impacted the container shipping industry, and it has forced container carriers to spend a huge amount of money for repositioning large volumes of empty containers among locations in the world. A question frequently asked is how container carriers could minimise container costs, particularly container repositioning costs?
This dissertation concentrates on the development and imbalance of trade, and the impacts of container imbalance problems on the container transport industry.
Trade imbalance, its relationship with the competitiveness of container production, forecasting demands and supply for containers is carefully considered. Especially, from the container logistics point of view, the competitive advantages of Southeast Asian countries for container manufacturing in this region have been analysed.
Finally, a brief look is taken at the competitive advantages of Vietnam in developing the container-manufacturing industry in Vietnam. The benefits of Vietnam in producing new containers as well as container carriers in minimising container costs have been presented.
TABLE OF CONTENTS
Declaration ii
Acknowledgements iii
Abstract iv
Table of Contents vi
List of Tables x
List of Figures xii
List of Abbreviations xiii
1 Introduction
2 International containerisation and the container imbalance problem
2.1 Development of trade and International containerisation 2.2 Global liner shipping market, the container imbalance problem and its impacts on the container transportation industry
2.2.1 Global liner shipping market
2.2.2 Container imbalance and its impacts on the container transport industry
3 The competitiveness of container production and its relationship with trade imbalance
3.1 The European container manufacturing industry 3.2 The Asian container manufacturing industry
3.2.1 Northern Asia
3.2.2 South East Asia and other Asian regions
3.3 The Americas and other regional container
1
4
4
7 7
8
14
manufacturing industry
4 Forecasting demand and supply for containers – new logistics concept
4.1 Forecasting demand for containers
4.1.1 World containerised cargo development
4.1.2 TEU capacity of the world fleet, mean ship’s capacity and number of ships
4.1.3 Ship service interval and container turnover time 4.1.4 Space utilisation ratio and container off service
for repair 4.2 Supply of containers
4.3 New logistics concepts – supply of containers
5 South East Asia – a location for container manufacturing
5.1 Container trade development and container imbalance in South East Asia
5.1.1 Container trade development 5.1.2 Container imbalance forecasting
5.2 Considering the competitive advantages of South East Asia in container manufacturing
5.2.1 Land factor 5.2.2 Labour factor 5.2.3 Capital factor
5.2.4 Technological factor 5.3 Container logistics costs
5.3.1 Transportation costs 5.3.2 Warehousing costs
5.3.3 Order Processing/ Information systems costs 5.3.4 Lot quantity costs
5.3.5 Inventory carrying costs
6 Opportunities for developing the container manufacturing industry in Vietnam
6.1 Containers trade development and container imbalance – Considering demand for export containers in Vietnam 6.1.1 Container trade development
6.1.2 Containers imbalance forecasting - export container demand
6.2 Considering sources of competitive advantages and disadvantages of Vietnam in container manufacturing 6.2.1 Geographical condition
6.2.2 Technology 6.2.3 Labour force 6.2.4 Capital
6.2.5 Raw materials
6.2.6 Regional and Bilateral Agreements 6.3 Benefits derived from the container production
7 Conclusion and Recommendation
7.1 Conclusion 7.2 Recommendation 45 46 47 48 48 48 51 53 53 53 54 56 57 58 59 62 62 64
References 67
Appendices
LIST OF TABLES
Table 2-1 Volume forecast per region 5
Table 2-2 World container traffic – 1984 to 1997 8
Table 2-3 Container imbalance through cargo movements on the three major liner trade routes for 1995-1998 and forecasts for 1999-2000
9
Table 2-4 The FEFC’C growing EAST/WEST imbalance (TEU) 12
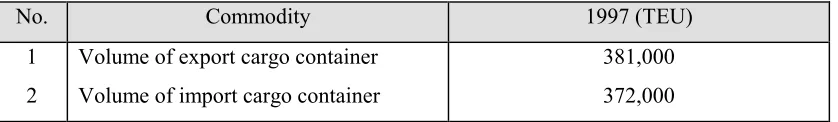
Table 2-5 The container volumes of export-import cargo in Vietnam 13
Table 3-1 Asian container production 1997-1999 18
Table 4-1 Forecast World Container Traffic to 2016 26
Table 4-2 Ratio between container production and container traffic 26
Table 4-3 The world fleet-TEU capacity of fully cellular container ships 1995-1998 (end of year figures)
27
Table 4-4 Growth in the size of ships in the world container fleet 28
Table 4-5 World container output 1995-1999 by main country – region
32
Table 4-6 World container output 1995-1999 by main type 32
Table 5-1 Forecast World Container Port Demand to 2016 37
Table 5-2 Container traffic forecast in ASEAN 38
Table 5-3 Indicators on export performance (average growth in percentage) by country in South East Asia from 1994-1998
39
Table 5-4 Main sources of competitive advantages of container manufacturing in Southeast Asia
42
Table 6-1 Indicators on export performance by Vietnam for 1994-1998
50
Table 6-3 Benefits in the form of tax from container production 59
Table 6-4 Main sources of competitive advantages of container manufacturing in Vietnam
LIST OF FIGURES
Figure 2-1 World container movements 9
Figure 2-2 The global empty container problem 10
Figure 3-1 Ratio of container output 1997-1998 by main
country-region 15
Figure 3-2 Relationship between trade imbalance and container output from Europe 1995-1999
17
Figure 3-3 Relationship between trade imbalance and container output from Asia 1995-1999
19
Figure 3-4 Standard dry freight container prices for selected
manufacturing regions for period 1995-1999 21
Figure 3-5 Relationship between trade imbalance and container output from USA 1995-1999 for 1995-1998 and forecasts for 1999 and 2000
24
Figure 4-1 Growth of World container output 1990-1999 31
Figure 5-1 Container traffic by South East Asia from 1990-1998 and forecast for 2000-2012
37
Figure 5-2 Cost trade-offs required in marketing and logistics 43
Figure 5-3 Container output from Southeast Asia for 1995-1999 46
Figure 6-1 Total volume of container traffic 1991-1998 and
forecasting 2000-2012 in Vietnam 49
LIST OF ABBREVIATIONS
ADB Asian Development Bank
AFTA ASEAN-Free Trade Agreement
APEC Asia Pacific Economic Cooperation
APL American President Lines
ASEAN Association of South-East Asian Nations BIMCO Baltic and International Maritime Council CEPT Common Effective Preferential Tariff CIMC China International Marine Container
CIS Commonwealth of Independent States
COSCO China Ocean Shipping (Group) Company
DF Dry freight
EB/WB Eastbound/Westbound
ECR Efficient Consumer response
EDI Electronic Data Interchange
EDI Electronic Data Interchange
ERTW Equatorial-Round-The-World
FDI Foreign Direct Investment
FEFC Far East Freight Conference
GDP Gross Domestic Product
HMD Hyundai Mipo Dockyard Co., Ltd.
HPI Hyundai Precision and Industry
IFC International Finance Corporation of the World Bank ISL Institute of Shipping Economics and Logistics
ISO International Standard Organization
JIT Just-in-Time
MCI Maersk Container Industry
MFN Most-Favored Nation
MOL Mitsui OSK Lines
NAFTA North America Free Trade Association
NPX New Panamax
NYK Neptune Orient Lines
OECF Japan's Overseas Economic Cooperation Fund
OOCL Orient Overseas Container Lines
P&O Pearl and Orient Lines
QR Quick response
RTW Round-The-World
TEU Twenty- foot equivalent unit
UNCTAD United Nations Conference on Trade and Development
UNDP United Nations Development Program
US United States
US$ United States Dollars
USA United States of America
VINALINES Vietnam National Shipping Lines VINAMARINE Vietnam National Maritime Bureau
VINASHIN Vietnam Shipbuilding Industry Corporation
VSC Vietnam Steel Corporation
WB World Bank
CHAPTER 1
INTRODUCTION
Container shipping services have been developing significantly and play a key role as a central part in the global trading network, carrying about 60 percent of the value of goods ships by sea. They provide faster, more frequent and reliable transport for almost any cargo to almost any foreign destination at a predictable charge (Stopford, 1997). On the other hand, in order to satisfy the needs of global customers, the global trends of container services like globalisation, mergers and acquisition, alliances, deregulation, increasing vessel size, supply chain management and the downward trend in freight rates have become very important in the container transportation industry today. In particular, the downward trend in freight rates also plays a very important role in enhancing the competitiveness of container shipping carriers.
in the container transport services, the management of container costs is one of the important tasks of container carriers.
Trade imbalance has in recent years forced container carriers to spend a huge amount of money on repositioning empty containers. According to the estimation of Drewing Shipping Consultants, the total annual cost of empty container repositioning for container operators by sea, road and rail is around 10 billion dollars (Fairplay, July 1999). This has led to an increase of freight rates in container transport services by adding the empty container repositioning cost into container costs. Finding the best solutions to minimise the container costs, especially empty container repositioning costs, has become a key factor for container carriers to reduce the freight rates of container transport services, and by then improve their competitiveness.
This paper aims to present the impacts of trade imbalance on the container transport industry and analyse its relationship with the competitiveness of container production. Furthermore, from a new logistics point of view, considering and analysing the best location for container production will be discussed in detail. The main purpose of this study, therefore, is to study a solution for minimising the container logistics cost in the container transport services from the analysis of relationship between trade imbalance and the competitiveness of container production.
container logistics costs. Further, Chapter six will analyse the opportunities for developing the container manufacturing industry in Vietnam, especially forecasting the container imbalance- export container demand, considering sources of competitive advantages and disadvantages of Vietnam in container manufacturing and benefits of the container production in Vietnam. Lastly, Chapter seven will present some conclusions. More importantly, this chapter will contain recommendations based on the analysis and conclusions made. Those recommendations are geared towards developing the container manufacturing industry in Vietnam.
CHAPTER 2
INTERNATIONAL CONTAINERISATION AND THE CONTAINER IMBALANCE PROBLEM
2.1 Development of Trade and International Containerisation
Trade volumes are increasing. The total volume of trade and its transport are growing faster than the world’s GDP. In 1995, world output grew by 3.7 per cent, the value of trade increased by 15.4 per cent and total freight rose by 12.8 per cent (UNCTAD, 1997). In 1997, world output increased by 3 per cent and the volume of trade rose by 9.5 per cent.
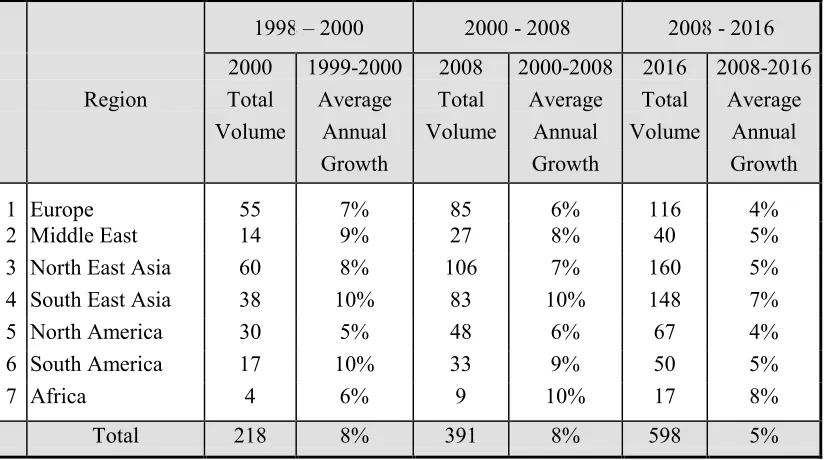
The containerised liner cargoes have been dramatically growing in recent years and will continue increasing more quickly in the first decade of the next century. The increase in containerised cargo volume will be concentrated mainly on South East Asia, Africa and South America (see Table 2-1).
Table 2-1: Volume forecast per region (million TEU)
1998 – 2000 2000 - 2008 2008 - 2016
2000 1999-2000 2008 2000-2008 2016 2008-2016
Region Total Average Total Average Total Average
Volume Annual Volume Annual Volume Annual
Growth Growth Growth
1 Europe 55 7% 85 6% 116 4%
2 Middle East 14 9% 27 8% 40 5%
3 North East Asia 60 8% 106 7% 160 5%
4 South East Asia 38 10% 83 10% 148 7%
5 North America 30 5% 48 6% 67 4%
6 South America 17 10% 33 9% 50 5%
7 Africa 4 6% 9 10% 17 8%
Total 218 8% 391 8% 598 5%
Source: Ocean Shipping Consultants Ltd., World Container Port Markets to 2012, 1999
The increasing significance of containerisation is a reflection of the chances that have occurred in the international organisation of manufacturing and production. A greater share of world output is now entering the global trade markets, largely as a result of the move to low cost offshore production zones in places such as South East Asia, China, South America, India, and Eastern Europe. A greater proportion of the cargo now moving internationally is of a manufactured or semi-manufactured nature.
market, excluding that of China, is estimated to have reached 5,7 million TEU in 1997 (UNCTAD Press Release, Feb 1998).
Containerisation is a major and increasingly important sector not only of maritime activity but also of world trade, and of the entire global industrial structure. According to Robert Woods, chairman of the Far East Freight Conference (FEFC), who believes that containerisation has been an excellent catalyst for the growth in world trade (Containerisation International, March 1999, p.49).
This process has to a large degree been facilitated by the container transport system, so that containerisation has in part created its own market. The container has thus directly helped to integrate a number of countries within the mainstream of the global economy.
The increasing integration of developing regions such as South East Asia, Latin America and the Caribbean into the global economy has led to a particularly fast rise of the containerised maritime transport of their foreign trade.
Otherwise, the globalisation of economy and the increasing unit value of transported goods have led to a growing share of containerised transport. The requirements of just-in-time delivery have also led to an increased containerisation of general cargo. In volume terms, the rate of containerisation of general cargo and the proportion shipped by liners is expected to grow to 65-75 per cent by the second decade of the next century (Hoffman, 1998).
Container shipping transport is the fastest growing market in the maritime transport sector in the past decade and will continue to grow due to the following reasons:
The expansion of containerised shipping by developing countries will continue in the coming years.
The establishment of trade liberalisation such as the Uruguay Round of the General Agreement on Tariffs and Trade, the North America Free Trade Association (NAFTA), and the ASEAN-Free Trade Agreement (AFTA), tariffs on industrial goods will be decreased and some regions will move toward more open trading regimes. This will continue producing a dramatic rise in container trade in some countries. For instance, South East Asia will grow rapidly, while mature economies in North America and Europe will be slower in the future.
Trade will be increased in higher value goods and the mode of shipment will be more affected than the overall volume. This should lead to further increase in the container share of the general cargo market.
The growth in deep-sea ship size and the subsequent increase in feeder traffic and the continuing increase in the incidence of transhipment will promote ‘induced’ growth in the level of container traffic. By 2005, transhipment is forecasted to represent 26.8 per cent of all container activity, which could equate to almost 82 million TEU of port handling moves, or 41 million TEU of feeder cargo movement (Peters, 2000).
2.2 Global liner shipping market, the container imbalance problem and its impacts on the container transportation industry
2.2.1 Global liner shipping market
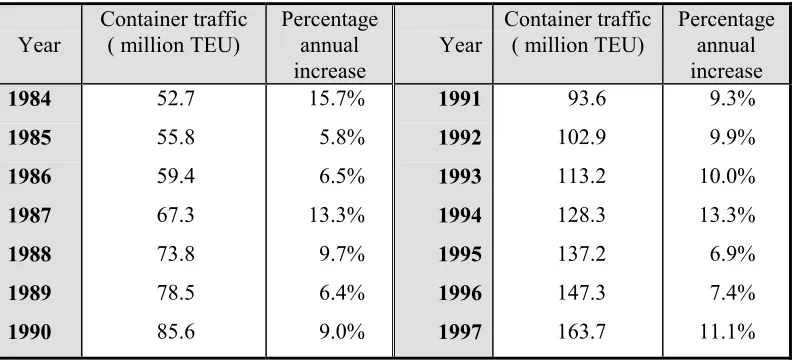
TEU in 1997, approximately by the average annual increase growth of 9.6 per cent (see Table 2-2).
Table 2-2: World container traffic - 1984 to 1997
Year
Container traffic ( million TEU)
Percentage annual increase
Year
Container traffic ( million TEU)
Percentage annual increase 1984 1985 1986 1987 1988 1989 1990 52.7 55.8 59.4 67.3 73.8 78.5 85.6 15.7% 5.8% 6.5% 13.3% 9.7% 6.4% 9.0% 1991 1992 1993 1994 1995 1996 1997 93.6 102.9 113.2 128.3 137.2 147.3 163.7 9.3% 9.9% 10.0% 13.3% 6.9% 7.4% 11.1%
Source: Containerisation International Yearbook (various issues, quoted in LSS, sub.10, p.8); DTRS (sub.3, p.6).
The main types of services are east-west, north - south and intra- regional trades. East - West trades account for around 45 per cent of world liner traffic, north - south trades make up almost 22 per cent and intra- regional trades the remaining 33 per cent (Hoffmann, 1998).
2.2.2 Container imbalance and its impacts on the container transport industry
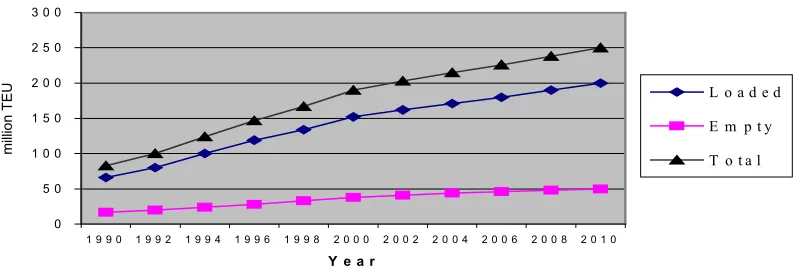
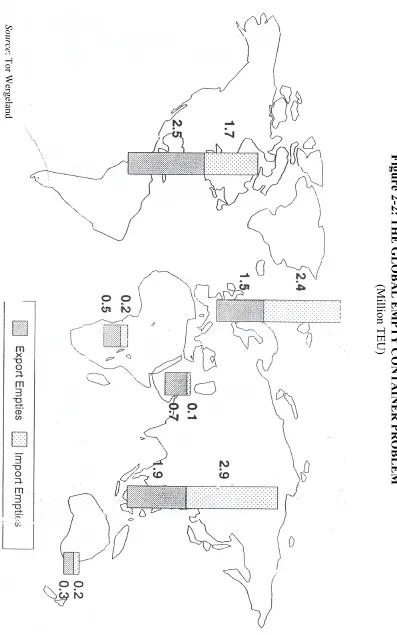
In recent years, the number of empty containers shipped has increased quickly due to imbalance in cargo movements mainly between the three major trade routes (Transpacific, Transatlantic and Asia-Europe) (see Table 2-3 and Figure 2-2). This problem would continue to happen in future (see Figure 2-1).
ocean carriers. These costs will finally pass on to existing customers who have no alternative means of transportation available. One firm of consultants estimates that ten billion dollars is the total annual cost of empty container repositioning for container operators - by sea, road and rail (Fairplay 1999, p.22). Trade imbalance not only causes immense cost of repositioning and container logistics, but has also had adverse effects on rate restoration efforts particularly in liner shipping.
Table 2-3: Container imbalance through cargo movements on the three major liner trade routes for 1995-1998 and forecasts for 1999-2000
Year Container imbalance (TEU)= import-export cargo containers
Asia Europe USA
1995 -1,066,000 288,000 778,000
1996 -1,142,000 356,000 786,000
1997 -1,603,000 276,000 1,327,000
1998 -2,672,000 408,000 2,264,000
1999 -3,120,000 544,000 2,576,000
2000 -3,421,000 522,000 2,899,000
Note: European trades do not include the Mediterranean.
Source: Review of Maritime Transport 1997 & 1999.
Figure 2-1: World container movements
Note: 2000-2010 = estimates
Source: Containerisation International Yearbook data, Containerisation International, April 1999.
0 5 0 1 0 0 1 5 0 2 0 0 2 5 0 3 0 0
1 9 9 0 1 9 9 2 1 9 9 4 1 9 9 6 1 9 9 8 2 0 0 0 2 0 0 2 2 0 0 4 2 0 0 6 2 0 0 8 2 0 1 0
Y e a r
millio
n
TEU L o a d e d
E m p t y
Figure 2-2
: THE GLOBA
L
EM
PTY
C
O
N
T
A
IN
E
R
PR
OBLEM
(M
illion TEU)
Sour
ce
: Tor W
It is estimated that the current cost of repositioning empty containers around the globe now exceeds US$25 billion per year and could exceed US$50 billion by 2010. In addition, the cost of providing further land storage and wharf facilities to accommodate these empty containers could cost billions of dollars (Jarman, 1999).
Imbalance in the container trade leaves container operators with the endless management of empty boxes. This problem has been particularly exacerbated by the Asian crisis beginning in the middle of 1997, with higher outgoing cargo from Asia and simultaneously reduced inbound cargo to Asia.
Moreover, the imbalance in container trade has forced all carriers serving these trades to pay additional operating expenses as the need for repositioning empty boxes increases. For instance, the FEFC, which covers 70 per cent of the slot capacity on the trade between Europe and Asia, provided statistics showing that eastbound volumes in the first half of 1998 were 16 per cent lower than in the same period for 1997, while the westbound shipments increased by 20 per cent. In 1998, the imbalance in cargo movements between the eastbound and the westbound is around 1.9 million TEU on the transpacific trade routes and 0.4 million TEU on the transatlantic trade route. Like the Europe-Asia trade route, trade imbalance is due to its nature. The heavy cargoes in mainly 20 foot containers have moved east, but lighter cargoes, such as electrical goods, garments and footwear, which are more suited to 40 foot and 45 foot containers, have moved west.
round trip basis an additional expenses for repositioning empty equipment was US$200 million.
Table 2-4: The FEFC’C growing EAST/WEST imbalance (TEU)
Conference/Year 1993 1994 1995 1996 1997 1998
Asia Westbound Rate Agreement 781014 848976 1070235 1357568 1532213 1923294 Japan/Europe Freight Conference 298449 296723 304677 320050 349531 409295
WB total 1079463 1145699 1374912 1677618 1881744 2332589
EB Management Agreement 840289 952815 1001386 1340521 1381884 1323433 EB/WB difference (actual) 239174 192884 373526 337097 499860 1009156 EB/WB difference (%) -22,20% -16,80% -27,20% -22,20% -26,60% -43,30%
Notes: Figures relate to conference carriers only. Year-on-year growth figures have not been calculated because of differences in conference membership between the years; The FEFC controls about 60 per cent of the total trade;
Members: APL; Compagnie Maritime d’Affretement; DSR-Senator; Egyptian International Shipping Co; Egyptian Navigation Co; Hapag-Lloyd Container Line; Hyundai Merchant Marine; K Line; Maersk; MISC; Mitsui OSK Lines; National Shipping Co of Saudi Arabia; NYK Line; OOCL; P&O Nedlloyd; Sea-Land Service; Yangming.
Source: FEFC; Containerisation International, March 1999.
Since carriers will spend millions carrying empty containers back to Asia on the transpacific trade, the repositioning costs will become a negotiating point between carriers and importers. For shippers, they were forced to pay premiums to secure space on vessels during the busy peak-shipping season. On the other hand, some carriers had to charter vessels just to carry the empties back to Asia. That move cost about one million US dollars.
Table 2-5: The container volumes of export - import cargo in Vietnam
No. Commodity 1997 (TEU)
1 2
Volume of export cargo container Volume of import cargo container
381,000 372,000
CHAPTER 3
THE COMPETITIVENESS OF CONTAINER PRODUCTION AND ITS RELATIONSHIP WITH TRADE IMBALANCE
Being a labour-intensive industry with more than three billion US dollars in annual, the freight container manufacturing industry has attracted a fast-growing number of manufacturers in low-wage countries in East Asia, particularly China (Thuong, 1997). This country has replaced South Korea as the world’s leading manufacturer of standard dry freight containers, repeating the history of the last decade when South Korea replaced Japan as the market leader. The significant growth of Chinese container producers has driven a few competitors in other countries out of the business and prompted other manufacturers to invest in offshore plants or focus on niche markets like reefer, tank and region-specific containers (Thuong, 1997). This chapter will analyse and consider the competitiveness of leading container-producing countries and its relationship to trade imbalance.
container production was also expected to increase from 6.81 per cent of global production in 1997 to 9.13 per cent in 1999, as shown in Figure 3-1.
Figure 3-1: Ratio of container output 1997-1998 by main country-region
Notes: figures include maritime and regional container types. Source: Containerisation International Market Analysis, 1999
3.1 The European container manufacturing industry
In recent years, European container manufacturers have long lost their mainstream business to the Far East. They are continuing to switch emphasis away from mainstream dry freight boxes to more specialised, higher value production such as 1997 Other 2.04% Central East Europe and CIS 4.95% Americas 2.51% West Europe 6.74% Other Asia 9.21% South East Asia
6.81% 67.74%China
the production of steel-clad container-type swapbodies, ISO standard boxes and other special designs for the European inter-modal transport market. The vast bulk of standard dry freight container orders have migrated to Asia, and to low cost producers in China or Southeast Asia, where wages are still very low and the cost of manufacture has fallen dramatically. For example, standard 20ft production repositioned from China in the middle of 1998 was available in Europe for around US$2,100-2,200, which is well below cost for the majority of local producers (WorldCargo News, July 1998).
Moreover, the import containerised cargo surplus from trade imbalance increased dramatically over the past years, from 356,000TEU in 1996 to 408,000TEU in 1998. It is forecasted to reach 544,000TEU in 1999 and 522,000TEU in 2000 (Table 2-3 in Chapter 2). This caused a large number of empty containers in Europe and by then forced all carriers to move them to the place of container demand like Asia and have to pay additional operating expensive as the need for repositioning empty containers increases. Assuming that cost for repositioning empty containers from Europe to Asia is around US$250 - US$350 per TEU, container carriers would have to spend about US$130,500,000 - US$182,700,000 in 2000 on moving these empty boxes to Asia. That is why container operators such as shipping lines and container lessors prefer to purchase new containers from the place where the demand for containers is higher, like in Asia, instead of buying them in Europe. Furthermore, this is also one of the reasons which lead to the demand reduction of container production in Europe. The volume of container output from Europe in 1999 decreased by 20.7 per cent (Containerisation International, January 1999 and 2000).
Due to the above situation, container manufacturers are building only standard boxes either in the lower cost regions of Central or Eastern Europe like Med Union Containers in Turkey, Abakanvagonmash in Russia and so on or rely on sizeable in-house production to keep them going like Maersk Container Industry (MCI).
Figure 3-2: Relationship between trade imbalance and container output from Europe 1995-1999
Notes: figures include maritime and regional container types. Source: Containerisation International Market Analysis, 1997-1999
In 1999, the total volume of container output from Europe decreased by 20 per cent and only reached 130.5 thousand TEU, compared to 164.5 thousand TEU in 1997 and 163 thousand TEU in 1998. In particular, the container output volume from Central East Europe and CIS decreased dramatically by 14.5 per cent in 1998 and 41.5 per cent in 1999 (Containerisation International, January 1999 & 2000).
-100,000 200,000 300,000 400,000 500,000 600,000
1995 1996 1997 1998 1999
Year
TEU
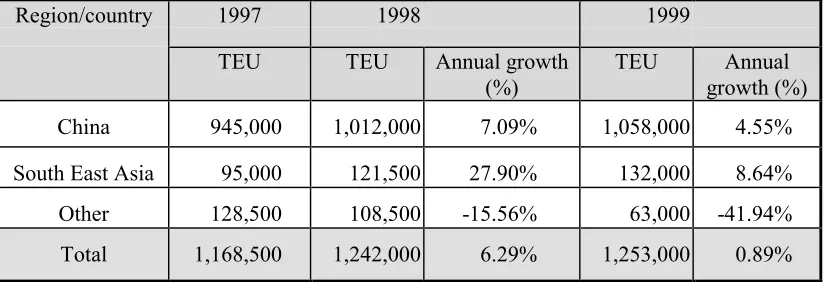
3.2 The Asian container manufacturing industry
With a share of nearly 90 per cent of global container production, Asia is regarded as the world’s leading container manufacturing location, particularly China and South East Asia.
Table 3-1: Asian container production 1997-1999
Region/country 1997 1998 1999
TEU TEU Annual growth
(%)
TEU Annual
growth (%)
China 945,000 1,012,000 7.09% 1,058,000 4.55%
South East Asia 95,000 121,500 27.90% 132,000 8.64%
Other 128,500 108,500 -15.56% 63,000 -41.94%
Total 1,168,500 1,242,000 6.29% 1,253,000 0.89%
Notes: figures include maritime and regional container types. Source: Containerisation International Market Analysis, 1999.
Container output from Asia increased by 6.29 per cent in 1998 and only 0.89 per cent in 1999. This means that it increased from 1,168,500TEU in 1997 to 1,253,000TEU in 1999 (see Table 3-1). Although the volume of container production from South Korea and Taiwan declined in 1998 and 1999, container output from China and Southeast Asia, mainly Indonesia and Thailand, still increased dramatically because of low labour cost, manufacture cost and the increase of demand for container due to container imbalance.
Figure 3-3: Relationship between trade imbalance and container output from Asia 1995-1999
Notes: figures include maritime and regional container types. Source: Containerisation International Market Analysis, 1997-1999
3.2.1 Northern Asia
In recent years, dry freight container output from North Asia has increased dramatically, mainly from Chinese container manufacturers. Entering the business in the early 1980s, Chinese container producers spent much of that decade overcoming productivity and quality problems. The number of Chinese container producers jumped from four in 1990 to nearly 30 in 1993 (Thuong, 1997). By late 1998, their number reached 40 with nearly a million TEU in capacity; among them would be half-a-dozen builders entering the reefer business for the first time and at least 30 were presently known to be active. Of these, 25 are controlled by major groups like China International Marine Container (CIMC), Jindo Corp (of South Korea), etc (Containerisation International, January 2000).
The number of Chinese container manufacturers has increased rapidly due to the following factors.
0 5 0 0 ,0 0 0 1 ,0 0 0 ,0 0 0 1 ,5 0 0 ,0 0 0 2 ,0 0 0 ,0 0 0 2 ,5 0 0 ,0 0 0 3 ,0 0 0 ,0 0 0 3 ,5 0 0 ,0 0 0
T E U
1 9 9 5 1 9 9 6 1 9 9 7 1 9 9 8 1 9 9 9
First, China is a low cost nation and has a large labour force. Moreover, a large export cargo surplus from trade imbalance in China in recent years needs to be fuelled by large volume of empty containers, more than one million TEU (Thuong, 1997).
Second, most of the leading producers have received foreign investments and technical support through FDI inflows, mainly from South Korea, Hong Kong, Taiwan, Germany and Singapore.
Third, Chinese container producers have been supported and linked vertically with material suppliers and /or leading buyers. Upstream, Chinese container manufacturers have utilised significant value of materials like roll steel and shared many common technologies and skills with industries such as shipyards (e.g. Guangzhou Shipyard Container Factory and Shanghai Shipyard Container Factory), metal fabrication and cargo handling equipment production. Downstream, leading shipping lines commonly hold equity shares and/or provide technical supply to container producers. Their participation gives them a secured supply of new container competitive prices and provides the producers with a steady container base. For instance, a few wholly Chinese-owned container plants are associated with China Ocean Shipping (Group) Company (COSCO-the country’s national shipping lines) and Sinotrans (the leading freight forwarder), these two transportation service providers are among the largest buyers of Chinese-built containers.
Fourth, recent upgrading of mainland ports has allowed direct calls by deep sea container lines at these ports, encouraged these lines and container lessors to establish of container depots in China, and boosted containerisation of export cargoes directly from the mainland.
performance, before the state-owned backer will permit production to be phased out. It is understood to be largely a question of prestige, as well as a need for the backer to recover at least some of the initial heavy investment made in the plant. As such, achieving turnover and earning foreign exchange remains the priority for some factories, ahead of purely maximising profit. This situation helps explain why Chinese container prices have been in free-fall for so long. Average prices fell by around 20 per cent throughout 1998, which compared to a drop of 15 per cent in 1996 and only 10 per cent in 1997 as shown in Figure 3-4 (Containerisation International, August 1999).
Figure 3-4: Standard dry freight container prices for selected manufacturing regions for period 1995-1999
Notes: 40ft prices cover standard 8ft 6in height (the corresponding 40ft high cube price is 5-6 per cent higher); all prices refer to ex-works delivery and largely Corten specifications
Source: Containerisation International Market Analysis, Containerisation International, August 1999
Presently, container manufacturers in China are reckoned to control more than 80 per cent of global dry freight production, while their share of world reefer output has now risen to almost 30 per cent (Containerisation International, August 1999).
0 500 1,000 1,500 2,000 2,500 3,000
M id-95 M id-96 M id-97 M id-98 End-98 M id-99
Y ear
US$
/Teu
China-south-central C hina-north Indonesia
Thailand South K orea Taiwan
On the other hand, Chinese container prices have been affected by the cost of imported raw materials like plywood, timber stock from Indonesia. For instance, the prices of Indonesian plywood has jumped from around US$420 per cubic meter late in 1998 to over US$700 by mid-1999. This has had the effect of adding more than US$100 to the cost of a 20ft container floor set, increasing it to over US$280 in 1997 (Containerisation International, August 1999).
In brief, Chinese container factories have been supported by various factors such as a near permanent surplus of capacity, low manufacturing costs, cheap finance, increased economies of scale and an acceptance of negligible profit margins or even mounting losses.
In contrast to China, South Korea and Taiwan (China) have cut back sharply their production of standard dry freight containers since the early 1990s. They were the world’s largest and second largest container producing nations, respectively, in the early 1990s. Taiwan was bypassed by China in 1992 and so was South Korea in 1993 due to rising labour wages and/or currency value at home (Thuong, 1997). They find it increasingly difficult to maintain their cost competitiveness against Chinese and Southeast Asian competitors. Instead, they now only focus on reefer containers and invest in offshore plants. For example, some South Korean container producers like Hyundai Precision and Industry (HPI) and Jindo have been active in setting up offshore production of dry freight containers, with at least 20 plants in China, South East Asia, India, Mexico and others who are low cost countries.
3.2.2 South East Asia and other Asian regions
any size is Kumbong Heavy Industries, based near Jakarta Indonesia, which has benefited from a regional boom in the demand for export containers and boosted its output to almost 90,000TEU in 1999 (Containerisation International, January 2000).
Like China, most of the leading container producers in South East Asia have also received foreign investments and technical support, mainly from South Korea. They have been linked with material suppliers and/or leading buyers. For example, the Chuan Yuan Steel Industry, Taiwan’s second largest steel producer, is also a joint venture partner in container plants in Thailand and Malaysia. Several producers (e.g. Bangkok Container Industries and Marine Container Company) feature equity participation by COSCO and Japanese business groups with shipping interests.
Being a low wage country outside East Asia, India has developed container production capacity. However, dry freight container output from this country declined rapidly from 1995-1999 due to the rapidly development of Chinese and Southeast Asian container competitors (see Table 3-1). Now there are only three container factories that are operating in India.
3.3 The Americas and other regional container manufacturing industry
As shown in above Figure 3-1, Americas container output in 1999 accounted for only 2.32 per cent of global container production, compared with 2.71 per cent in 1998 and 2.51 per cent in 1997. The reason can be explained by the decrease of container demand in USA.
made the container demand in USA decline dramatically. It is forecasted to continue increasing in the coming years from 2,576,000TEU in 1999 and 2,899,000TEU in 2000 and by then the demand for containers is expected to decrease (see Figure 3-5).
Figure 3-5: Relationship between trade imbalance and container output from USA for 1995-1998 and forecasts for 1999 and 2000
Sources: Containerisation International Market Analysis 1997-1999.
In brief, container imbalance has significantly impacted the container demand. The more the import containerised cargo surplus from trade imbalance is, the fewer the containers demand is, and vice versa.
-2 0 0 ,0 0 0 4 0 0 ,0 0 0 6 0 0 ,0 0 0 8 0 0 ,0 0 0 1 ,0 0 0 ,0 0 0 1 ,2 0 0 ,0 0 0 1 ,4 0 0 ,0 0 0 1 ,6 0 0 ,0 0 0 1 ,8 0 0 ,0 0 0 2 ,0 0 0 ,0 0 0 2 ,2 0 0 ,0 0 0 2 ,4 0 0 ,0 0 0 2 ,6 0 0 ,0 0 0 2 ,8 0 0 ,0 0 0 3 ,0 0 0 ,0 0 0 3 ,2 0 0 ,0 0 0
1 9 9 5 1 9 9 6 1 9 9 7 1 9 9 8 1 9 9 9 2 0 0 0
Y e a r
TE
U
CHAPTER 4
FORECASTING DEMAND AND SUPPLY FOR CONTAINERS - NEW LOGISTICS CONCEPT
4.1 Forecasting demand for containers
Forecasting demand for containers is one of the necessary activities required to facilitate the flow of containers from point of production to point of consumption. The following are major factors affecting the demand for containers.
4.1.1 World containerised cargo development
The significant developments in world containerised cargo has created a demand for world container production. The volume of containerised liner cargo has been dramatically increasing in the coming years because of the significant increase of manufacturing cargo trade.
containerised cargo traffic would be mainly concentrated on the South East Asia, North East Asia, Europe and North America.
Table 4-1: Forecast World Container Traffic to 2016
Year 1997 1998 2000 2004 2008 2012 2016
Million TEU 176 188 218 301 393 492 598
Source: Ocean Shipping Consultants Ltd., World Container Port Markets to 2012, 1999.
The annual average ratio between total world container output and containerised cargo volume was around 0.8 to 1.1 percent over the past years (see Table 4-2). This ratio is also one of the necessary factors to estimate the annual volume of world container production.
Table 4-2: Ratio between Container production and Container traffic
Year Container Production ( thousand TEU)
Container Traffic ( thousand TEU)
Ratio ( %)
1990 800 87,000 0.92%
1991 920 96,000 0.96%
1992 1,130 105,000 1.08%
1993 975 115,000 0.85%
1994 1,145 129,000 0.89%
1995 1,390 145,000 0.96%
1996 1,285 158,000 0.81%
1997 1,405 175,000 0.80%
1998 1,475 188,000 0.78%
Source: Containerisation International Market Analysis and Ocean Shipping Consultants Ltd., 1999.
4.1.2 TEU capacity of the world fleet, mean ship’s capacity and number of ships
capacity of the container vessel fleet was 6 million TEU, of which cellular vessels represented 70 per cent (around 4.1 million TEU). This capacity presented an increase of 7.3 percent in the number of ships and 11.8 per cent in TEU capacity over the previous year) (see Table 4-3). According to the fleet statistics of Liner Shipping Network, by 01 March 2000 the total capacity of the world container fleet was 6,244,004 TEU with a total of 7,037 ships and in order was 801,576 TEU with a total of 274 ships.
Table 4-3: The world fleet - TEU capacity of fully cellular container ships 1995-1998 (end of year figures)
1995 1996 1997 1998
Capacity - TEU 2,720,092 3,089,682 3,632,070 4,061,653
Number of ships 1,771 1,954 2,204 2,365
Average carrying capacity per
ship 1,535 1,581 1,647 1,717
Source: Review of Maritime Transport 1999.
On the other hand, The more the mean capacity of the ships and number of ships are, the more containers are needed. The size of a container vessel has increased dramatically since the late 1960s and early 1970s (see Table 4-4). While the capacity of early container ships was less than 1,000 TEU, in 1997 the capacity of vessels greater than 4,000 TEU accounted for 15 per cent of the world container fleet. Moreover, orders for ships with capacity greater than 4,500 TEU was composed of almost 60 percent of container ship orders in that year. In future, the capacity of container ships will be greater than 6,000 TEU. These container ship types will include S-types (greater than 6,000TEU), Hyundai design (10,000TEUs), Suez Max (15,000TEUs) and Malaca Max (18,000TEUs).
several 15,000 TEU container vessels would be in operation on the biggest maritime routes.
Table 4-4: Growth in the size of ships in the world container fleet
Year Class of type Capacity (TEU)
1964-1967 1967-1972 1972-1984 1984-1995
1995-present
First generation Second generation Third generation Fourth generation
Fifth generation (post-Panamax)
1,000 1,500 3,000 4,500
6,000
Source: Trace (1998b, p.11); Hoffman (1998, figure 1)
The increase in the size of container ships is a result of the increase in world-wide demand for liner shipping and the existence of economies of vessel size. Economies of vessel size exist when the unit costs of operating a ship decrease as the size of the vessel increases. For instance, the size of the world fleet of fully cellular containerships continued to increase with an average carrying capacity per ship growing from 1,535 TEU in 1995 to 1,717 TEU in 1998 (see Table 4-3), reflecting the general need to reduce operating costs through economies of scale. This development will continue given the number of Panamax and post-Panamax presently in order. At the end of 1998, there were 219 vessels on order providing a total additional capacity of nearly 580,000 TEU, scheduled to enter into service over the next couple of years. Of which 73 ships are the Panamax and post-Panamax size, with a total capacity of around 372,000 TEU or 33 per cent (ships) and 64 per cent (capacity) of the total order book (Review of Maritime Transport, 1999, p.15).
In each market, the smaller the calling interval, the more containers are needed. Moreover, the quicker the container turnover time, the fewer containers are needed.
There are a lot of factors affecting the calling interval of ships, but two key factors, which normally influence it significantly, are the speed of the vessel and the distance between two the calling ports. Today, the average service speed of container ships is 25 knot and it seems that, at present, it is difficult to exceed a 26-knot speed without dramatically increasing running costs (essentially the fuel cost). Therefore, the calling interval is mainly based on the distance of calling ports. Fifteen years ago, most liner shipping was basis “ point A to point B” transportation. Today ship, rail and truck connections are connected at port and inland multimodal terminals under a single, door to door freight bill.
In future, the long term of liner shipping is predicted to be shaped by a fourth revolution, the revolution in service pattern. With the expansion of the Panama Canal’s lock, there will be an emergence of equatorial-round-the-world (ERTW) and a grid of supporting feeder services. This revolution involves a massive conversion of end-to-end, pendulum and traditional round-the-world (RTW) patterns into new equatorial RTWs will employ new Panamax (NPX), which will be able to maintain a service speed of 28 knots (similar to that of the newest ro-ros). At that time, the transit time to complete a full ERTW circle will be 45 days and between Asia and Europe using ERTW with two transfers (in Asia and the Gibraltar) would only be 20 days. It is considerably less than the 25 days of the present direct Asia/Europe services (Containerisation International, Dec 1999, pp.57-61).
developing in Asia, South East Asia, South America and Africa. Therefore, the number of containers which are used to transport goods inland will increase.
4.1.4 Space utilisation ratio and container off service for repair
The demand for containers also depends on space utilisation ratio and container off service for repair. The higher the space utilisation ratio, the more containers are needed for service. Likewise, the more containers off service for repair are, the more containers are needed to operate the container liner service.
Otherwise, in order to operate efficiently a container liner service, carriers are interested in calculating not only the numbers of container needed for operating in service but also the numbers of containers off service for repair. Carriers do it because they have to ensure that empty containers are always available for shippers.
4.2 Supply of containers
By the end of 1999, world container output reached a total of 1,445 thousands of TEU, which was expected to decline by only 2 per cent on that returned in 1998 due to the Asian economic crisis and was significantly above the total reported in 1997. This was also indicated by the prospect of slower trade growth (see Figure 4-1).
Figure 4-1: Growth of World container output 1990-1999
Notes: totals include maritime and regional container types
Source: Containerisation International, January 1997,1998 & 2000.
More than two thirds of total annual global container production already came mainly from manufacturers in central and southern China, represented almost one million TEU (1,058,000 TEU). It compared with 132,000 TEU built in 1999 by factories in South East Asia, 63,000 TEU coming from other Asia (mainly Taiwan, South Korea and Japan), 130,500 TEU from Europe (all parts), just 33,500 TEU from the Americas and 28,000 TEU from the other regions (see Table 4-5).
At the beginning of the 2000, in order to support continuing cargo growth in the market, such as the transpacific market, and to have all new containers in service prior to the start of the market’s peak shipping season, several of the world’s leading shipping lines placed orders for new containers. For instance, the largest order which was placed by Seoul-based Hanjin Shipping Co and its sister entity DSR- Senator Liner was 70,750 TEU of 20ft and 40ft standard dry freight boxes. These total containers are being built by Jindo in South Korea and CIMC in Shanghai and will be completed and delivered scheduled by the end of October 2000. Furthermore, K-Line has ordered 14,800 containers (6,000 x 20ft; 5,400 x 40ft; 3,000 x 40ft high cube and 400 x 45ft containers). P&O Nedlloyd and Maersk Sealand have also
-2 0 0 ,0 0 0 4 0 0 ,0 0 0 6 0 0 ,0 0 0 8 0 0 ,0 0 0 1 ,0 0 0 ,0 0 0 1 ,2 0 0 ,0 0 0 1 ,4 0 0 ,0 0 0 1 ,6 0 0 ,0 0 0
1 9 9 0 1 9 9 1 1 9 9 2 1 9 9 3 1 9 9 4 1 9 9 5 1 9 9 6 1 9 9 7 1 9 9 8 1 9 9 9
Y e a r
placed orders a combined total of 3,100 containers from HPI in Korea (Containerisation International, February 2000, p.30).
Table 4-5: World container output 1995-1999 by main country - region
Country-Region 1995 1996 1997 1998 1999
China 695,000 680,000 945,000 1,012,000 1,058,000
South East Asia 202,000 146,500 95,000 121,500 132,000
Other Asia 240,000 186,000 128,500 108,500 63,000
West Europe 86,500 85,000 94,000 105,500 96,000
Central East Europe and CIS 77,500 82,000 69,000 59,000 34,500
Americas 47,000 48,000 35,000 40,000 33,500
Other 37,500 35,500 28,500 28,500 28,000
Total 1,385,500 1,263,000 1,395,000 1,475,000 1,445,000
Notes: totals include maritime and regional container types; some 1999 totals are estimated.
Source: Containerisation International, January 1997,1998 & 2000.
Table 4-6: World container output 1995-1999 by main type
Main types of container 1995 1996 1997 1998 1999
DF standard and high cube 1,080,000 1,200,000 1,170,000 1,225,000 1,210,000
DF special 55,000 65,000 70,000 77,500 65,000
Integral reefer 85,000 76,000 92,000 95,500 87,000
Tank 15,000 12,000 17,000 15,500 12,000
Regional (Europe-North America)
28,000 33,000 46,000 61,500 71,000
Total 1,263,000 1,386,000 1,395,000 1,475,000 1,445,000
Notes: DF= dry freight; some 1999 totals are estimated.
Source: Containerisation International, January 1997,1998 and 2000.
equivalent to almost 84 per cent of global container production (comprising of all types). These types in 1999 declined less than 2 per cent on the 1998 figure. The other types of containers in 1999 such as tanks, integral reefers and other dry freight specials were less than in 1998, although demand for swapbody and US domestic containers remained strong (see Table 4-6).
4.3 New logistics concepts - supply of containers
New logistics concepts such as total costs, cost trade -offs, outsourcing, just- in- time delivery, value added and globalisation have created the need for the establishment of complex international distribution chains. The ultimate goal of these is to allow the organisation to supply the right product at the right place at the right time in the right condition and most importantly for the right cost to the customers.
Total costs for an ordinary enterprise are the sum of production costs, transportation costs, warehousing costs, order processing and information costs, lot quantity costs and inventory costs (Ma, 1999). The goal of the total cost concept is to minimise the total cost of logistics, rather than focusing on each activity in isolation such as transportation cost, warehousing and storage cost, inventory cost, etc. From a total container cost logistics point of view and container cost management, container carriers and operators are not only interested in reducing costs of repositioning empty container but also total container costs. This means that all major container cost elements such capital costs, maintenance costs and empty container repositioning costs are interrelated, so a best combination should exit with which the total costs of containers are at minimum. This can be done by using a tool of integrated logistics called trade–offs method (see Figure 5-2 in chapter 5).
is US$1,750. At the same time, in ASEAN, the price of the same container type, which was built in Indonesia, is only US$1,700.
Logistics concerns not only materials but also actually interests in all resources needed for having the right product or service at the consumer’s disposal. The resources are composed of materials, capital, people, technology know how, information and so on.
Logistics consist of two levels of planning and organising activities. The first level is where and when to get resources and products and where to send them. Therefore the problem here is the problem of location. In container management, container carriers or transport operators should know when and where they purchase or lease containers for their liner transport operation. For example, in the time of the Asian crisis, in order to solve the short of empty containers, ocean container carriers leased or bought new containers in Asia instead of purchasing them in Europe or America. The second level is how to get resources and products from the origin to the final destination. So the second problem is the problem of movement and storage.
Strategic logistics is concerned with the minimisation of total costs by looking for the most suitable locations and activity providers. This is mainly related to problems of out-sourcing and location activities.
Chapter two analysed the impacts of container imbalance problems in the maritime transport industry, particularly on the ocean carriers who had to spend a lot of money in repositioning empty containers. This is to move empty containers to the loading locations. This problem will continue to happen in the coming years and create difficult situations for container management of ocean carriers to control container cost, especially the container repositioning cost.
cheaper new containers or making them by source out can reduce container capital cost. This means that container transport operators or container leasing companies want to find low cost locations, such as South East Asian countries, to produce new containers. On the other hand, they can purchase cheaper new containers in these regions.
One of the advantages of buying or making new containers in these regions is that they can reduce empty container repositioning costs. Instead of moving back large proportions of the empty containers to these locations, they use these new containers for loading cargo where the containers are made. This is particularly attractive when export containers over number of the import ones.
CHAPTER 5
SOUTH EAST ASIA - A LOCATION FOR CONTAINER MANUFACTURING
This chapter will present the demand for containers in South East Asia in the coming years from forecasting the development of container trade and trade imbalance in the region. From a logistics point of view, the competitive advantage of South East Asia for container manufacturing will be analysed.
5.1 Container trade development and container imbalance in South East
Asia
5.1.1 Container trade development
The ASEAN countries are strategically situated in a trading area that accounts for 17 per cent of the global liner market. Container traffic growth in ASEAN increased significantly to about 9-10 per cent a year over the past years and it is expected to increase rapidly to about 9-17 per cent a year after 2000 (see Figure 5-1).
direct effect on the container trade in South East Asia. Therefore, container traffic growth that year was only 3 per cent, or approximately 32 million TEU. Container throughput is expected to reach 148 million TEU in 2016 (Table 5-1).
Figure 5-1: Container traffic by South East Asia from 1990-1998 and forecast for 2000-2012
Source: Ocean Shipping Consultants Ltd., World Container Port Markets to 2012,1999.
Table 5-1: Forecast World Container Port Demand to 2016 (million TEU)
Region 1997 1998 2000 2004 2008 2012 2016
Europe 43 48 55 70 85 101 116
Middle East 11 12 14 20 27 33 40
North East Asia 49 51 60 82 106 132 160
South East Asia (% of Total)
31 17,6% 32 17,0% 38 17,4% 61 20,3% 85 21,6% 114 23,2% 148 24,7%
North America 25 27 30 38 48 58 67
South America 13 14 17 24 33 41 50
Africa 4 4 4 6 9 13 17
Total 176 188 218 301 393 492 598
Source: Ocean Shipping Consultants Ltd., World Container Port Markets to 2012,1999.
-2 0 4 0 6 0 8 0 10 0 12 0 14 0 16 0
19 90 19 92 1 994 199 6 19 98 2 000 200 2 20 04 2 006 2 00 8 201 0 20 12 2 014 201 6
M
il
li
on TE
U
The volume of container traffic in South East Asia is expected to increase rapidly, from 17.6 per cent of total world traffic in 1997 to 24.7 per cent in 2016. By 2012, it is expected that the volume of container traffic in South East Asia (114 million TEU) would be higher than in Europe (101 million TEU) and other regions like North America (58 million TEU) and South America (41 million TEU) and so on except North East Asia (132 million TEU) (see Table 5-1).
Table 5-2: Container Traffic Forecast in ASEAN
Country
Container Traffic (000' TEU)
1997 2004 2010 2020
Brunei Darussalam 79 200 300 800
Cambodia 36 100 300 900
Indonesia 2,792 3,800 7,100 14,800
Malaysia 3,070 5,000 9,500 19,600
Myanmar 96 300 1,200 3,300
Philippines 2,631 4,900 8,700 15,300
Singapore 14,750 20,600 31,200 52,500
Thailand 2,181 3,700 6,200 12,300
Vietnam 672 1,700 3,600 9,400
Total 26,307 40,300 68,100 128,900
Source: ASEAN Transport Cooperation Framework Plan, July 1999.
The significant increase in container traffic in South East Asia is due to two structural factors. First, the stead development of a manufacturing base in South East Asia has helped drive the expansion in container trade. Although ASEAN is still a major producer of primary products (except Singapore), there has been a significant shift towards higher value-added manufacturing in the last two decades (see Table 5-3).
has not developed strongly like in Europe and America, so the absence of land-based transport options that has helped to promote seaborne trade.
Table 5-3: Indicators on export performance (average growth in percentage) by country in South East Asia from 1994-1998
Country Primary products Natural-res.int. manuf. Labour intens. Manuf. Technology int. Manuf. Human capital int.manuf.
Brunei Darussalam -4 97 28 4 2
Cambodia -12 175 110 12 0
Indonesia 1 -6 -6 19 9
Malaysia 0 0 5 11 -3
Myanmar -5 -10 38 -7 -19
Philippines 0 -2 3 37 4
Singapore -3 12 -4 6 -5
Thailand 0 -2 2 12 9
Vietnam 7 12 31 78 42
Source: International Trade Center- UNCTAD-WTO
5.1.2 Container imbalance forecasting
5.2 Considering the competitive advantages of South East Asia in container manufacturing
A detailed analysis of competitive advantages, one of the logistics methods, helps firms to have a good achievable alternative at a minimum total cost. This analysis focuses on not only production costs but also other costs relating to logistics activities such as transportation costs, warehousing costs, inventory costs, lot quantity costs, order processing and information costs and other logistics costs. In order to consider production costs and resources for economic activities in South East Asia, the following factors will be taken into account.
5.2.1 Land factor
The land factor is one of the competitive advantages of South East Asia in the development of container manufacturing. The first advantage is that containers produced in South East Asia are aimed at supplying the increasingly demand for containers in this region due to container imbalance problem. Another advantage is that ASEAN has the investment policies for creating the advantages for foreign investors, especially the policy of land use. In addition, the distance from the location of container factory to the main port in this region like Singapore Port, the Hub Port of this region, is nearer compared to other locations such as China, Europe, or America.
5.2.2 Labour factor
The labour factor is also one of the important elements in the competitive advantage of South East Asia. One advantage is that a large population of 500 million peoples will provide both good skilled and unskilled labour forces for container manufacturing industry. Another advantage is that labour cost in this region (except Singapore) is lower than other regions such as the European or American region, and maybe equal to China. For example, the salary for one worker is about US$1.2-2.0 per day in Vietnam and US$2.97-3.70 per day in Thailand (Thailand Board of Investment), compared with $US 1.5 per day in China.
ASEAN countries are now considered the home of lowest-cost manufacturing competitors in the container manufacturing industry today. In recent years, the low labour cost in South East Asia has attracted a lot of foreign investors who have mainly concentrated the labour intensive-manufacturing product in this region such as in Vietnam, Myanmar, Indonesia, Malaysia, Cambodia, and so on.
5.2.3 Capital factor
5.2.4 Technological factor
The technological factor is a significant factor in the development of container manufacturing in ASEAN countries. In recent years, the growth of technology-intensive manufacturing in South East Asian countries has been increasing rapidly. From 1994 –1998, the average growth of technology-intensive manufacturing reached 78 per cent in Vietnam, 37 per cent in the Philippines, 19 per cent in Indonesia, 12 per cent in Thailand and Cambodia, and 11 per cent Malaysia (see Table 5-3).
Moreover, ASEAN countries also recognise the importance of the development of information technologies: computers, software, peripherals and networks to their future success. So they are establishing the infrastructure necessary to exploit it. Singapore, for example, has made significant progress in its plan to establish a network that integrates government agencies and businesses; Malaysia has established “ Multimedia corridor”, and so on.
Singapore has particularly concentrated on becoming the technology centre for South East Asia, sending labour-intensive operations to low-cost other countries in this region like Malaysia, Indonesia, Vietnam, and Thailand in special mutual co-operative trade and development arrangements. This regional co-operation provides a competitive mode to attract investment and technology.
Table 5-4: Main sources of competitive advantages of container manufacturing in Southeast Asia
Factors Competitive advantages
1. Land Cheap cost
2. Labour Cheap cost and large force
3. Capital Secured by states or international financial institutions
5.3 Container logistics costs
Container logistics costs are the sum of production costs, transportation costs, warehousing costs, order processing and information costs, lot quantity costs and inventory costs. The goal of the total cost concept is to minimise at total container logistic cost. This can be done by using a tool of integrated logistics called the trade– offs method (see Figure 5-2).
Figure 5-2: Cost trade-offs required in marketing and logistics
Product
Price Promotion
Place/ customer service levels
Inventory carrying
costs
Transportation costs
Lot quantity costs
Warehousing costs
Order processing and
information costs
Marketing objective: Allocation of resources to the marketing mix to maximise the long-run profitability of the firm.
Logistics objective: Minimise total costs given the customer service objective where Total costs = Transportation costs + Warehousing costs + Order processing and information costs + Lot quantity costs + Inventory carrying costs.
Source: Lambert, 1998.
MARKETING
LOGIS
T
IC
5.3.1 Transportation costs
Transportation is one of the largest logistics costs and may account for a significant portion of the selling price of some products (Lambert, 1998). There are some major factors influencing transportation cost and price. The first factors are product-related factors that can be grouped into categories such as density, stowability, and ease or difficulty of handling and liability. Other factors are factors related to the market such as location of markets, degree of intramode and intermode competition, and so on.
One of the major advantages of container production in South East Asia is that the distance new containers must be transported from factories in ASEAN countries to the demand areas in the major ports of this region is shorter than from China, Europe or North America. Therefore, the transportation cost for moving containers produced from these factories to ports in South East Asia such as Singapore is cheaper. For instance, the cost to move a new 20ft container from China to the major ports in South East Asia (including Bangkok, Port Klang, Jakarta and Surabaya) is around US$200-300 (Containerisation International, August 1999). The repositioning cost of an empty 20ft container from Europe or North America to these ports is around US$300-500. At the same time, the cost of moving an empty 20ft container from Vietnam, Thailand or Indonesia to these ports is only around US$50-100 (P&O Nedlloyd).
Another advantage is that new containers produced in South East Asia are delivered into major ports in this region not only with cheaper transportation cost but also just-in-time delivery.
5.3.2 Warehousing costs
warehousing cost of a new container is composed of all costs that relate to the storage of container during all phases of the logistics process.
One of the major advantages of new container warehousing costs in South East Asia is low, because the warehouse cost and the running of warehousing activities such as land cost, facility cost, fiscal structure cost, construction cost, labour cost, and so on are low. Another advantage is that the warehousing of new containers in the South East Asian region is to: 1) meet changing market conditions (e.g., seasonality, demand fluctuations, competition); 2) support the JIT programs of suppliers and customers; 3) support the firm’s customer service policies.
5.3.3 Order Processing/ Information systems costs
Order processing and information costs are an extremely important investment to support good customer service levels and control costs (Lambert, 1998).
Computer technology and communication systems have been rapidly increasing in recent years in Southeast Asian countries, especially Singapore. This would create convenient conditions for managing and having the information required for strategic and operational planning of the logistics function. Moreover, it also creates advantages for reducing costs such as order transmittal, order entry, order processing, related internal and external related costs.