COMPUTER SCIENCE CLASS
by Ken Manship
A thesis
submitted in partial fulfillment of the requirements for the degree of Master of Science in STEM Education
Boise State University
© 2017 Ken Manship
DEFENSE COMMITTEE AND FINAL READING APPROVALS
of the thesis submitted by
Ken Manship
Thesis Title: The Effects of Pair-Programming in a High School Introductory Computer Science Class
Date of Final Oral Examination: 15 June 2017
The following individuals read and discussed the thesis submitted by student Ken Manship, and they evaluated his presentation and response to questions during the final oral examination. They found that the student passed the final oral examination.
Amit Jain, Ph.D. Chair, Supervisory Committee
Jonathan Brendefur, Ph.D. Member, Supervisory Committee
Marissa Schmidt, M.S. Member, Supervisory Committee
iv
v
I would like to acknowledge Dr. Amit Jain for involving me in such a grand opportunity, helping me develop this idea, and standing by me as I muddled through it all. Additionally, I would like to acknowledge Dr. Jonathan Brendefur whose support and insight made this document possible.
vi
The following describes my research into pair-programming in a high school introductory computer science class. Research exists that shows the benefits of pair-programming in industry and post-secondary education. For example, in industry, well respected programmers often prefer pair-programming to a more individual approach and often produce better solutions. Furthermore, in post-secondary education, students show higher academic achievement and rely less on staff and instructors when paired with another student. There is not much research that investigates pair-programming in high school.
From January 2017 to March 2017 I explored the effect of pair-programming on my Exploring Computer Science class at Ridgevue High School in Nampa, Idaho. This is a brand-new program and the 2016/2017 school year marks the second time I have taught the class. Additionally, I only had one section with twenty students.
The curriculum used for this project is Exploring Computer Science by Joanna Goode of the University of Oregon and Gail Chapman of the University of California, Los Angeles. I used the programming projects from Unit four and forged eleven projects. Since I only had access to one section, I was not able to compare a section of individual work to a section of programming work. We decided to investigate
vii
problem-solving skills, attitude toward computer science, and comfort programming. I conclude that more time and research needs to be implemented to identify the effects of pair programming on students’ attitudes toward computer science as a choice of study or as a career. Additionally, more time needs to be spent developing
pair-programming at this level to substantiate any real positive effects on academic
viii
DEDICATION ... iv
ACKNOWLEDGEMENTS ...v
ABSTRACT ... vi
LIST OF FIGURES ...x
CHAPTER ONE: INTRODUCTION ...1
CHAPTER TWO: THEORETICAL FOUNDATION ...3
CHAPTER THREE: METHODOLOGY ...6
CHAPTER FOUR: FINDINGS ...8
CHAPTER FIVE: DISCUSSION ...33
LESSONS LEARNED...43
REFERENCES ...45
APPENDIX A ...46
Project Details ...47
Project 1 ...47
Project 2 ...50
Project 3 ...54
Project 4 ...57
Project 5 ...61
ix
Project 8 ...72
Project 9 ...76
Project 10 ...80
Project 11 ...84
APPENDIX B ...89
x
Figure 1.1 After this assignment, do you feel more confident in your problem solving skills? ... 8 Figure 1.3 How do you feel about computer science as a topic you want to study or as
a career you want to have when you are older? ... 9 Figure 1.4 How likely are you to pursue a career in computer science? (1 - Not very
likely | 5 - Highly likely) ... 10 Figure 1.5 Are you comfortable programming in AppInventor2/Scratch? ... 10 Figure 2.1 After this assignment, do you feel more confident in your problem-solving
skills? ... 11 Figure 2.3 How do you feel about computer science as a topic you want to study or as
a career you want to have when you are older? ... 12 Figure 2.5 Are you comfortable programming in AppInventer2/Scratch? ... 12 Figure 3.2 How do you feel about working in a group versus working individually?
Do you like it more now, or less? ... 13 Figure 3.3 How do you feel about computer science as a topic you want to study or as
a career you want to have when you are older? ... 14 Figure 3.4 How likely are you to pursue a career in computer science? (1 - Not very
likely | 5 - Highly likely) ... 15 Figure 4.2 How do you feel about working in a group versus working individually?
Do you like it more now, or less? ... 16 Figure 4.3 How do you feel about computer science as a topic you want to study or as
a career you want to have when you are older? ... 16 Figure 4.4 How likely are you to pursue a career in computer science? (1 - Not very
likely | 5 - Highly likely) ... 17 Figure 5.1 After this assignment, do you feel more confident in your problem-solving
xi
Figure 6.2 How do you feel about working in a group versus working individually? Do you like it more now, or less? ... 19 Figure 6.5 Are you comfortable programming in AppInventor2/Scratch? ... 20 Figure 7.1 After this assignment, do you feel more confident in your problem-solving
skills? ... 21 Figure 7.5 Are you comfortable programming in AppInventor2/Scratch? ... 21 Figure 8.1 After this assignment, do you feel more confident in your problem-solving
skills? ... 22 Figure 8.2 How do you feel about working in a group versus working individually?
Do you like it more now, or less? ... 23 Figure 9.1 After this assignment, do you feel more confident in your problem-solving
skills? ... 24 Figure 9.2 How do you feel about working in a group versus working individually?
Do you like it more now, or less? ... 24 Figure 9.5 Are you comfortable programming in AppInventor2/Scratch? ... 25 Figure 10.1 After this assignment, do you feel more confident in your problem-solving
skills? ... 26 Figure 10.5 Are you comfortable programming in AppInventor2/Scratch? ... 27 Figure 11.1 After this assignment, do you feel more confident in your problem-solving
skills? ... 28 Figure 11.5 Are you comfortable programming in AppInventor2/Scratch? ... 28 Figure Q1 After this assignment, do you feel more confident in your problem-solving
skills ... 29 Figure Q2 How do you feel about working in a group versus working individually?
Do you like it more or less? ... 30 Figure Q3 How do you feel about computer science as a topic you want to study or as
xii
Figure Q5 Are you comfortable programming in AppInventor2/Scratch? ... 31 Figure M1 Mean Scores – Individual vs. Pair-Programming ... 32 Figure A-1.1 After this assignment, do you feel more confident in your problem-solving
skills? ... 48 Figure A-1.2 How do you feel about working in a group versus working individually?
Do you like it more now, or less? ... 48 Figure A-1.3 How do you feel about computer science as a topic you want to study or as
a career you want to have when you are older? ... 49 Figure A-1.4 How likely are you to pursue a career in computer science? (1 - Not very
likely | 5 - Highly likely) ... 49 Figure A-1.5 Are you comfortable programming in AppInventor2/Scratch? ... 50 Figure A-2.1 After this assignment, do you feel more confident in your problem-solving
skills? ... 51 Figure A-2.2 How do you feel about working in a group versus working individually?
Do you like it more now, or less? ... 52 Figure A-2.3 How do you feel about computer science as a topic you want to study or as
a career you want to have when you are older? ... 52 Figure A-2.4 How likely are you to pursue a career in computer science? (1 - Not very
likely | 5 - Highly likely) ... 53 Figure A-2.5 Are you comfortable programming in AppInventer2/Scratch? ... 53 Figure A-3.1 After this assignment, do you feel more confident in your problem-solving
skills? ... 55 Figure A-3.2 How do you feel about working in a group versus working individually?
Do you like it more now, or less? ... 55 Figure A-3.3 How do you feel about computer science as a topic you want to study or as
a career you want to have when you are older? ... 56 Figure A-3.4 How likely are you to pursue a career in computer science? (1 - Not very
xiii
Figure A-4.1 After this assignment, do you feel more confident in your problem-solving skills? ... 58 Figure A-4.2 How do you feel about working in a group versus working individually?
Do you like it more now, or less? ... 59 Figure A-4.3 How do you feel about computer science as a topic you want to study or as
a career you want to have when you are older? ... 60 Figure A-4.4 How likely are you to pursue a career in computer science? (1 - Not very
likely | 5 - Highly likely) ... 60 Figure A-4.5 Are you comfortable programming in AppInventor2/Scratch? ... 61 Figure A-5.1 After this assignment, do you feel more confident in your problem-solving
skills? ... 62 Figure A-5.2 How do you feel about working in a group versus working individually?
Do you like it more now or less? ... 63 Figure A-5.3 How do you feel about computer science as a topic you want to study or as
a career you want to have when you are older? ... 63 Figure A-5.4 How likely are you to pursue a career in computer science? (1 - Not very
likely | 5 - Highly likely) ... 64 Figure A-5.5 Are you comfortable programming in AppInventor2/Scratch? ... 64 Figure A-6.1 After this assignment, do you feel more confident in your problem-solving
skills? ... 66 Figure A-6.2 How do you feel about working in a group versus working individually?
Do you like it more now, or less? ... 67 Figure A-6.3 How do you feel about computer science as a topic you want to study or as
a career you want to have when you are older? ... 68 Figure A-6.4 How likely are you to pursue a career in computer science? (1 - Not very
likely | 5 - Highly likely) ... 68 Figure A-6.5 Are you comfortable programming in AppInventor2/Scratch? ... 69 Figure A-7.1 After this assignment, do you feel more confident in your problem-solving
xiv
Figure A-7.3 How do you feel about computer science as a topic you want to study or as a career you want to have when you are older? ... 71 Figure A-7.4 How likely are you to pursue a career in computer science? (1 - Not very
likely | 5 - Highly likely) ... 72 Figure A-7.5 Are you comfortable programming in AppInventor2/Scratch? ... 72 Figure A-8.1 After this assignment, do you feel more confident in your problem-solving
skills? ... 73 Figure A-8.2 How do you feel about working in a group versus working individually?
Do you like it more now, or less? ... 74 Figure A-8.3 How do you feel about computer science as a topic you want to study or as
a career you want to have when you are older? ... 74 Figure A-8.4 How likely are you to pursue a career in computer science? (1 - Not very
likely | 5 - Highly likely) ... 75 Figure A-8.5 Are you comfortable programming in AppInventor2/Scratch? ... 76 Figure A-9.1 After this assignment, do you feel more confident in your problem-
solving skills?... 77 Figure A-9.2 How do you feel about working in a group versus working individually?
Do you like it more now, or less? ... 78 Figure A-9.3 How do you feel about computer science as a topic you want to study or as
a career you want to have when you are older? ... 79 Figure A-9.4 How likely are you to pursue a career in computer science? (1 - Not very
likely | 5 - Highly likely) ... 79 Figure A-9.5 Are you comfortable programming in AppInventor2/Scratch? ... 80 Figure A-10.1 After this assignment, do you feel more confident in your problem-solving
skills? ... 81 Figure A-10.2 How do you feel about working in a group versus working Individually?
xv
Figure A-10.4 How likely are you to pursue a career in computer science? (1 - Not very likely | 5 - Highly likely) ... 83 Figure A-10.5 Are you comfortable programming in AppInventor2/Scratch? ... 84 Figure A-11.1 After this assignment, do you feel more confident in your problem-solving
skills? ... 85 Figure A-11.2 How do you feel about working in a group versus working individually?
Do you like it more now, or less? ... 86 Figure A-11.3 How do you feel about computer science as a topic you want to study or as
a career you want to have when you are older? ... 87 Figure A-11.4 How likely are you to pursue a career in computer science? (1 - Not very
CHAPTER ONE: INTRODUCTION
Pair programming is a strategy used in education and industry where two
programmers work side by side to complete a programming task. There is some research available on the effects of pair programming in industry and in post-secondary education; however, not much research has been conducted in K-12 settings. The following is an examination of the effects of pair programming in an introduction to computer science class in a high school setting.
Pair programming is a strategy where two programmers work side-by-side, collaboratively, on the same programming task. One of the programmers is designated as the driver and is responsible for controlling the keyboard and mouse. The other
programmer is designated as the navigator and is an active collaborator in the design and development of the program. If the forward progress of the design halts for whatever reason, the two programmers work together to resolve the hold-up and continue with the task. After twenty to thirty minutes in this configuration, the two programmers switch roles. The driver takes on the role of the navigator, and the navigator takes on the role of the driver. This process continues as time permits or the programming task is solved.
Put another way, pair programming is a collaborative effort that promotes peer-based interaction. In the article, In Support of Pair Programming in the Introductory Computer Science Course, the authors cite Jihn-Chang Jehng who claims that,
different parts of the task, and 3) collaboration, where learners work jointly on almost all parts of the task” (Williams et al. 2002). Borrowing from Jehng’s definition of peer-based interaction, it is important to ensure that pair programming takes on a form of
CHAPTER TWO: THEORETICAL FOUNDATION
Traditional attitudes tend to object to the pair programming strategy for several reasons. In industry, programmers are a resource, and to assign two programmers to a task that traditionally requires one is thought to be a waste of resources (Cockburn and Williams 2002). Furthermore, in post-secondary educational settings, programming has been taught and practiced as an individual activity (Cockburn and Williams 2002). Finally, for the experienced programmer, pair programming is thought to be a strategy that will only slow down the coding process, or be impossible due to scheduling conflicts or version control (Cockburn and Williams 2002).
utilized. Finally, “qualitative observations supported that paired closed labs were a superior learning environment for the student” and, “paired labs are also less stressful for the teaching assistants because students are not as reliant on them as the sole provider for technical information and help (Williams et al. 2002)
A study conducted by Thomas et al. at Aberystwyth set out to investigate what the self-perception students with programming experience held. Moreover, they set out to observe how this self-perception manifests itself when the students were introduced to pair programming. When they examined the results that apply to pair programming, they found that, “overall, students like pair programming and believe that it helps them achieve good solutions.” Additionally, they observed, “students with less self-confidence seem to enjoy pair-programming the most” (Thomas, Ratcliffe and Robertson 2003).
that students who had different experiences using and creating on computers benefited in different ways. Finally, they concluded that it was not advantageous to pair students with differing attitudes toward collaboration. The student who prefers to work alone can undermine the more collaborative students’ learning. (Denner et al. 2014).
The earlier mentioned attitudes toward pair programming exist in industry and in the post-secondary computer science classrooms, but what we don’t know is what attitudes exist in the K-12 setting. “The few known studies of pair programming in K-12 suggest it holds promise for developing higher-level reasoning skills and increasing motivation” (Denner et al. 2014). In the article, Pair Programming: Under What Conditions is it Advantageous for Middle School Students, the authors conclude, “Overall, the students who programmed with a partner learned more than those who programmed alone, suggesting that pairing is an effective strategy.” (Denner et al. 2014)
CHAPTER THREE: METHODOLOGY
Most of the significant research involving pair programming has been carried out in post-secondary environments aimed at supporting students in one-hundred level computer science courses. As we shift to begin introducing computer science courses earlier, in the secondary classroom, it is important to examine whether pair programming is an effective methodology in the high school setting. To study the effectiveness of pair programming in a high school introductory computer science class, I implemented a mixed study.
My questions are:
1. How does student performance (earning a C or better) on pair programming assignments compare to student performance in programming assignments where a traditional, individual strategy is utilized?
2. How does self-sufficiency (reliance on staff/teacher) during pair programming assignments compare to student self-sufficiency during traditional, individual assignments?
3. Does pair programming promote a more positive attitude toward the course and computer science in general.
From mid-January 2017 to mid-March 2017, I quantitatively and qualitatively attempted to answer these questions in my Exploring Computer Science class. The
(University of California, Los Angeles). Because our computer science program is in its second year, I did not have multiple sections to pull data from. What I decided to do instead was offer six of the projects as individual assignments and five of the assignments as pair programming assignments.
How students are paired will no doubt affect how the students work together. In the article, On Understanding Compatibility of Student Pair Programmers, Katira et al. found that, “Ninety percent of pairs report that they and their partners work compatibly.” Additionally, they conclude that, “In many ways, this suggests that pairs will be highly compatible and successful if we pair them randomly, without necessarily considering personality type, skill level, or self-esteem” (Katira et al. 2004).
CHAPTER FOUR: FINDINGS
The objectives for the first programming assignment were meant for students to be able to name the basic terms used in Scratch and create the beginning of a simple program in Scratch. Specific details pertaining to all the projects assigned can be found in Appendix A. In short, this project was meant for students to get setup in Scratch and begin understanding the features in Scratch. Because this was the first programming assignment of the unit, the data collected in the post-survey represents benchmarks for the unit.
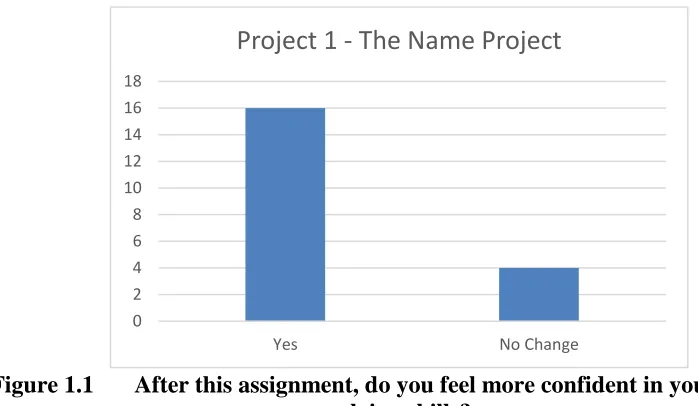
Question one on the post-survey asked students if they felt more confident in their problem-solving skills? Figure 1.1 shows the graph of responses where 80% of students reported feeling more confident while 20% felt there was no change in their confidence.
Figure 1.1 After this assignment, do you feel more confident in your problem solving skills?
0 2 4 6 8 10 12 14 16 18
Yes No Change
Question three on the post-survey asked students how they felt about computer science as a topic they would like to study or as a career they would like to have when they were older. Figure 1.3 shows the student responses where 55% reported they like computer science, 20% reported being indifferent to computer science as a topic of study or a career, and 25% reported not really having an interest in computer science.
Figure 1.3 How do you feel about computer science as a topic you want to study or as a career you want to have when you are older?
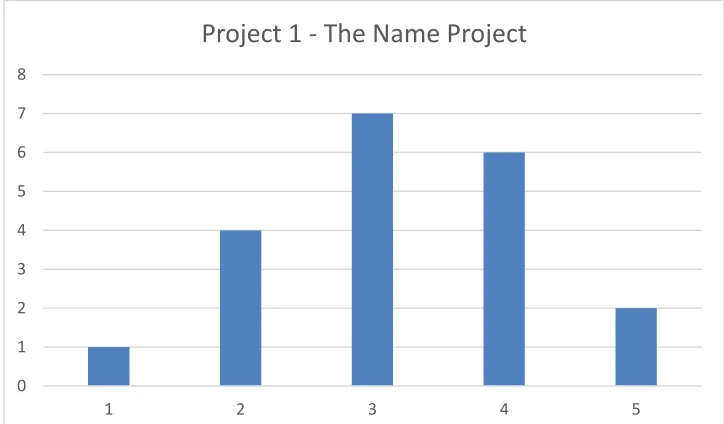
Question number four on the post-survey asked students how likely they were to pursue a career in computer science. Figure 1.4 shows the distribution of student
responses. The mean response to question number four was 3.2 with a standard deviation of 1.06. For this response, students were instructed to respond with one for “not very likely” and five for “highly likely”.
0 2 4 6 8 10 12
I like CS I'm not really interested in CS
I am indifferent
Figure 1.4 How likely are you to pursue a career in computer science? (1 - Not very likely | 5 - Highly likely)
Question number five on the post-survey asked students if they were comfortable programming in Scratch? Figure 1.5 shows the responses to this question. Of the
students surveyed, 85% responded they were comfortable programming in Scratch while only 10% noted they were not comfortable. Additionally, 5% identified no change in their level of comfort programming in Scratch.
Figure 1.5 Are you comfortable programming in AppInventor2/Scratch?
0 1 2 3 4 5 6 7 8
1 2 3 4 5
Project 1 - The Name Project
0 2 4 6 8 10 12 14 16 18
Yes No change No
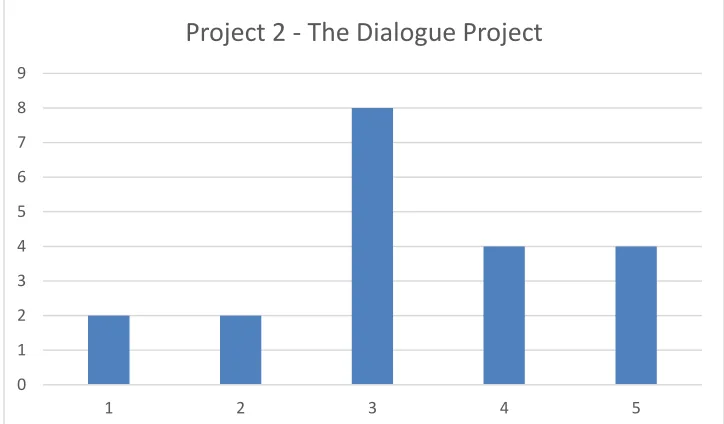
The Dialogue project was the second project in the programming unit. The objectives for this assignment were to have students explore more of the features in Scratch, utilize the “Green flag” feature and to work through a dialogue between two or more sprites. This project is a primer for event driven programming which will be expanded upon in later assignments. Again, more specific details for project two can be found in Appendix A.
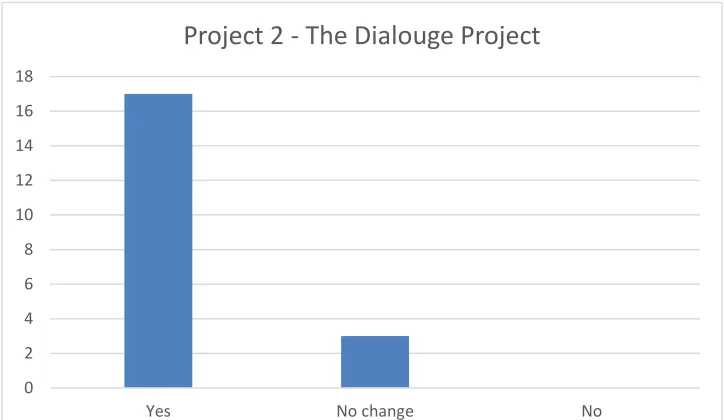
Figure 2.1 shows the graph for student responses to question number one regarding confidence in their problem-solving skills. Of the students surveyed, 85% of responded, “Yes” to feeling more confident while 15% felt there was no change in their confidence.
Figure 2.1 After this assignment, do you feel more confident in your problem-solving skills?
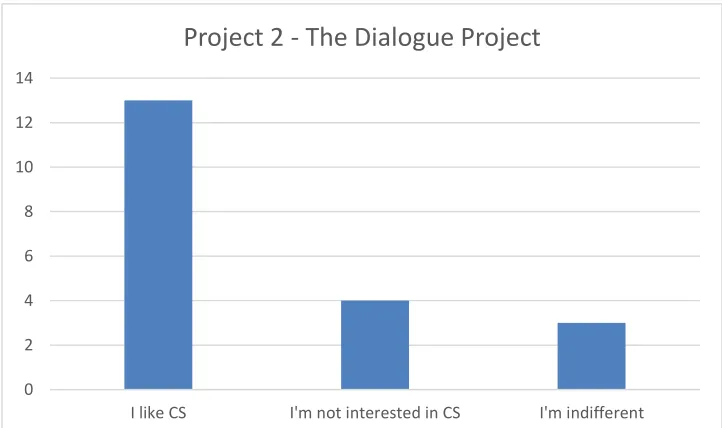
Figure 2.3 shows the graph for the student responses to question number three regarding how they felt about computer science as a topic they might study or a career they might want when they are older. Of the students surveyed, 65% reported liking computer science while 20% responded having no interest in computer science. Additionally, 15% responded being indifferent.
0 5 10 15 20
Yes No change No
Figure 2.3 How do you feel about computer science as a topic you want to study or as a career you want to have when you are older?
Finally, Figure 2.5 shows the student responses to question number five regarding how comfortable students felt programming in Scratch. Of the students surveyed, 75% felt they were more comfortable while 20% felt there was no change in their comfort level. Additionally, 5% did not feel comfortable programming in Scratch.
Figure 2.5 Are you comfortable programming in AppInventer2/Scratch?
0 2 4 6 8 10 12 14
I like CS I'm not interested in CS I'm indifferent
Project 2 - The Dialogue Project
0 2 4 6 8 10 12 14 16
Yes No change No
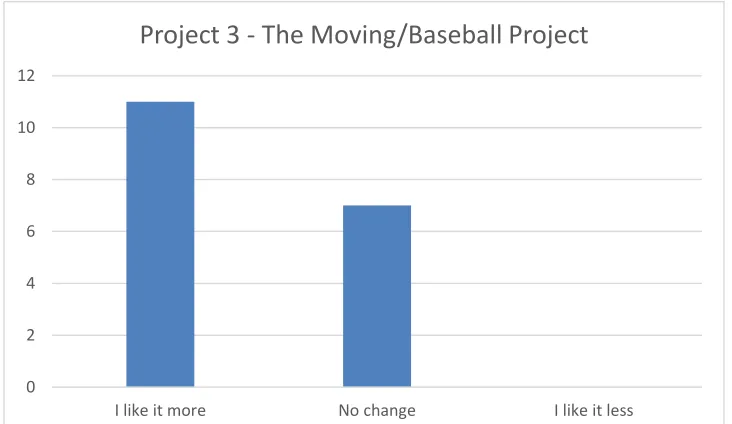
Project three represents the first pair-programming assignment of the unit. Project one and two were both completed individually. The objectives for project three were to explore how sprites move in Scratch utilizing three different blocks specific to
movement. Additionally, students were expected to identify the appropriate method of moving a sprite around the bases of a baseball diamond.
Figure 3.2 shows the graph of the student responses to question two on the post-survey, “How do you feel about working in a group versus working individually?” For project one and project two, 50% reported that they like working in a group more. For project three, 61.1% reported liking it more. Further, for project one and two, 35% and 50% reported no change respectively in how they felt about working in groups. For project three, 38.8% reported no change. Finally, after project one, 15% of students reported liking group work less. After project three, no students reported liking group work less.
Figure 3.2 How do you feel about working in a group versus working individually? Do you like it more now, or less?
0 2 4 6 8 10 12
I like it more No change I like it less
Figure 3.3 shows the graph for student responses to question three regarding how students felt about computer science as a topic they might want to study or a career they may want when they are older. Just over 55% of the students reported liking computer science and considered it as a topic or as a career while 27.7% reported having no real interest in computer science. Additionally, 16.7% reported being indifferent.
Figure 3.3 How do you feel about computer science as a topic you want to study or as a career you want to have when you are older?
Finally, Figure 3.4 shows the distribution of students who were considering a career in computer science at the time. The mean is 3.11 and the standard deviation is 1.18. For projects one and two the mean/standard deviation was 3.2/1.06 and 3.3/1.22 respectively.
0 2 4 6 8 10 12
I like CS I'm not interested in CS I'm indifferent
Figure 3.4 How likely are you to pursue a career in computer science? (1 - Not very likely | 5 - Highly likely)
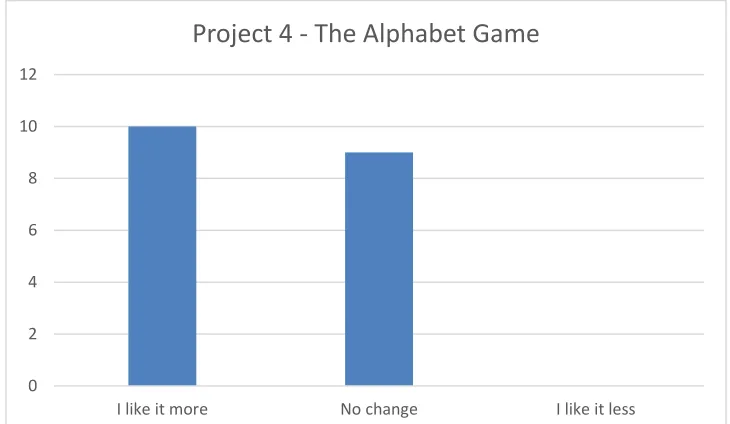
Project four was the second pair-programming assignment of the unit. The
objectives for project four were to further explore event driven programming and to write a program that responds to user created events from the mouse and keyboard.
Figure 4.2 shows the student responses to question number two regarding how students felt about working in groups. Of the students surveyed, 52.6% of the responses indicated that they like working in a group more while 47.4% reported no change.
0 1 2 3 4 5 6 7 8 9 10
1 2 3 4 5
Figure 4.2 How do you feel about working in a group versus working individually? Do you like it more now, or less?
Figure 4.3 shows the student responses when they were asked how they felt about computer science as a topic they might want to study or as a career they might want when they are older. Of the students surveyed, 52.6 reported liking computer science while 15.8% reported not having much interest in computer science. Additionally, 31.6% of students reported being indifferent.
Figure 4.3 How do you feel about computer science as a topic you want to study or as a career you want to have when you are older?
0 2 4 6 8 10 12
I like it more No change I like it less
Project 4 - The Alphabet Game
0 2 4 6 8 10
I like cs I'm not interested in cs I'm indifferent
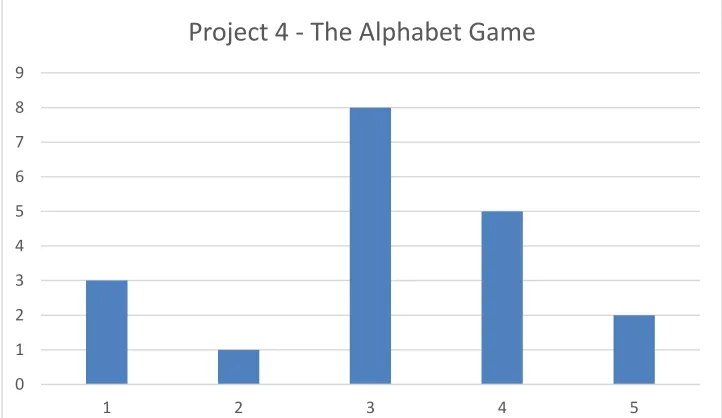
Finally Figure 4.4 shows that overall, with one being not very likely and five being highly likely, the mean value of responses to question four are 3.28 with a standard deviation of 1.13.
Figure 4.4 How likely are you to pursue a career in computer science? (1 - Not very likely | 5 - Highly likely)
For project five, students were expected to further develop their understanding of event driven programming. The objectives for this lesson included using broadcast events in Scratch, listening to and responding to broadcast events they create, and changing the background of the stage area through broadcast events.
Figure 5.1 shows the graph for the responses to question number one where students were asked about their confidence in problem solving. Of the students surveyed, 61.1% of the responses indicate that students were feeling more confident while 5.6% indicated they were not feeling confident. Additionally, 33.3% of the students did not see any significant change in their confidence.
0 1 2 3 4 5 6 7 8 9
1 2 3 4 5
Figure 5.1 After this assignment, do you feel more confident in your problem-solving skills?
Figure 5.3 shows the graph for the responses to question number three regarding how students felt about computer science as a topic they might want to study or as a career choice. Of the students surveyed, 61.1% of the indicated they liked computer science while 11.1% indicated little to no interest. Further, 27.8% indicated they were indifferent to computer science as a field of study or career.
Figure 5.3 How do you feel about computer science as a topic you want to study or as a career you want to have when you are older?
0 2 4 6 8 10 12
Yes No change No
Project 5 - The Summer Story Project
0 2 4 6 8 10 12
I like cs I'm not interested in cs I'm indifferent
Finally, the data for question 4 where students were asked on a scale of one to five where five indicated “highly likely” how likely they were to pursue a career in computer science, the mean response was 3.28 with a standard deviation of 1.13.
Project 6 was aimed at giving students the opportunity to further develop their understanding of event driven programming using the broadcast feature of Scratch. Students were to build a story from the ground up whereas in project five, students were given most of the code. The objectives for project 6 were use broadcast events, complete a scratch Story and to develop a Scratch story project. Additionally, this project
implemented assessment of peers and a presentation. Complete details can be found in Appendix A.
Figure 6.2 shows the graph for the responses to question number two where students were asked about how they felt working in groups. Of the students surveyed, 26.3% indicated they like working in groups more, while 63.2% indicated no change in opinion. Additionally, 10.5% of students reported they like it less.
Figure 6.2 How do you feel about working in a group versus working individually? Do you like it more now, or less?
0 2 4 6 8 10 12 14
I like it more No change I like it less
Figure 6.5 shows the graph for question 5 where students were asked how comfortable they felt programming in Scratch. Of the students surveyed, 68.4% of indicated they were comfortable while 31.6% of students indicated no change in their comfort level.
Figure 6.5 Are you comfortable programming in AppInventor2/Scratch?
Project seven marked the second round of pair-programming assignments. The objectives for project seven were for students to understand the concept of a variable and use variables in the project. Additionally, the concept of conditionals was introduced and students were expected to utilize conditionals in their project.
Figure 7.1 shows the graph for student responses specific to question number one. Students were asked if they felt more confident in their problem-solving skills with 50% responding, “Yes.” Additionally, 45% indicated there was no change in their confidence while 5% responded, “No” to being confident in their problem-solving skills.
0 2 4 6 8 10 12 14
Yes No change No
Figure 7.1 After this assignment, do you feel more confident in your problem-solving skills?
Figure 7.5 shows the graph for student responses specific to question number 5 where students were asked if they were comfortable programming in Scratch? Of the students surveyed, 60% responded, “Yes” to being comfortable while 35% indicated no change in their comfort level. Additionally, 5% responded not really being comfortable programming in Scratch.
Figure 7.5 Are you comfortable programming in AppInventor2/Scratch?
0 2 4 6 8 10 12
Yes No change No
Project 7 - The Age Project
0 2 4 6 8 10 12 14
Yes No change No
Project eight was the fourth pair-programming assignment for the unit. The
objectives for project eight were to use conditionals as well as randomness. Students were expected to use a random number generator for this project.
Figure 8.1 shows the graph of student responses to question number one where students were asked about their confidence in their problem-solving abilities. Of the students surveyed, 57.9% indicated being more confident in their problem-solving skills while 31.6% indicated no change in their confidence. Additionally, 10.5% indicated that they did not have confidence in their problem-solving skills.
Figure 8.1 After this assignment, do you feel more confident in your problem-solving skills?
Figure 8.2 shows the graph for question number two where students were asked if they liked working in groups. Of the students surveyed, 26.3% indicated liking group work more, while 57.9% indicated no change. Additionally, 15.8% of the students indicated they like it less.
0 2 4 6 8 10 12
Yes No change No
Figure 8.2 How do you feel about working in a group versus working individually? Do you like it more now, or less?
Finally, question number four asked students how likely it was for them to pursue a career in computer science where five indicates highly likely, the mean response after project eight was 3.3 with a standard deviation of 1.24.
Project nine was the fifth individually assigned project of the unit. By this time, students had completed a total of four individually assigned projects and four pair-programming assignments. The objectives for project nine were to implement a working Rock, Paper, Scissors game for one or two players.
Figure 9.1 shows the graph for question number one where students were asked if they felt more confident in their problem-solving skills. Of the students surveyed, 63.2% indicated that they felt more confident. Moreover, 26.3% indicated no real change while 10.5% indicated they did not feel more confident.
0 2 4 6 8 10 12
I like it more No change I like it less
Figure 9.1 After this assignment, do you feel more confident in your problem-solving skills?
Figure 9.2 shows the graph for student responses regarding how students felt about working in groups. Of the students surveyed, 31.6% indicated liking it more while 57.9% indicated no change. Additionally, 10.5% reported liking group work less.
Figure 9.2 How do you feel about working in a group versus working individually? Do you like it more now, or less?
0 2 4 6 8 10 12 14
Yes No change No
Project 9 - The Rock Paper Scissors Project
0 2 4 6 8 10 12
I like it more No change I like it less
Finally, Figure 9.5 shows the graph for how comfortable students were programming in Scratch. Of the students surveyed, 63.2% indicated they were
comfortable programming in Scratch while 26.3% indicated no change. Additionally, 10.5% of the students reported not feeling comfortable programming in Scratch.
Figure 9.5 Are you comfortable programming in AppInventor2/Scratch?
After project nine, when asked how likely students were to pursue a career in computer science, the mean response was 3.7 with a standard deviation of 1.34. This is based on a scale of one being “not very likely” and five being “highly likely.”
Project ten was the last pair-programming assignment for the unit. The objectives for project 10 were to use all the concepts from earlier projects to build a game that relied on the players timing to earn a score. Full details for this project can be found in
Appendix A.
Figure 10.1 shows the graph for question one where students were asked if they felt confident in their problem-solving skills. Of the students surveyed, 70.6% indicated
0 2 4 6 8 10 12 14
Yes No change No
feeling confident in their programming skills while 29.4% indicated no change. There were no students who did not feel confident in their programming skills.
Figure 10.1 After this assignment, do you feel more confident in your problem-solving skills?
Figure 10.5 shows the graph for question five which asks students how
comfortable they are programming in Scratch. Of the students surveyed, 70.6% indicated being comfortable in Scratch while 23.5% of students indicated no change. Additionally, 5.9% of the students indicated not feeling comfortable programming in Scratch.
0 2 4 6 8 10 12 14
Yes No change No
Figure 10.5 Are you comfortable programming in AppInventor2/Scratch?
Finally, for question number four, where students were asked to indicate how likely they were to pursue a career in computer science on a scale of one to five, the mean response was 3.18 with a standard deviation of 1.29.
Project Eleven was the final project for the programming unit and was the last individually assigned project. The objective of this assignment was to build a game of their choosing from the ground up utilizing all the foundation programming skills covered in the unit.
Figure 11.1 shows the graph for question one which asks students how confident they are in their problem-solving skills. Of the students surveyed, 76.5% indicated they were confident in their problem-solving skills. Additionally, 17.6% indicated no change while 5.9% indicated not feeling confident in their problem-solving skills.
0 2 4 6 8 10 12 14
Yes No change No
Figure 11.1 After this assignment, do you feel more confident in your problem-solving skills?
Figure 11.5 shows the graph for question five where students were asked how comfortable they were programming in Scratch. Of the students surveyed, 76.5% indicated being comfortable programming in Scratch while 17.6% indicated no change. Additionally, 5.9% indicated not feeling very comfortable programming in Scratch.
Figure 11.5 Are you comfortable programming in AppInventor2/Scratch?
0 2 4 6 8 10 12 14
Yes No change No
Project 11 - The Final Project
0 2 4 6 8 10 12 14
Yes No change No
Finally, after project 11, students were asked how likely they were to pursue a career in computer science on a scale from one to five where one indicates “not very likely” and five indicated “highly likely.” The mean answer was 3.18 with a standard deviation of 1.51.
The following graphs are included to show the distribution of answers to specific question across the entire set of projects.
Figure Q1 After this assignment, do you feel more confident in your problem-solving skills 0 20 40 60 80 100 Project 01 Project 02 Project 03 Project 04 Project 05 Project 06 Project 07 Project 08 Project 09 Project 10 Project 11
Mean: Yes - 66.10; No change - 30.01; No - 3.89 StDev: Yes - 11.97; No change - 11.18; No - 4.16
Q1: After this assignment, do you feel more
confident in your problem solving skills?
Figure Q2 How do you feel about working in a group versus working individually? Do you like it more or less?
Figure Q3 How do you feel about computer science as a topic you want to study or as a career you want to have when you are older?
0 20 40 60 80 Project 01 Project 02 Project 03 Project 04 Project 05 Project 06 Project 07 Project 08 Project 09 Project 10 Project 11
Mean: More - 39.71; No change - 48.38; Less - 11.9 StDev: More - 11.67; No change - 11.70; Less - 11.50
Q2: How do you feel about working in a group
versus working individually? Do you like it more
or less?
I like it more No change I like it less
0 20 40 60 80 Project 01 Project 02 Project 03 Project 04 Project 05 Project 06 Project 07 Project 08 Project 09 Project 10 Project 11
Mean: Like - 54.87; Not interested - 21.36; Indifferent - 8.69 StDev: Like - 5.06; Not interested - 6.71; Indifferent - 8.69
Q3: How do you feel about computer science as
a topic you want to study or as a career you want
to have when you are older?
Figure Q4 How likely are you to pursue a career in computer science?
Figure Q5 Are you comfortable programming in AppInventor2/Scratch?
The last graph I have included here shows the distribution of mean scores across the eleven programming assignments. Additionally, the graph includes the mean score for all the individual projects as well as the mean score for all the pair-programming
assignments. 0 1 2 3 4 Project 01 Project 02 Project 03 Project 04 Project 05 Project 06 Project 07 Project 08 Project 09 Project 10 Project 11
Mean: 3.23 StDev: 0.12
Q4: How likely are you to pursue a career in
computer science?
Mean StDev 0 20 40 60 80 100 Project 01 Project 02 Project 03 Project 04 Project 05 Project 06 Project 07 Project 08 Project 09 Project 10 Project 11Mean: Yes - 70.45; No change - 22.9; No - 5.28 StDev: Yes - 6.25; No change - 9.59; No - 4.02
Q5: Are you comfortable programming in
AppInventor2/Scratch?
Figure M1 Mean Scores – Individual vs. Pair-Programming 0 20 40 60 80 100 120 Project 01 Project 02 Project 03 Project 04 Project 05 Project 06 Project 07 Project 08 Project 09 Project 10 Project 11
Mean (Individual): 89.17; StDev (Individual): 8.841 Mean (PP): 86.4; StDev(PP): 12.779
Mean Scores: Individual vs. Pair-Programming
CHAPTER FIVE: DISCUSSION
As stated previously, the data collected from the post-survey for project one represents a benchmark for comparison. Most of the results from this survey are positive. For example, 80% of the students felt confident in their problem-solving skills.
Furthermore, more than half of the students surveyed reported liking computer science and considered it as a topic of study or a career. In addition, on a scale from one to five where five represents a high likelihood, the mean response to pursuing a career in computer science was 3.2 with a standard deviation of 1.0563. Finally, 85% of the students reported being comfortable programming in Scratch. Question two of the post-survey asked students about how they felt working in groups. I will look at this question more after project three, the first pair-programming assignment.
Similarly, 65% of students reported liking computer science as a topic of study or as a career after project two. This is up 10% from project one. Furthermore, 20% reported not being interested, down 5%, and 15% reported being indifferent, down 5% from project one. Finally, question five asked students how comfortable they were
programming in Scratch with 75% reporting being comfortable while 20% reported no change. This is down 10% and up 10% respectively from project one. After reviewing the post-survey results from project one and project two, I concluded that students developed confidence in their problem-solving skills and comfort programming in Scratch.
Moreover, after these two projects, students felt more positive about computer science as a course of study and as a career. I attribute this to the level of complexity for the first two projects. Both relied heavily, if not entirely on built-in abstractions in Scratch. To be successful, students needed to connect the appropriate blocks and their program would run.
Project three was the first project students were required to complete using pair-programming. By the end of project three, students had worked individually on two assignments, and with a partner for one. Question number two asks students how they felt about working in groups. Of the students surveyed, 61.1% reported liking group work and 38.8% reported no change. Since this is the first pair-programming assignment, I will use this as a benchmark.
in computer science which is up almost 8% from project two. Finally, 16.7% of students reported being indifferent, which represents an almost 2% increase from project two. This does not surprise me as the complexity of the programming assignment increased for project three. Students were required to utilize the “move” blocks in Scratch which rely heavily on a good working knowledge of the Cartesian plane. I have no doubts that some students struggled with this. Furthermore, students were required to work in pairs which meant relinquishing control of the computer for set periods of time, and discussing the program with a partner. I’m certain not every student was comfortable with this.
Finally, I looked at the data from question four which asks students how likely they were to pursue a career in computer science with five representing “highly likely.” The mean response to this question was 3.2 with a standard deviation of 1.1827.
Project four was the second pair-programming assignment of the unit. I looked at the data from responses 4.2, 4.3, and 4.4. Question two from the post-survey asked students how they liked group work. Of the students surveyed, 52.6% of the students reported liking group work. This is down nearly 9% from project three; however, 47.4% reported no change in their attitude toward group work. This is up nearly 9% from project three. With this shift in percentages from “liking” to “no change”, I am confident that after the second pair-programming assignment, students are like working with a partner.
Finally, 31.6% reported being indifferent up nearly 15% from project three. I found this interesting because the students reporting “liking” didn’t move much; however, the students who were indifferent nearly doubled. Moreover, the students who previously reported no interest shrunk by nearly half. I suspect that the added complexity of the programming assignments challenged some students, but the chance to work through the challenges with a partner left some students thinking, “Okay, this isn’t so bad, I don’t like computer science, but I’m not so sure it is not for me.”
Finally, question four of the post-survey asked students how likely they were to pursue a career in computer science. On a scale of one to five where five indicates a high likeliness, the mean response was 3.10 with a standard deviation of 1.1970. This is down just a bit from project three where the mean response was 3.4 with a standard deviation of 1.1827. It turns out that the mean score for all eleven projects is 3.23 with a standard deviation of 0.1178. Overall, after completing six individual assignments and 5 pair-programming assignments, the mean response will remain nearly centered. I conclude from this that the methodology implemented for each assignment did little to sway how likely students are to pursue a career in computer science.
were required to use the broadcast block in Scratch which is an abstraction that allows for event-driven programming to occur. Students needed to implement a broadcast and they had to implement a listener to receive the broadcast. To sum this up, after two pair-programming assignments and an increase in the level of complexity in the assignments, there is a rise in confidence for problem-solving. This indicates that pair-programming does have an impact on a student’s perceived ability to problem-solve. Also note that 33.3% of students reported no change in confidence which is down just over 19% from project four. This means that as complexity increases, students’ perception of confidence is unchanged. Additionally, 5.6% of the students reported having no confidence in their problem-solving skills. This is the first-time students have reported no confidence which does not surprise me as complexity has increased significantly.
Question three from project five asked students how they felt about computer science as a topic or career. Of the students surveyed, 61.1% reported liking computer science, a nearly 9% increase from project four. Furthermore, 11.1% reported no interest, a nearly 5% decrease from project four. Finally, 27.8% reported being indifferent to computer science which represents a nearly 4% decrease from project four. This being the first individual assignment after working in pairs for the past two assignments, I see an increase in students’ attitude toward computer science as a topic of study or as a career, and decreases in both “no interest” and indifference. This being on the heels of two pair-programming assignments, this demonstrates that pair-programming has a positive effect on students’ attitude toward computer science as a topic of study.
group work more which is down 7% from project five. Furthermore, 63.2% reported no change in their attitude which is up nearly 8% from project five. Finally, 10.5% reported liking group work less which is a decrease of only six-tenths of a percent from project five. In other words, working individually for these two projects did not seem to sway students’ attitudes at all.
For question five, students were asked about their comfort level programming in Scratch. Of the students surveyed, 68.4% reported being comfortable programming in Scratch. This is up just 1.7% from project five. Moreover, 31.6% reported no change which is down 1.7% from project five. It is obvious that not much changed in the way of comfort in Scratch from project five to project six. It is worth noting that the overall mean score for comfort with Scratch across all eleven projects is 70.45% with a standard deviation of 6.253. After projects five and six, the survey results show not much of a difference from the overall mean score for the question.
Project seven and project eight were the second and third pair-programming assignments for the unit respectively. After project seven, I looked at the responses to question one and question five. For question one 50% of the students reported having confidence in their problem-solving skills while 45% reported no change. This is down 13.2% from project six and up 13.4% from project six respectively. Furthermore, having no confidence increased by three-tenths of a percent from project six to project seven. In other words, students did not feel any real change in their confidence from project six to project seven.
student reported no change in their comfort level, a nearly 4% increase from project six. After project seven, I concluded that not a lot changed in the way of confidence or comfort level. Moreover, this comes with added complexity in the assignment. Students were expected to understand and use the idea of variables in this assignment and be able to conceptualize how variables work with conditionals. This being a pair-programming assignment, I concluded that the pairs could grapple with this added complexity and report no change in their overall comfort and confidence.
For project eight, I looked at the responses from questions one and two from the post-survey. For question one, 57.9% of the students reported being confident in their problem-solving skills. This is up nearly 8% from project seven. Furthermore, there was a decrease in students who noticed no change in their problem-solving skills of 13.4% from project seven to project eight. What I did notice here is an increase in students who reported having no confidence in their problem-solving skills. From project seven to project eight, no confidence doubled from 5% to 10.5%. This was disturbing; however, after thinking about this, I am wondering if students are seeing a difference in their perceived knowledge to that of their partner? In other words, this is the fourth pair-programming assignment, and thus, the fourth partner these students are working with. Could it be that they don’t perceive themselves as knowing as much as their new partner and therefore lose confidence in their own problem-solving skills? For over 5% of the students, I think this could be true and warrants further investigation.
understanding of variables, conditionals, and randomness. The post-survey questions I looked at after this assignment were one, two and five.
For question one 63.2% of the students reported feeling confident in their
programming skills. This is up 5.3% from project eight. Furthermore, 26.3% reported no change, a decrease of 5.3% from project eight. Additionally, 10.5% are still reporting no confidence in their problem-solving skills after project nine. I concluded no significant change in confidence after project nine.
For question two, 31.6% of students liked group work more. This is a significant increase from project eight. This being the first individual assignment after two pair-programming assignments, it is positive that attitudes toward group work have improved. Moreover, 57.9% reported no change which is the same measure from project eight. Finally, those students reporting that they like group work less is down just over 5% from project eight. In other words, attitudes toward group work are up overall after the
previous two pair-programming assignments.
Lastly, for question five, 63.2% of students reported being comfortable
programming in Scratch. This is down 5.3% from project eight; however, those students reporting no change is up 5.2% from project eight. Those students reporting no comfort programming in Scratch remained constant at 10.5% from project eight to project nine. I concluded that there was no significant change in comfort level from project eight to project nine.
Furthermore, the complexity of this project rose significantly as students were required to build a game from the ground up. Additionally, 23.5% reported no change in their
comfort level which marks a decrease of nearly 3%. Finally, 5.9% are reporting no comfort programming in Scratch which is down nearly 5%, almost double, from project nine. In conclusion, after the final pair-programming assignment, students are more confident programming in Scratch.
Project 11 would mark the last individual assignment and the last overall
assignment in the unit on programming. I looked at the responses from question one and question five. For question one, 76.5% of students reported being confident in their problem-solving skills. This is up nearly 6% from project ten. Furthermore, 17.6% reported no change, a decrease of nearly 12% from project ten. Moreover, 5.9% reported not being confident which is up from 0% reported in project ten. In other words, after a major pair-programming project and a major individual project, nearly 6% of students suddenly report not having any confidence in their problem-solving skills. This would need to be investigated further; however, one could make the argument that taking on a significant project individually versus with a partner could shake the confidence of an introductory computer science student.
heels of the last pair-programming assignment, students are comfortable programming in Scratch.
In terms of student achievement across these eleven projects, I think it is important to talk about the means scores on the individual assignments versus the pair-programming assignments. The mean score on the individual assignments was 89.17 with a standard deviation of 8.841. The mean score on the pair-programming assignments was 86.4 with a standard deviation of 12.779. While students performed better on the
individual assignments, there are several variables at play here. First, the complexity on the assignments increased over time. I would expect to see drops in scores over time. Second, pair-programming was a new methodology for these students and one could argue that students at this age have no real previous experience working with a partner on a programming assignment. In the article, Pair-Programming: Making Good Teams Takes Work, Nicholls-Ali writes, “Although I had taught them how to program together, I
had not taught them how to work together effectively.” In other words, more time was needed to develop the pair-programming skillset. This requires more investigation, but I feel a better way to gauge student achievement using pair-programming is to have two sections where individual work can be compared to that of exclusive pair-programming work. A luxury I could not afford. In short, looking at my data, I concluded that pair-programming did not appear to boost student performance on assignments.
Additionally, overall, students like computer science and consider it a topic of study or a career they might choose. Of the students surveyed, 54.87% of the students responded this way with a standard deviation of 5.062 while only 21.36% reported not having much interest in computer science with a standard deviation of 6.706. Again, more research needs to be done to quantify what effect pair-programming has on this measure. Further, on a scale of one to five where five indicates a high likelihood that students will pursue a career in computer science, the mean response was 3.23 with a standard deviation of 0.1178. This measure remained nearly centered throughout the entire unit which indicates that neither individually assigned projects nor pair-programming assignments had much effect on this attitude.
Finally, overall, nearly half of the students really didn’t perceive a change in their attitude toward working in groups. Close to 40% indicated that they like it more while nearly 12% indicated they like it less. The standard deviations for these measures are 11.072, 11.675, and 11.499 respectively. While this is positive, as stated previously, more time needs to be spent modeling and developing the pair-programming methodology with students at this level.
LESSONS LEARNED
assignment, I tried several different intervals ranging from five to fifteen minutes. For my students, ten minutes seemed the correct amount of time. This was a short enough
timeframe which kept them moving and it prevented distractions and boredom from setting in.
For the pair-programming projects in this unit, I restricted students from working with the same partner twice. For future pair-programming research, I plan to use shorter intervals, as well use earlier units in the course to develop collaboration skills. This will provide me the opportunity to identify students who work well together. It is worth attempting research based on more static pairs to see how this influences attitudes toward computer science, perceived problem-solving confidence and perceived comfort
REFERENCES
Cockburn, A. & L. Williams. 2002. The Costs and Benefits of Pair Programming. In Extreme Programming Examined, eds. M. Marchesi & G. Such. Boston: Addison-Wesley.
Denner, J., L. Werner, S. Campe & E. Ortiz (2014) Pair Programming: Under What Conditions Is It Advantageous for Middle School Students? Journal of Research on Technology in Education (Routledge), 46, 277-296.
Nicholls-Ali, Gayle. (2017 March 7). Pair-programming: making good teams takes work [Blog Post]. Retrieved from: https://csforallteachers.org/blog/pair-programming-making-good-teams-takes-work.
Katira, N., L. Williams, E. Wiehe, C. Miller, S. Malik & E. Gehringer. 2004. On Understanding Compatibility of Student Pair Programmers. In SIGCSE ’04. Norfolk, Virginia.
Thomas, L., M. Ratcliffe & A. Robertson. 2003. Code Warriors and Code-a-Phobes: A Study in Attitude and Pair Programming. Presented at SIGCSE, Reno, NV. Williams, L., E. Wiebe, K. Yang, M. Ferzli & C. Miller (2002) In support of Pair
Project Details
The following appendix provides details for each project in the unit including project details, objectives, point totals, and the post-survey results for each question. Some of these details are provided in the chapter on findings; however, this appendix is a complete listing for each project.
Project 1
Project 1 was titled The Name Project and is the first assignment in Exploring Computer Science (Goode/Chapman) Unit 04: Introduction to Programming (p. 135). The objectives for this assignment were to name the basic terms used in Scratch and create the beginning of a simple program in Scratch. Each student created a Scratch account and spent 15-20 minutes working in Scratch.
For the Name Project, students had to have a separate sprite for each letter of their name (5 points), at least three different interesting behaviors for the letters in the name (5 points), all the letters had to have a behavior (4 points), they had to use the “When green Flag Clicked” block (3 points), and they had to use the “Forever” block (3 points). There were two points available for extra credit if students could have their name reinitialize itself when the green flag was clicked. In other words, all the letters would need to start off in the right location facing the correct way. This assignment was to be completed individually. Upon completion of the project, students were asked to complete a survey administered via Google Forms. The results are as follows:
Figure A-1.1 After this assignment, do you feel more confident in your problem-solving skills?
Question 2 – How do you feel about working in a group versus working individually? Do you like it more now, or less?
Figure A-1.2 How do you feel about working in a group versus working individually? Do you like it more now, or less?
Question 3 – How do you feel about computer science as a topic you want to study or as a career you want to have when you are older?
0 5 10 15 20
Yes No Change
Project 1 - The Name Project
0 2 4 6 8 10 12
I like it more No change I like it less
Figure A-1.3 How do you feel about computer science as a topic you want to study or as a career you want to have when you are older?
Question 4 – How likely are you to pursue a career in computer science?
Figure A-1.4 How likely are you to pursue a career in computer science? (1 - Not very likely | 5 - Highly likely)
Question 5 – Are you comfortable programming in AppInventor2/Scratch? 0
2 4 6 8 10 12
I like CS I'm not really interested in CS I am indifferent
Project 1 - The Name Project
0 1 2 3 4 5 6 7 8
1 2 3 4 5
Figure A-1.5 Are you comfortable programming in AppInventor2/Scratch?
Project 2
Project 2 was titled The Dialogue Project and is the second assignment in Exploring Computer Science (Goode/Chapman) Unit 04: Introduction to Programming (p. 139). The objective for this assignment was to develop a dialogue between two or more sprites and explain the reasoning behind how their dialogue works. For this lesson, students develop a dialogue and later, present their dialogue.
For the Dialogue Project, students need to have two or more sprites talking in dialogue (4 points), have three or more sprites talking in dialogue (5 additional points), all sprites are polite and they take turns talking (4 points), each sprite says at least three things (3 points), and the conversations starts using the “When Green Flag is Clicked” block (4 points). Students had an opportunity to earn up to two extra points if they have four or more sprites talking in dialogue. This assignment was completed individually. Upon completion of the project, students were asked to complete a survey administered via Google Forms. The results are as follows:
0 2 4 6 8 10 12 14 16 18
Yes No change No
Question 1 – After this assignment, do you feel more confident in your problem-solving skills?
Figure A-2.1 After this assignment, do you feel more confident in your problem-solving skills?
0 2 4 6 8 10 12 14 16 18
Yes No change No
Question 2 – How do you feel about working in a group versus working individually? Do you like it more now, or less?
Figure A-2.2 How do you feel about working in a group versus working individually? Do you like it more now, or less?
Question 3 – How do you feel about computer science as a topic you want to study or as a career you want to have when you are older?
Figure A-2.3 How do you feel about computer science as a topic you want to study or as a career you want to have when you are older?
0 2 4 6 8 10 12
I like it more No change I like it less
Project 2 - The Dialogue Project
0 2 4 6 8 10 12 14
I like CS I'm not interested in CS I'm indifferent
Question 4 – How likely are you to pursue a career in computer science?
Figure A-2.4 How likely are you to pursue a career in computer science? (1 - Not very likely | 5 - Highly likely)
Question 5 – Are you comfortable programming in AppInventor2/Scratch?
Figure A-2.5 Are you comfortable programming in AppInventer2/Scratch?
0 1 2 3 4 5 6 7 8 9
1 2 3 4 5
Project 2 - The Dialogue Project
0 2 4 6 8 10 12 14 16
Yes No change No
Project 3
Project three was titled The Moving/Baseball Project and is the third assignment in Exploring Computer Science (Goode/Chapman) Unit 04: Introduction to Programming (p. 141). The objectives for this assignment are to explain the three major ways to move sprites and to choose the appropriate method of moving to make a cat circle the bases of a baseball diamond.
For the Moving/Baseball Project, students were given a Google Doc with a set of questions they had to investigate and explain using a provided Scratch file. This
assignment was targeting how to make sprites move in Scratch and students were
expected to investigate the three primary blocks for this, “move [ ] steps”, “go to x: [ ] y: [ ]”, and “glide [ ] secs to x: [ ] y: [ ]”. An extension was added by providing students with a Scratch file that contained a baseball diamond and a sprite to which students needed to implement the code to make the sprite move around the baseball diamond. Students were expected to code the movement such that the sprite touched all the bases and moved and faced the correct direction when doing so. The assignment was the first pair programming assignment for the unit. There was no rubric for this assignment. Students submitted the google Doc to our Google Classroom and students were asked to share their solutions which facilitated a discussion about movement in Scratch. Upon completion of the project, students were asked to complete a survey administered via Google Forms. The results are as follows:
Figure A-3.1 After this assignment, do you feel more confident in your problem-solving skills?
Question 2 – How do you feel about working in a group versus working individually? Do you like it more now, or less?
Figure A-3.2 How do you feel about working in a group versus working individually? Do you like it more now, or less?
0 2 4 6 8 10 12 14
Yes No change No
Project 3 - The Moving/Baseball Project
0 2 4 6 8 10 12
I like it more No change I like it less
Question 3 – How do you feel about computer science as a topic you want to study or as a career you want to have when you are older?
Figure A-3.3 How do you feel about computer science as a topic you want to study or as a career you want to have when you are older?
Question 4 – How likely are you to pursue a career in computer science?
Figure A-3.4 How likely are you to pursue a career in computer science? (1 - Not very likely | 5 - Highly likely)
Question 5 – Are you comfortable programming in AppInventor2/Scratch? 0
2 4 6 8 10 12
I like CS I'm not interested in CS I'm indifferent
Project 3 - The Moving/Baseball Project
0 1 2 3 4 5 6 7 8 9 10
1 2 3 4 5
Figure A-3.5 Are you comfortable programming in AppInventor2/Scratch?
Project 4
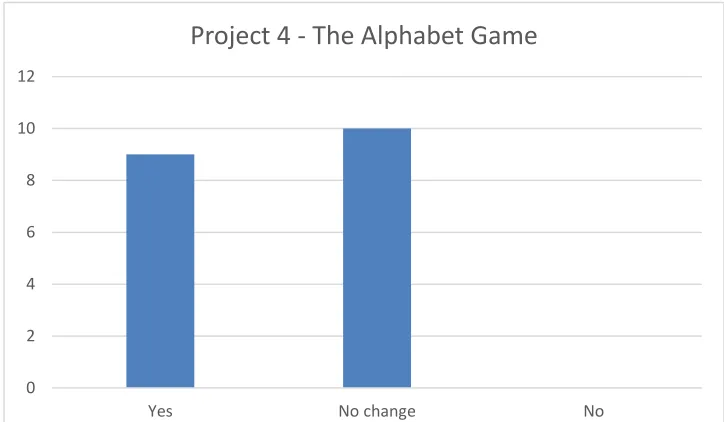
Project 4 was titled The Alphabet Game and is the fourth assignment in Exploring Computer Science (Goode/Chapman) Unit 04: Introduction to Programming (p. 144). The objectives for this assignment include explaining event driven programming and writing a program that responds to user created events from the mouse and keyboard.
For this assignment, students were required to build an Alphabet Game. Students were required to have at least ten different letters (4 points), have a theme for the game (3 points), sprites needed to change costumes when the sprite was clicked on (4 points), the sprites needed to change costume when the corresponding letter on the keyboard was pressed (4 points), students needed to use the “say [ ] for [ ] secs” block to output what the letter stands for (3 points), and all sprites needed to turn to letters when the “When Green Flag Clicked” sprite was clicked on. This was the second pair programming assignment for the unit. Upon completion of the project, students were asked to complete a survey administered via Google Forms. The results are as follows:
0 2 4 6 8 10 12 14 16
Yes No change No
Question 1 – After this assignment, do you feel more confident in your problem-solving skills?
Figure A-4.1 After this assignment, do you feel more confident in your problem-solving skills?
0 2 4 6 8 10 12
Yes No change No