VOLUME 37, ARTICLE 9, PAGES 229
,
250
PUBLISHED 2 AUGUST 2017
http://www.demographic-research.org/Volumes/Vol37/9/ DOI: 10.4054/DemRes.2017.37.9
Research Article
Women’s age at first marriage and marital
instability in the United States:
Differences by race and ethnicity
Evelyn L. Lehrer
Yeon Jeong Son
© 2017 Evelyn L. Lehrer & Yeon Jeong Son.
This open-access work is published under the terms of the Creative Commons Attribution NonCommercial License 2. 0 Germany, which permits use, reproduction,and distribution in any medium for noncommercial purposes, provided the original author(s) and source are given credit.
1 Introduction 230
2 Analytical framework 230
2.1 Age at marriage 231
2.2 Other risk factors for marital dissolution 232
3 Methods 233
4 Results 235
4.1 The association between age at first marriage and marital instability 235
4.2 Other risk factors 241
4.3 Why does the relationship between age at marriage and marital
instability vary by race/ethnicity? 242
5 Discussion 245
6 Acknowledgements 247
Women’s age at first marriage and marital instability
in the United States: Differences by race and ethnicity
Evelyn L. Lehrer1 Yeon Jeong Son2
Abstract
BACKGROUND
Numerous studies have shown that the age at which women enter first marriage is a major factor in marital instability, but possible differences by race/ethnicity have not been examined to date.
OBJECTIVE
Our aim was to study whether the association between women’s age at first marriage and marital instability varies by race/ethnicity.
METHODS
We used data from the 2006–2010 National Survey of Family Growth to examine differences by race/ethnicity in the shape of the curve relating women’s age at entry into first marriage to marital instability.
RESULTS
We found that for non-Hispanic white women, the probability of dissolution falls with age up to ages 30–32 and thereafter the curve flattens out. For black women, marital instability decreases with age only up to ages 24–26. For Hispanic women, marital instability falls from age ≤20 to 21–23 and then the curve flattens out; beyond ages 30– 32 the curve turns upward.
CONCLUSIONS
We suggest explanations for these patterns, based in part on differentials in the associations of age at marriage with education and nonmarital fertility. For white women, but not for their black and Hispanic counterparts, delayed entry into marriage is associated with a small increase in nonmarital fertility and a pronounced increase in education.
1 Economics Department, University of Illinois, Chicago, USA; and IZA, Institute of Labor, Bonn, Germany.
E-Mail:[email protected].
CONTRIBUTION
The common practice in studies with US data of conducting pooled analyses – with simple controls for black, Hispanic, and other – can lead to misleading conclusions. Our findings underscore the desirability of conducting separate analyses by race/ethnicity wherever possible.
1. Introduction
The age at which women enter first marriage has long been known to be a major factor in the stability of unions, but to date little attention has been paid to possible differences by race and ethnicity. The present paper attempts to fill this gap in knowledge. Four recent studies using large-scale US data have conducted analyses that focus on the role of age at first marriage. Two were based on pooled samples of all respondents with controls for the main racial/ethnic groups (Glenn, Uecker, and Love 2010; Rotz 2016). The other two examined non-Hispanic white women only, out of concerns that pooling all groups could lead to misleading results given the pronounced socioeconomic and cultural differences across groups (Lehrer 2008; Lehrer and Chen 2013). Using data from the 2006–2010 National Survey of Family Growth (NSFG), the present paper demonstrates that such concerns are indeed warranted. We begin by replicating the most recently published results on this relationship for non-Hispanic white women (Lehrer and Chen 2013) and then present parallel results for Hispanic and black women. Important differences by race/ethnicity are found. Although our primary goal is to study the relationship between women’s age at first marriage and marital stability, we also discuss differences by race/ethnicity in the effects associated with other risk factors for divorce.
2. Analytical framework
match at the time of marriage. Section 2.1 below discusses the characteristic that is the focus of the present paper, the wife’s age at marriage. Section 2.2 briefly reviews other traits.
2.1 Age at marriage
Two major causal mechanisms for the relationship between women’s age at first marriage and marital instability have been advanced. The first mechanism is based on an extension of Becker’s (1973) pioneering research, which shows that in the optimal sorting the spouses differ in their productivity characteristics but are similar in traits that are complementary in the context of marriage (e.g., education, age, race/ethnicity). According to Oppenheimer’s (1988) “maturity effect,” people who delay entry into marriage are more mature and less likely to make mistakes regarding their own traits and those of their partners; hence they are expected to make better-informed decisions in the marriage market and have more stable unions. The second mechanism ‒ the “poor match effect” advanced by Becker, Landes, and Michael (1977) ‒ suggests that beyond a certain point, increases in women’s age at first marriage can lead to greater marital instability: As the biological clock begins to tick more loudly, women may tend to settle for poorer matches (e.g., a partner who has a very different religion or level of education).
The mechanisms described above are two different, opposing ways in which an older age at marriage may directly influence marital instability. Age at marriage may also affect instability indirectly. As noted above, the risk of dissolution is low when there are large gains from marriage. The magnitude of such gains depends in part on the traits of the spouses at the time of marriage, and in turn such traits are affected by age at marriage. Importantly, women who enter their first marriage at a later age are at greater risk of doing so with a child from a previous informal union, which is a destabilizing influence. They are also more likely to enter marriage having completed a relatively high level of education, a factor that contributes to greater stability. Beyond these effects, part of the association between the wife’s age at marriage and the likelihood of marital dissolution is spurious, reflecting the impact on each of these variables of such traits as the wife’s family background characteristics.
likely driven by the largest group, non-Hispanic whites. We add to this literature by presenting new results for Hispanic and black women.
We have no reasons to believe that there are differences across groups in the nature or magnitude of the direct effects. But differences in the indirect influences are to be expected, as it is well known that non-Hispanic white women have higher levels of education (US Census Bureau 2014) and lower rates of out-of-wedlock childbearing (Martin et al. 2015) than their Hispanic and black counterparts, by wide margins. Thus, the patterns that accompany delayed entry into marriage are expected to differ. As age at marriage increases, we expect to find a large increase in educational attainment and a small increase in nonmarital fertility for non-Hispanic white women, compared to the corresponding changes for black and Hispanic women. Therefore, for the latter two groups, the slope of the curve relating age at marriage to marital instability should be flatter and potentially U-shaped.
2.2 Other risk factors for marital dissolution
Aside from age at marriage, many other factors influence the likelihood of marital dissolution (Weiss 1997; Lehrer 2003). Risk factors that can be measured with variables available in the recent versions of the National Survey of Family Growth are discussed in detail in Lehrer (2008) and are reviewed briefly below.
Individuals raised in non-intact families are expected to have a higher probability of divorce, in part because they have not had an opportunity to learn the skills needed for a successful marriage. They may also see divorce as a way to end an unhappy marital situation, and thus perceive the costs of divorce to be relatively low. Numerous studies have found an inter-generational transmission of divorce (e.g., see Amato and Patterson 2017). Having been brought up with no religion is also expected to be associated with greater marital instability, as some religious involvement during childhood and adolescence has been linked to a number of beneficial influences including better mental health (Waite and Lehrer 2003). For various economic and cultural reasons, the US divorce rate is exceptionally high (Lehrer and Son 2017). Individuals born in foreign countries are thus expected to have a comparatively low probability of marital dissolution.
higher probability of divorce, partly because individuals who have previously experienced marital dissolution have traits that make them more susceptible to divorce (Lehrer 2003). There is a large and growing literature on the association between premarital cohabitation and marital instability. The linkage is largely due to selectivity: individuals who place a lower value on commitment are more likely to cohabit (Lillard, Brien, and Waite 1995). The association has weakened as the prevalence of cohabitation has risen (Manning and Cohen 2012). Finally, age and race/ethnicity are complementary traits in the context of marriage, and differences between the spouses in these characteristics are expected to be destabilizing (Lehrer 2003).
3. Methods
The analysis uses data from the female portion of the 2006–2010 National Survey of Family Growth (NSFG), a questionnaire addressed at a nationally representative sample of individuals aged 15–44 years living in the United States, of all marital statuses. The total sample size is n=12,279. The three main racial/ethnic groups analyzed in this note are non-Hispanic white (henceforth white, for brevity), Hispanic, and non-Hispanic black (henceforth black). After excluding cases corresponding to never-married respondents and those who had missing information for key variables, the sample sizes for white, Hispanic, and black women are, respectively, n=3,184, n=1,269, and n=724. Given the smaller sample size available for black women, the estimates presented for this group must be viewed with some caution.
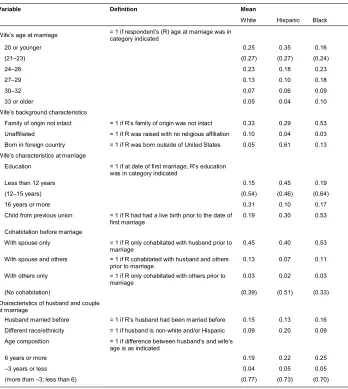
Table 1: Descriptive statistics
Variable Definition Mean
White Hispanic Black
Wife’s age at marriage = 1 if respondent’s (R) age at marriage was in category indicated
20 or younger 0.25 0.35 0.16
(21–23) (0.27) (0.27) (0.24)
24–26 0.23 0.18 0.23
27–29 0.13 0.10 0.18
30–32 0.07 0.06 0.09
33 or older 0.05 0.04 0.10
Wife’s background characteristics
Family of origin not intact = 1 if R’s family of origin was not intact 0.33 0.29 0.53
Unaffiliated = 1 if R was raised with no religious affiliation 0.10 0.04 0.03 Born in foreign country = 1 if R was born outside of United States 0.05 0.61 0.13 Wife’s characteristics at marriage
Education = 1 if at date of first marriage, R’s education was in category indicated
Less than 12 years 0.15 0.45 0.19
(12–15 years) (0.54) (0.46) (0.64)
16 years or more 0.31 0.10 0.17
Child from previous union = 1 if R had had a live birth prior to the date of
first marriage 0.19 0.30 0.53
Cohabitation before marriage
With spouse only = 1 if R only cohabitated with husband prior to
marriage 0.45 0.40 0.53
With spouse and others = 1 if R cohabitated with husband and others prior to marriage
0.13 0.07 0.11
With others only = 1 if R only cohabitated with others prior to marriage
0.03 0.02 0.03
(No cohabitation) (0.39) (0.51) (0.33)
Characteristics of husband and couple at marriage
Husband married before = 1 if R’s husband had been married before 0.15 0.13 0.16 Different race/ethnicity = 1 if husband is non-white and/or Hispanic 0.09 0.20 0.09
Age composition = 1 if difference between husband’s and wife’s age is as indicated
6 years or more 0.19 0.22 0.25
–3 years or less 0.04 0.05 0.05
(more than –3; less than 6) (0.77) (0.73) (0.70)
Note: N= 3,184 for white; N=1,269 for Hispanic; and N=724 for black.
entered first marriage with a child from a previous union, compared to 30% of Hispanic women and 53% of black women. Regarding premarital cohabitation, Hispanic women stood out for the lowest levels: 51% had never cohabited before first marriage, compared to 39% of white women and 33% of black women. Across groups, about 13%–16% of respondents entered first marriage with someone who had been married before. The husband was of different race/ethnicity for 20% of Hispanic women, compared to 9% for their white and black counterparts. Between 4% and 5% of respondents in all groups had wed someone younger than them by 3 years or more. The percentage that married someone at least 6 years older ranged from 19% to 25% across the samples.
Our analyses of risk factors for marital instability were conducted using Cox regressions. Survival time was defined as the period from date of the respondent’s first legal marriage to date of separation.3 Measuring the end of a formal union in this
manner – as happening at date of separation – is important because divorce often never happens in disadvantaged groups. First marriages that were still intact (i.e., no separation) at the interview were treated as censored at that date. Cases of widowhood were coded as censored at date of husband’s death. To assess the magnitude of the various associations, fifth-year dissolution probabilities were evaluated for selected characteristics, based on the complement of the survival function.4
4. Results
4.1 The association between age at first marriage and marital instability
Table 2a replicates earlier analyses based on white women only (Lehrer and Chen 2013). Tables 2b and 2c show parallel regressions for Hispanic and black women. Panel I in each table presents the key findings on associations between the wife’s age at first marriage and marital instability, controlling only for her family background factors. Panel II in each table adds variables indicating the characteristics of the spouses at the time of marriage. Since these variables are omitted in Panel I, the estimates therein may be interpreted as measuring the ‘total effects’ – the association between age at marriage and the dissolution probability due to the influence of age at marriage, plus that due to
3 For a small number of observations, date of separation was unknown; date of divorce was used in these
cases.
4 Such analyses typically use the modal characteristics. The mode was the same across our samples for all
the influence of the spouses’ traits. The results presented in Panels I and II are descriptive – they are not measures of causal effects.
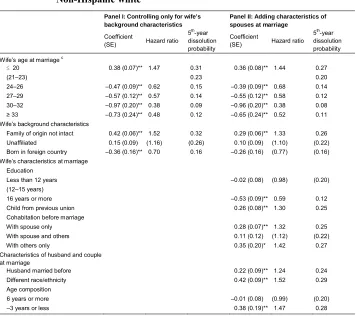
Table 2a: Cox proportional hazards models of marital dissolution – Non-Hispanic whitea,b
Panel I: Controlling only for wife’s background characteristics
Panel II: Adding characteristics of spouses at marriage
Coefficient
(SE) Hazard ratio 5th-year dissolution probability
Coefficient
(SE) Hazard ratio 5th-year dissolution probability
Wife’s age at marriagec
≤20 0.38 (0.07)** 1.47 0.31 0.36 (0.08)** 1.44 0.27
(21–23) 0.23 0.20
24–26 –0.47 (0.09)** 0.62 0.15 –0.39 (0.09)** 0.68 0.14
27–29 –0.57 (0.12)** 0.57 0.14 –0.55 (0.12)** 0.58 0.12
30–32 –0.97 (0.20)** 0.38 0.09 –0.96 (0.20)** 0.38 0.08
≥ 33 –0.73 (0.24)** 0.48 0.12 –0.65 (0.24)** 0.52 0.11
Wife’s background characteristics
Family of origin not intact 0.42 (0.06)** 1.52 0.32 0.29 (0.06)** 1.33 0.26 Unaffiliated 0.15 (0.09) (1.16) (0.26) 0.10 (0.09) (1.10) (0.22) Born in foreign country –0.36 (0.16)** 0.70 0.16 –0.26 (0.16) (0.77) (0.16) Wife’s characteristics at marriage
Education
Less than 12 years –0.02 (0.08) (0.98) (0.20)
(12–15 years)
16 years or more –0.53 (0.09)** 0.59 0.12
Child from previous union 0.26 (0.08)** 1.30 0.25
Cohabitation before marriage
With spouse only 0.28 (0.07)** 1.32 0.25
With spouse and others 0.11 (0.12) (1.12) (0.22)
With others only 0.35 (0.20)* 1.42 0.27
Characteristics of husband and couple at marriage
Husband married before 0.22 (0.09)** 1.24 0.24
Different race/ethnicity 0.42 (0.09)** 1.52 0.29
Age composition
6 years or more –0.01 (0.08) (0.99) (0.20)
–3 years or less 0.38 (0.19)** 1.47 0.28
Note: N = 3,184. ** p < .05; * p < .10
a The fifth-year dissolution probabilities shown in the second row (age category 21-23) correspond to a “reference woman.” For Panel I, the reference woman has the following characteristics: her age at marriage was 21‒23; her family of origin was intact; she had been raised in some religious tradition and was born in the United States. For Panel 2, the reference woman has the following additional traits: she had completed 12‒15 years of schooling at the time of marriage and had not had any premarital cohabitation; her husband had not been married before; the spouses shared the same race/ethnicity; and the age gap between husband and wife was between ‒2 and 5 years.
b For coefficients that were not significantly different from the baseline category, the hazard ratios and estimated fifth-year dissolution probabilities are shown in parentheses. For the case of the age dummies, the reference is age 21–23.
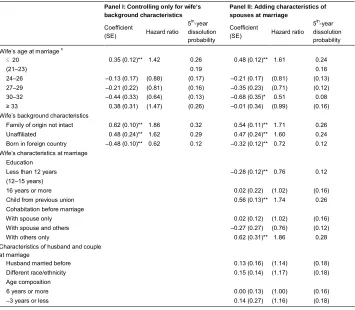
Table 2b: Cox proportional hazards models of marital dissolution – Hispanica,b
Panel I: Controlling only for wife’s background characteristics
Panel II: Adding characteristics of spouses at marriage
Coefficient
(SE) Hazard ratio 5th-year dissolution probability
Coefficient
(SE) Hazard ratio 5th-year dissolution probability
Wife’s age at marriagec
≤20 0.35 (0.12)** 1.42 0.26 0.48 (0.12)** 1.61 0.24
(21–23) 0.19 0.16
24–26 –0.13 (0.17) (0.88) (0.17) –0.21 (0.17) (0.81) (0.13) 27–29 –0.21 (0.22) (0.81) (0.16) –0.35 (0.23) (0.71) (0.12) 30–32 –0.44 (0.33) (0.64) (0.13) –0.68 (0.35)* 0.51 0.08 ≥ 33 0.38 (0.31) (1.47) (0.26) –0.01 (0.34) (0.99) (0.16) Wife’s background characteristics
Family of origin not intact 0.62 (0.10)** 1.86 0.32 0.54 (0.11)** 1.71 0.26 Unaffiliated 0.48 (0.24)** 1.62 0.29 0.47 (0.24)** 1.60 0.24 Born in foreign country –0.48 (0.10)** 0.62 0.12 –0.32 (0.12)** 0.72 0.12 Wife’s characteristics at marriage
Education
Less than 12 years –0.28 (0.12)** 0.76 0.12
(12–15 years)
16 years or more 0.02 (0.22) (1.02) (0.16)
Child from previous union 0.56 (0.13)** 1.74 0.26
Cohabitation before marriage
With spouse only 0.02 (0.12) (1.02) (0.16)
With spouse and others –0.27 (0.27) (0.76) (0.12)
With others only 0.62 (0.31)** 1.86 0.28
Characteristics of husband and couple at marriage
Husband married before 0.13 (0.16) (1.14) (0.18)
Different race/ethnicity 0.15 (0.14) (1.17) (0.18)
Age composition
6 years or more 0.00 (0.13) (1.00) (0.16)
–3 years or less 0.14 (0.27) (1.16) (0.18)
Note: N = 1,269. ** p < .05; * p < .10 a, b See footnotes a and b in Table 1a.
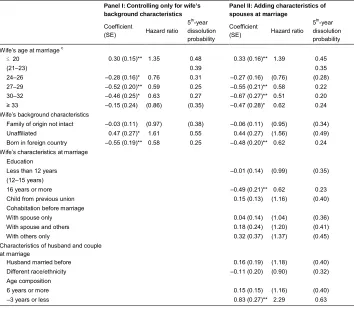
Table 2c: Cox proportional hazards models of marital dissolution – Blacka,b
Panel I: Controlling only for wife’s background characteristics
Panel II: Adding characteristics of spouses at marriage
Coefficient
(SE) Hazard ratio 5th-year dissolution probability
Coefficient
(SE) Hazard ratio 5th-year dissolution probability
Wife’s age at marriagec
≤20 0.30 (0.15)** 1.35 0.48 0.33 (0.16)** 1.39 0.45
(21–23) 0.39 0.35
24–26 –0.28 (0.16)* 0.76 0.31 –0.27 (0.16) (0.76) (0.28)
27–29 –0.52 (0.20)** 0.59 0.25 –0.55 (0.21)** 0.58 0.22
30–32 –0.46 (0.25)* 0.63 0.27 –0.67 (0.27)** 0.51 0.20
≥ 33 –0.15 (0.24) (0.86) (0.35) –0.47 (0.28)* 0.62 0.24 Wife’s background characteristics
Family of origin not intact –0.03 (0.11) (0.97) (0.38) –0.06 (0.11) (0.95) (0.34) Unaffiliated 0.47 (0.27)* 1.61 0.55 0.44 (0.27) (1.56) (0.49) Born in foreign country –0.55 (0.19)** 0.58 0.25 –0.48 (0.20)** 0.62 0.24 Wife’s characteristics at marriage
Education
Less than 12 years –0.01 (0.14) (0.99) (0.35)
(12–15 years)
16 years or more –0.49 (0.21)** 0.62 0.23
Child from previous union 0.15 (0.13) (1.16) (0.40)
Cohabitation before marriage
With spouse only 0.04 (0.14) (1.04) (0.36)
With spouse and others 0.18 (0.24) (1.20) (0.41)
With others only 0.32 (0.37) (1.37) (0.45)
Characteristics of husband and couple at marriage
Husband married before 0.16 (0.19) (1.18) (0.40)
Different race/ethnicity –0.11 (0.20) (0.90) (0.32)
Age composition
6 years or more 0.15 (0.15) (1.16) (0.40)
–3 years or less 0.83 (0.27)** 2.29 0.63
Note: N = 724. ** p < .05; * p < .10 a, b See footnotes a and b in Table 1a.
c The significance tests shown in the table use age 21–23 as base. For the Panel I model, additional pairwise comparisons between successive age dummies showed that none of the differences are significant at the 0.10 level.
The explanatory variables included in the model are exactly as in the earlier paper, except that one new background variable has been added: whether the respondent was born in the United States or a foreign country – an important risk factor for this study on differences by race/ethnicity.
small increase (from 0.09 to 0.12) in the fifth-year dissolution probability in going from ages 30–32 to ≥33, the difference between the corresponding coefficients is not statistically significant. The number of cases in the 30–32 and ≥33 age categories is sizeable, 223 and 159 respectively, suggesting that the lack of significance is not a sample size issue.
Table 2b, Panel I, shows that the pattern for Hispanics is strikingly different. The fifth-year dissolution probability declines as age goes from ≤20 to 21–23, and thereafter the curve remains flat through ages 30–32. Beyond this point the curve turns upward: the fifth year dissolution probability goes from 0.13 for ages 30–32 to fully double that amount for ages ≥33. The difference is significant at the 0.05 level, which is especially noteworthy given that there are only 76 and 51 cases, respectively, in the 30–32 and ≥33 age categories.
For the black sample, Table 2c, Panel I shows that the fifth-year dissolution probabilities are much higher than the corresponding estimates for the white and Hispanic samples. Consistent with earlier research, these findings underscore the greater instability of black women’s marriages (Teachman 1986; Phillips and Sweeney 2005).5 With regard to the effects associated with wife’s age at marriage, the fifth-year
dissolution probability declines as age goes from ≤20 to 21–23, and there is a statistically significant further drop (p<0.10) when age goes to 24–26. The curve flattens thereafter. The point estimates do suggest an upturn in the curve between ages 30–32 and ≥33, with the probability rising from 0.27 to 0.35 – a non-trivial increase of 8 percentage points. But this difference does not attain statistical significance, possibly because of sample size considerations (n=65 and n=72, respectively, for the 30–32 and ≥ 33groups).
In sum, the results show that for white women the fifth-year marital dissolution probability falls steadily and substantially with age at marriage up to ages 30–32, and thereafter the curve flattens out. By contrast, for Hispanics the probability declines with age at marriage only from ≤20 to 21–23, flattening out at that point; beyond ages 30–32 it turns upward, producing a clearly U-shaped relationship. In the case of black women, the probability of dissolution declines with age at marriage until ages 24–26 and becomes flat thereafter. Although the point estimates suggest an upturn at age ≥33, no firm conclusions can be drawn given sample size limitations for this group. As a robustness check, we re-estimated these relationships for each racial/ethnic group using logit regressions for dissolution by the second, fifth, and seventh years. Significance
5 At first glance one would think that the true differences in marital instability between the marriages of black
levels were lower, as expected given that the logit model does not exploit information on the precise timing of the dissolution. But the point estimates generally confirmed the patterns described above (results not reported).
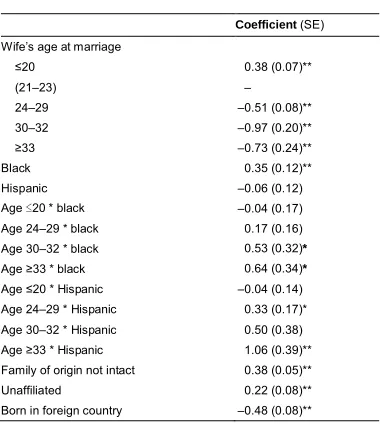
Table 3 presents results from the Panel I model estimated with pooled data for white, Hispanic, and black respondents, including interaction terms between each age-at-first-marriage category and dummy variables for Hispanic and black. The coefficient on the dummy for ages 24–26 was not significantly different from that on the dummy for ages 27–29 for any of the racial/ethnic groups, so the two age categories were merged for these analyses. For the three groups there is a substantial decline in the probability of marital dissolution in going from age 20 or less to the 21–23 age category, so it is not surprising that the coefficients on the interaction terms between age ≤20 and the dummy variables for black and Hispanic are not statistically significant. For the later age categories, two of the coefficients on interactions with black are significant at the 0.10 level; with regard to the interactions with Hispanic, one of the coefficients is significant at the 0.10 level and the other, corresponding to the age ≥33 category, is significant at the 0.05 level.
Table 3: Cox proportional hazards model with pooled data, including interaction terms
Coefficient (SE) Wife’s age at marriage
≤20 0.38 (0.07)**
(21–23) –
24–29 –0.51 (0.08)**
30–32 –0.97 (0.20)**
≥33 –0.73 (0.24)**
Black 0.35 (0.12)**
Hispanic –0.06 (0.12)
Age≤20 * black –0.04 (0.17) Age 24–29 * black 0.17 (0.16) Age 30–32 * black 0.53 (0.32)*
Age ≥33 * black 0.64 (0.34)*
Age ≤20 * Hispanic –0.04 (0.14) Age 24–29 * Hispanic 0.33 (0.17)* Age 30–32 * Hispanic 0.50 (0.38) Age ≥33 * Hispanic 1.06 (0.39)** Family of origin not intact 0.38 (0.05)**
Unaffiliated 0.22 (0.08)**
Born in foreign country –0.48 (0.08)**
Before examining possible reasons for the differences among racial/ethnic groups in the relationship between age at marriage and marital instability, we turn to a comparative description of the other risk factors for divorce.
4.2 Other risk factors
The Panel II results in Tables 2a, 2b, and 2c correspond to Cox models that add the wife’s characteristics at marriage and also the traits of the husband and couple, thus including all the observed risk factors for marriage dissolution. For white and Hispanic respondents the risk of dissolution was higher for those whose families of origin were non-intact, but no significant effect could be discerned in the black sample. While the coefficient on having been raised with no religious affiliation was insignificant in the white sample, the magnitude of the association for Hispanics was large – an increase in the fifth-year dissolution probability from 0.16 to 0.24. In the black sample the point estimates again suggest a large increase, from 0.35 to 0.49, although significance was low (p=0.11). These results may reflect differences by race/ethnicity in the composition of the respondents raised with no affiliation, and related differences in socioeconomic status.6 Foreign-born respondents had lower levels of marital instability in the three samples. The difference in the fifth-year dissolution probabilities for foreign-born vs. native-born respondents was 4 percentage points in the white and Hispanic samples, and only marginally significant in the white group (p=0.11). The difference in the black group was larger, namely 11 percentage points, likely reflecting the pronounced socioeconomic advantage of foreign-born blacks in the United States relative to their native counterparts (Bennett and Lutz 2009; Corra and Borch 2014).
Compared to respondents who entered marriage with only 12–15 years of schooling, those who had completed 16 years or more of schooling had substantially lower levels of instability in the white and black samples. In the Hispanic sample, where only 10% of the respondents had completed at least 16 years, no significant differences could be discerned; the lowest dissolution probability actually corresponded to the women with the least education, suggesting a different dynamic for this group. Among women with less than 12 years of schooling, Hispanic women have the lowest
6 The NSFG unfortunately did not make a distinction between different reasons for having been raised with
levels of education by a wide margin, and hence the largest barriers to economic self-sufficiency.7 They may thus have to stay in marriages, regardless of marital quality.
The results for the presence of a child from a previous union also varied across the groups. In the traditional Hispanic sample, where nonmarital fertility may be regarded as more problematic, such presence was associated with a large destabilizing impact: an increase in the fifth-year dissolution probability from 0.16 to 0.26. At the other extreme, no significant destabilizing effect could be discerned for black women, likely reflecting more liberal attitudes. The estimate for the white sample was at the center of the distribution, with an increase of moderate size, from 0.20 to 0.25.
For white women, but not for their black or Hispanic counterparts, respondents who had cohabited only with their future husband had an elevated risk of marital disruption. These findings are consistent with earlier research that focuses on racial/ethnic differences in the effects of cohabitation. The study, which emphasizes the importance of variations across groups in the nature and meaning of cohabitation, also finds that cohabitation with others only is associated with an increased probability of marital dissolution for white women but not for Mexican American women (Phillips and Sweeney 2005). Our estimates show a significant effect for both white and Hispanic women, possibly reflecting heterogeneity within the latter group.
The variables indicating a previous marriage of the husband and marriage to someone of different race/ethnicity were associated with lower marital stability in the white sample only. The wife being older than the husband by three years or more was associated with no effect in the Hispanic sample and a moderate destabilizing effect in the white sample, with an increase in the fifth-year dissolution probability from 0.20 to 0.28; in contrast, the increase in the black sample was pronounced, from 0.35 to 0.63.
4.3 Why does the relationship between age at marriage and marital instability vary by race/ethnicity?
The main finding in this paper is that the shape of the curve relating bride’s age to the probability of marital disruption differs across racial/ethnic groups, although the differences between white and black marriages are offered tentative due to limitations of sample size. Tables 4a, 4b, and 4c suggest possible reasons for the differences we uncovered. In all groups, women who delayed marriage were more likely to be found in those unconventional unions typically associated with high dissolution rates: unions where the husband had been married before, where the wife had previously cohabited,
7 Among respondents who had less than 12 years of schooling in our NSFG samples, the percentage who had
and where she was at least three years older than her spouse.8 But important differences
by race/ethnicity are evident in the two areas highlighted in the introduction: nonmarital fertility and education.
Table 4a: Selected characteristics by respondent’s age at marriage – Non-Hispanic white
Age at marriage
20 or younger 21–23 24–26 27–29 30 or older (p-value) test
Wife’s characteristics at marriage Education
Less than 12 years 31.35 10.84 6.42 11.14 8.15 <.01
16 years or more 4.70 24.97 43.98 51.74 52.45
Child from previous union 15.10 21.08 18.72 18.56 22.83 <.01 Characteristics of husband
and couple at marriage
Husband married before 10.03 11.31 14.04 21.35 31.52 <.01 Cohabitation before marriage
Never cohabited 31.09 35.10 33.29 21.35 20.65 <.01
Age difference
–3 years or less 0.25 0.71 2.27 7.66 16.30 <.01
Race/ethnicity difference 10.66 8.83 6.82 9.74 7.61 .08
Note: N = 3,184.
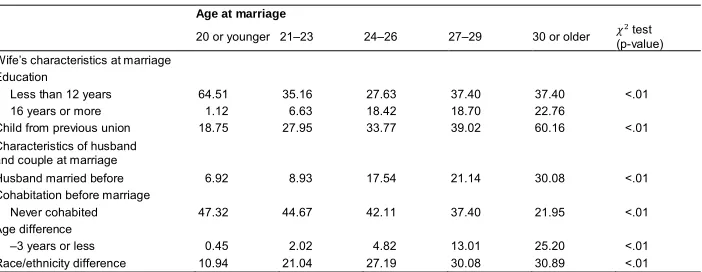
Table 4b: Selected characteristics by respondent’s age at marriage – Hispanic
Age at marriage
20 or younger 21–23 24–26 27–29 30 or older (p-value) test
Wife’s characteristics at marriage Education
Less than 12 years 64.51 35.16 27.63 37.40 37.40 <.01
16 years or more 1.12 6.63 18.42 18.70 22.76
Child from previous union 18.75 27.95 33.77 39.02 60.16 <.01 Characteristics of husband
and couple at marriage
Husband married before 6.92 8.93 17.54 21.14 30.08 <.01
Cohabitation before marriage
Never cohabited 47.32 44.67 42.11 37.40 21.95 <.01
Age difference
–3 years or less 0.45 2.02 4.82 13.01 25.20 <.01
Race/ethnicity difference 10.94 21.04 27.19 30.08 30.89 <.01
Note: N =1,269.
8 Based on data with richer information on husbands’ characteristics, earlier research for non-Hispanic white
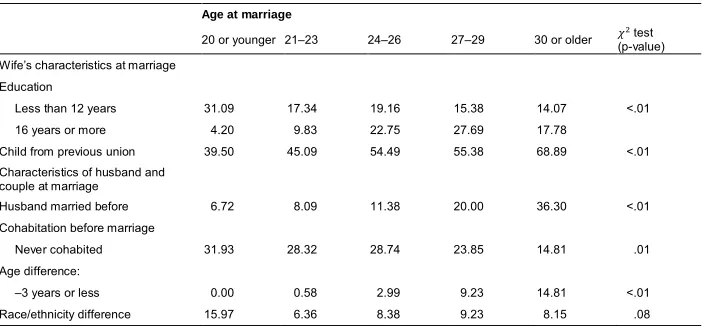
Table 4c: Selected characteristics by respondent’s age at marriage – Black
Age at marriage
20 or younger 21–23 24–26 27–29 30 or older (p-value) test
Wife’s characteristics at marriage Education
Less than 12 years 31.09 17.34 19.16 15.38 14.07 <.01
16 years or more 4.20 9.83 22.75 27.69 17.78
Child from previous union 39.50 45.09 54.49 55.38 68.89 <.01 Characteristics of husband and
couple at marriage
Husband married before 6.72 8.09 11.38 20.00 36.30 <.01
Cohabitation before marriage
Never cohabited 31.93 28.32 28.74 23.85 14.81 .01
Age difference:
–3 years or less 0.00 0.58 2.99 9.23 14.81 <.01
Race/ethnicity difference 15.97 6.36 8.38 9.23 8.15 .08
Note: N =724.
First, although the likelihood of entering marriage with a child from a previous union increased with bride’s age in the three groups, the magnitude of the change varied greatly. Among white brides, 15% of those who entered marriage at age 20 or before had a child, compared to 23% among those who did so at age 30 or later. The corresponding increase was larger in the black sample, from 40% to 69%, and even more pronounced in the Hispanic sample, from 19% to 60%.9 Second, there was also a
striking difference by race/ethnicity in the patterns associated with wife’s education at the time of marriage. In the white sample, the percentage of women who had completed 16 years of schooling or more increased markedly with bride’s age, from 5% for those who married at age 20 or younger to 52% for those who did so at age 30 or older. The magnitude of the change was much smaller for the other two groups: from 1% to 23% in the Hispanic sample and from 4% to 18% in the black sample.
Thus the patterns of investments in school and nonmarital fertility that accompany delayed entry into first marriage clearly vary by race/ethnicity. Consistent with expectations, among white women delayed entry is generally accompanied by a markedly higher level of human capital, and given the tendency for positive assortative mating by education, correspondingly higher levels of spouse’s human capital also (Schwartz and Mare 2005). Overall, these patterns imply an increase with bride’s age not only in the maturity that comes with being older, but also in the level of economic
9 Overall, the level of nonmarital fertility is lower for Hispanic than for black women – a mean of 0.30
resources. The increase in resources is far smaller for Hispanic and black women, likely contributing to the early flattening out of the curve relating bride’s age to the marital disruption probability.
We had anticipated that the large increase with age at marriage in out-of-wedlock childbearing in the two racial/ethnic minority groups would also contribute to a flatter curve. This factor appears to be more important for Hispanic than for black women, given the sharper increase with age at marriage in nonmarital fertility for the former. Moreover, as noted earlier, in this more traditional segment of the population the presence of a child from a previous union is associated with a strong destabilizing effect. These considerations likely contribute to the eventual upturn in the curve for the Hispanic group.
For the case of non-Hispanic white women, the Lehrer-Chen (2013) study was able to go farther in exploring reasons for the shape of the curve. The sample size for this group was large enough to permit separate analyses for the subgroup of women who delayed entry into marriage to age 27 or beyond. Based on these regressions, it was possible to formally test two different explanations for the puzzle that although unions that begin late disproportionately involve unconventional matches, they tend to be very solid. The first hypothesis is that whatever challenges such matches may pose, they can be addressed with the greater resources and higher levels of maturity that come with more education and older ages, respectively. That is, the destabilizing effects typically associated with such factors as religious or racial/ethnic heterogamy may simply not be present in couples that have delayed entry into marriage. The second hypothesis is that these indicators of unconventional matches are always associated with higher odds of marital disruption – even in couples that have delayed entry into marriage – but the stabilizing effect associated with older ages and higher levels of educational attainment are far larger, and dominate. The statistical analyses provided strong support for the second hypothesis.
5. Discussion
While no previous research has focused on racial/ethnic differences in the relationship between age at marriage and marital stability, several comparative studies on the stability of white and black marriages have included a variable for bride’s age. Early investigations entered this variable in a linear way (Teachman 1986; Heaton and Jacobson 1994); more recent work has used a series of age dummy variables, but has included information only on significance tests by comparison to teenage marriages (Sweeney and Philips 2004; Phillips and Sweeney 2005). Moreover, since the bride’s age was not the focus of these studies, the results presented correspond to our Panel II (not Panel I) estimates. Thus, firm conclusions regarding the shape of the bride’s age – marital instability relationship cannot be drawn from these studies. But the point estimates therein generally confirm that while delayed entry into marriage is associated with substantially lower marital instability for white women, for their black counterparts the decrease in instability is small or nonexistent. One of the studies cited above also includes a sample of Mexican American respondents (Phillips and Sweeney 2005). None of the coefficients on the age dummies are significantly different from the teenage marriage category; thus for this subset of the Hispanic group, increases in bride’s age were not associated with reductions in marital instability, not even in going from the teenage years to the early twenties.
Recent research using three different statistical techniques and taking advantage of rich data sets (including state-level variables and information on siblings) concludes that the increase in age at marriage has been the main proximate cause for the downward trend in the divorce rate in the United States since 1980 (Rotz 2016). The analyses employ samples of all racial/ethnic groups pooled together, and it is safe to assume that the results are driven by the largest group, non-Hispanic white women. An important limitation of the present study is that the data set utilized permitted only descriptive analyses. At the same time, a contribution of this study is that the comparatively large sample sizes available for black women and especially Hispanic women allowed us to conduct separate analyses by race/ethnicity. Such analyses uncovered major differences across groups in the shape of the curve relating bride’s age to marital instability, and related differences in the associations of age at marriage with educational attainment and nonmarital fertility. Looking ahead, we need further research along the lines of Rotz’s careful causal analyses, conducted separately by race/ethnicity. This will require data sets that contain both rich information on relevant variables and large numbers of Hispanic and black respondents.
such stability is an indicator of high-quality marriages, or of the inability of women to leave unhappy unions due to barriers to economic self-sufficiency.
Our finding that the shape of the curve relating women’s age at first marriage to marital instability is different for the three main racial/ethnic groups in the United States illustrates how analyses of pooled samples – with simple controls for black, Hispanic, and other – can lead to misleading conclusions. Research on demographic phenomena often does this. Our results underscore the desirability of conducting separate analyses by race/ethnicity wherever possible. Where sample size limitations make this unfeasible it will be important to conduct sensitivity analyses, paying attention to changes observed when respondents from each of the main racial/ethnic groups are excluded.
6. Acknowledgements
References
Amato, P.R. and Patterson, S. (2017). The intergenerational transmission of union instability in early adulthood. Journal of Marriage and the Family 79(3): 591– 890.doi:10.1111/jomf.12384.
Becker, G.S. (1973). A theory of marriage. In: Schultz, T.W. (ed.).Economics of the family: Marriage, children, and human capital. Chicago: University of Chicago Press: 299–344.
Becker, G.S., Landes, E.M., and Michael, R.T. (1977). An economic analysis of marital instability. Journal of Political Economy 85(6): 1141–1187. doi:10.1086/2606 31.
Bennett, P.R. and Lutz, A. (2009). How African American is the net black advantage? Differences in college attendance among immigrant blacks, native blacks, and whites.Sociology of Education82(1): 70–100. doi:10.1177/003804070908200 104.
Chiswick, C.U. and Lehrer, E.L. (1990). On marriage-specific human capital: Its role as a determinant of remarriage. Journal of Population Economics 3(3): 193–213.
doi:10.1007/BF00163075.
Corra, M.K. and Borch, C. (2014). Socioeconomic differences among blacks in America: Over time trends.Race and Social Problems 6(2): 103–119.
doi:10.1007/s12552-014-9114-5.
Glenn, N.D., Uecker, J.E., and Love, R.W.B. (2010). Later first marriage and marital success. Social Science Research 39: 787–800. doi:10.1016/j.ssresearch.2010. 06.002.
Heaton, T.M. and Jacobson, C.K. (1994). Race differences in changing family demographics in the 1980s. Journal of Family Issues 15(2): 290–308.
doi:10.1177/0192513X94015002008.
Lehrer, E.L. (2003). The economics of divorce. In: Grossbard-Shechtman, S. (ed.).
Marriage and the economy: Theory and evidence from industrialized societies. Cambridge: Cambridge University Press: 54–74. doi:10.1017/CBO978051161 5863.005.
Lehrer, E.L. (2008). Age at marriage and marital instability: Revisiting the Becker-Landes-Michael hypothesis. Journal of Population Economics21(2): 463–484.
Lehrer, E.L. and Chen, Y. (2013). Delayed entry into first marriage and marital stability: Further evidence on the Becker-Landes-Michael hypothesis.
Demographic Research 29(20): 521–542.doi:10.4054/DemRes.2013.29.20. Lehrer, E.L. and Son, Y.J. (2017). Marital instability in the U.S.: Trends, driving forces,
and implications for children. In: Averett, S.L., Argys, L.M., and Hoffman, S.D. (eds.). Oxford handbook on the economics of women. New York: Oxford University Press. Forthcoming.
Lillard, L., Brien, M.J., and Waite, L.J. (1995). Premarital cohabitation and subsequent marital dissolution: A matter of self-selection? Demography 32(3): 437–457.
doi:10.2307/2061690.
Manning, W.D. and Cohen, J.A. (2012). Premarital cohabitation and marital dissolution: An examination of recent marriages. Journal of Marriage and the Family 74(2): 377–387.doi:10.1111/j.1741-3737.2012.00960.x.
Martin, J.A., Hamilton, B.E., Osterman, M.J., Curtin, S.C., and Matthews, T.J. (2015). Births: Final data for 2013.National Vital Statistics Reports 64(1): 1–65. Massengill, R.P. (2014). Nonaffiliation and socioeconomic status: Differences in
education and income between atheists and agnostics and ‘nothing in particular’s. In: Keister, L.A. and Sherkat, D.E. (eds.).Religion and inequality in America: Research and theory on religion’s role in stratification. New York: Cambridge University Press: 31–51.doi:10.1017/CBO9781139226479.004. McLanahan, S. (2004). Diverging destinies: How children are faring under the second
demographic transition. Demography 41(4): 607–627. doi:10.1353/dem.2004. 0033.
Michael, R.T. (1974). Determinants of divorce. In: Levy-Garboua, L. (ed.).
Sociological economics. London: Sage: 189–222.
Oppenheimer, V.K. (1988). A theory of marriage timing. American Journal of Sociology 94(3): 563–591.doi:10.1086/229030.
Phillips, J.M. and Sweeney, M.M. (2005). Premarital cohabitation and marital disruption among white, black, and Mexican American women. Journal of Marriage and the Family 67(2): 296–314. doi:10.1111/j.0022-2445.2005.001 17.x.
Rotz, D. (2016). Why have divorce rates fallen? The role of women’s age at marriage.
Schwartz, C.R. and Mare, R.D. (2005). Trends in educational assortative marriage from 1940 to 2003.Demography 42(4): 621–646.doi:10.1353/dem.2005.0036. Sweeney, M.M. and Phillips, J.A. (2004). Understanding racial differences in marital
disruption: Recent trends and explanations.Journal of Marriage and the Family
66(3): 639–650.doi:10.1111/j.0022-2445.2004.00043.x.
Teachman, J.D. (1986). First and second marital dissolution: A decomposition exercise for whites and blacks.The Sociological Quarterly 27(4): 571–590.doi:10.1111/ j.1533-8525.1986.tb00279.x.
United States Census Bureau (2014). Educational attainment in the United States [electronic resource]. Washington, D.C.: United States Census Bureau.
https://www.census.gov/data/tables/2014/demo/educational-attainment/cps-detailed-tables.html.
Waite, L.J. and Lehrer, E.L. (2003). The benefits from marriage and religion in the United States: A comparative analysis. Population and Development Review
29(2): 255–275.doi:10.1111/j.1728-4457.2003.00255.x.
Weiss, Y. (1997). The formation and dissolution of families: Why marry? Who marries whom? And what happens upon divorce. In: Rosenzweig, M. and Star, O. (eds.).
Handbook of population and family economics. Amsterdam: Elsevier: 81–123.