CAPUT-MEDUSAE SUBSPECIES ASPERUM: BIOGEOGRAPHY OF AN INVASIVE, SELF-POLLINATING, ANNUAL GRASS IN ITS NATIVE RANGE
by Peter Guerdan
A thesis
submitted in partial fulfillment of the requirements for the degree of
Master of Science in Biology Boise State University
DEFENSE COMMITTEE AND FINAL READING APPROVALS
of the thesis submitted by
Peter Guerdan
Thesis Title: Genetic Analysis of Eurasian Populations of Taeniatherum caput-medusae subspecies asperum: Biogeography of an Invasive, Self-Pollinating, Annual Grass in Its Native Range
Date of Final Oral Examination: 4 May 2016
The following individuals read and discussed the thesis submitted by student Peter Guerdan, and they evaluated his presentation and response to questions during the final oral examination. They found that the student passed the final oral examination.
Stephen Novak, Ph.D. Chair, Supervisory Committee James F. Smith, Ph.D. Member, Supervisory Committee René Sforza, Ph.D. Member, Supervisory Committee
iv DEDICATION
To my brothers, without whom I would not be here to do this thesis. I am forever in your debt. Eddie, Jeff, Alex, Ryan, Nate, Steve, Justin, Brandon, Tyler, Cory, Paul, Bobby, Rob, Clayton, and Chris. Dagaz Maidan, De Oppresso Liber!
v
ACKNOWLEDGEMENTS
vi ABSTRACT
vii
viii
TABLE OF CONTENTS
DEDICATION ... iv
ACKNOWLEDGEMENTS ...v
ABSTRACT ... vi
LIST OF TABLES ...x
LIST OF FIGURES ... xii
INTRODUCTION ...1
METHODS ...8
Plant Collections ...8
DNA Extraction and AFLP Procedures ...8
AFLP Loci Selection and Error Rate Estimation ...10
Data Analysis ...11
Evaluating the Central-Marginal Hypothesis...15
Comparing Molecular Markers: AFLPs and Allozymes ...16
RESULTS ...17
Genetic Diversity ...18
Genetic Structure ...18
Multilocus Genotypes ...21
Biogeographical Patterns ...22
ix
DISCUSSION ...25
Genetic Diversity ...25
Genetic Structure ...28
Biogeographical Pattern ...30
Comparison with Other Studies Assessing Biogeographic Pattern ...33
Comparison of AFLP and Allozyme Results...35
Conclusions ...36
LITERATURE CITED ...38
TABLES AND FIGURES ...49
APPENDIX A ...85
Population Pairwise FST values. Population Pairwise Comparisons Are Ordered in Each Population’s List of Values in the Order Following the Population Codes to the Left of Each Block of Data. ...85
APPENDIX B ...98
x
LIST OF TABLES
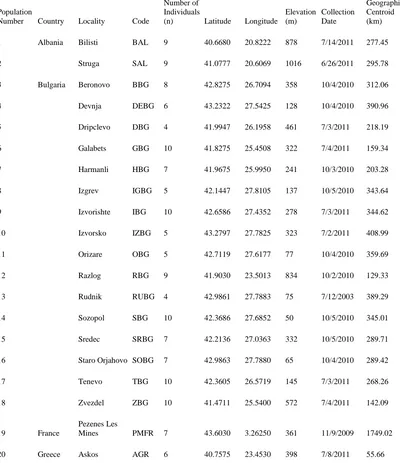
Table 1 Locality Data for 70 native populations of Taeniatherum caput-medusae subspecies asperum analyzed in this study. Also included is each population’s Euclidian distance from the calculated geographic
centroid. ... 49 Table 2 (A) Amplified Fragment Length Polymorphism (AFLP) Adaptor Pair,
Pre-Selective Amplification, and Selective Amplification Sequences. (B) Selective Amplification Primer pair combinations. ... 52 Table 3 Within-population genetic diversity parameters based on 110 AFLP loci
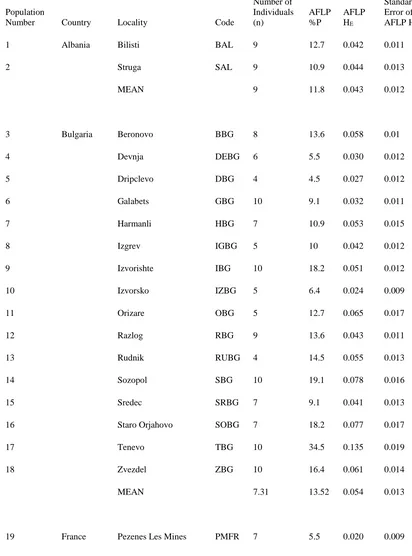
for 70 native populations of Taeniatherum caput-medusae subspecies asperum. ... 54 Table 4 Within-population genetic diversity parameters based on 110 AFLP loci
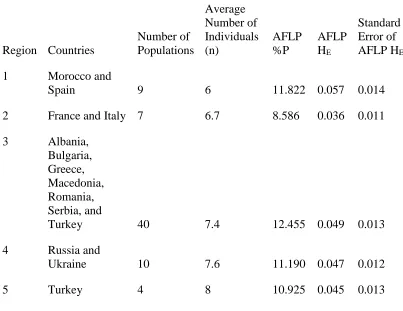
for 70 native populations of Taeniatherum caput-medusae subspecies asperum based on their assignment to five geographic regions. See text for a description of these geographic regions. ... 58 Table 5 Nei’s genetic diversity statistics for 70 native populations of Taeniatherum
caput-medusae subspecies asperum. A description of the parameters HT, HS, DST, GST, and FST is provided in the text. ... 59 Table 6 Analysis of Molecular Variance (AMOVA) for 70 native populations of
Taeniatherum caput-medusae subspecies asperum. AMOVA
hierarchically partitioning genetic diversity within populations and among populations (A). AMOVA hierarchically partitioning genetic diversity within populations, among populations within regions and among five geographic regions (B). See the text for a description of the populations assigned to the five regions. (P<0.001 for both analyses). ... 60 Table 7 Distribution and frequency of AFLP Multilocus Genotypes (MLGs)
within Populations of Taeniatherum caput-medusae subspecies asperum. See text for descriptions of AFLP MLG ID... 61 Table 8 Simpson’s and Shannon-Wiener genotypic diversity indices for 70 native
xi
xii
LIST OF FIGURES
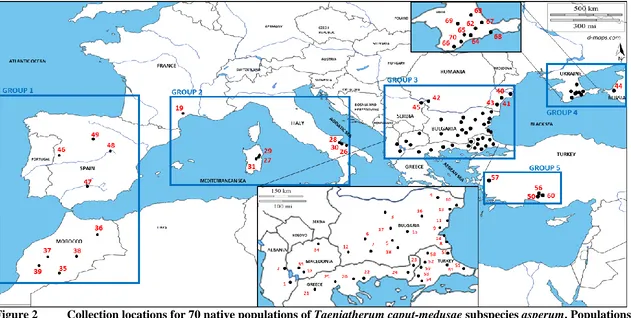
Figure 1 Images of Taeniatherum caput-medusae plants from the species’ native range. Taeniatherum caput-medusae subsp. asperum (A), T. caput-medusae subsp. caput-medusae (B), T. caput-medusae subsp. crinitum (C) ... 72 Figure 2 Collection locations for 70 native populations of Taeniatherum
caput-medusae subspecies asperum. Populations were grouped into five
geographic regions as shown here. ... 73 Figure 3 Correlation between the number of AFLP MLG and population sample
size (n). ... 74 Figure 4 Neighbor-Joining tree the genetic relationships of 70 native populations
of Taeniatherum caput-medusae subspecies asperum. Figure created with PHYLIP 3.695. Note that the populations from each Region are grouped by color. ... 75 Figure 5 Results of the logarithmic probability of clustering of native populations
of Taeniatherum caput-medusae subspecies asperum. See text for discussion of inferring the true value of K (clusters). Logarithmic probability L(K) of K based on the method of Pritchard et al. (2000) (A), and the ΔK method described by Evanno et al. (2005) (B). ... 76 Figure 6 Population genetic structure analysis based on K = 9. STRUCTURE
cluster assignments for each of the 495 individuals from 70 native populations of Taeniatherum caput-medusae subspecies asperum (A). STRUCTURE cluster assignments for the 70 native populations of
Taeniatherum caput-medusae subspecies asperum (B). ... 78 Figure 7 Analyses of the Central-Marginal Hypothesis with AFLP molecular data.
Linear regression analysis of AFLP expected heterozygosity (HE) and Euclidean distance to the geographic centroid (A), linear regression analysis of AFLP expected heterozygosity (HE) and longitude (B), and linear regression analysis of AFLP percent polymorphic loci (%P) and Euclidean distance to the geographic centroid (C). ... 80 Figure 8 Linear regression analysis of allozyme expected heterozygosity (HE) and
xiii
Figure 9 Correlation between AFLP expected heterozygosity (HE) values detected in this study and the allozyme expected heterozygosity (HE) values
reported by Peters (2013) and Skaar (2015). ... 82 Figure 10 Correlation between the number of allozyme MLGs reported per country
by Skaar (2015) and the number of AFLP MLGs discovered using
AFLP data. ... 83 Figure 11 STRUCTURE analysis using AFLP data of the 48 native populations
INTRODUCTION
limits requires, by necessity, both an ecological and a genetic approach (Antonovics 1976 a,b).
The abundance of individuals in a population reflects the degree to which
different localities fulfill a species’ niche requirements (Brown 1984; Brown et al. 1995). Closer to a species’ range limits, the abundance of individuals in its populations will be reduced, compared with populations near the center of the species’ distribution, as
environmental conditions at the range limit deviate from the ‘ideal’ niche requirements of the species (Sagarin and Gaines 2002; Brussard 1984; Lawton 1993; Vucetich and Waite 2003; Hengeveld and Haeck 1982; Brown 1984; Brown et al. 1995). This distribution pattern is referred to as the “Abundant Center” model, and it is one of the prevailing models describing population and ecological dynamics across a species’ range (Sagarin and Gaines 2002; Andrewartha and Birch 1954; Kendeigh 1974; Brown and Gibson 1983; Cox and Moore 1985; Gaston et al. 1997, Hengeveld and Haeck 1982; Cotgreave 1993; Hochberg and Ives 1999). There is however mixed support for this concept in the literature; Sagarin and Gaines (2002) found support for this pattern in only 39% of the studies they reviewed.
The Abundant Center model also holds implications for the level and structure of genetic diversity across a species’ distribution (Duncan et al. 2015), with these
(m) relative to populations located elsewhere in the distribution of a species (Eckert et al. 2008). In addition, density-dependent migration will likely promote an asymmetric pattern of gene flow in which more migrants disperse from central populations to marginal or peripheral populations (Hansson 1991; Hanski et al. 1994; Hartl and Clark 1997; Kubisch et al. 2011; Duncan et al. 2015). This asymmetric pattern of gene flow may have negative consequences for local adaptation to occur within populations that have dispersed to localities at and/or beyond the range boundary of a species (Hoffmann and Blows 1994; Garcia-Ramos and Kirkpatrick 1997; Kirkpatrick and Barton 1997; Kawecki and Holt 2002; Bridle and Vines 2007; Eckert et al. 2008; Munwes et al. 2010; Duncan et al. 2015). Based on these conditions, marginal populations should exhibit lower genetic diversity within populations and higher population genetic structure, compared with central populations (Eckert et al. 2008). Stochastic processes such as genetic drift, founder effects, and population bottlenecks are likely to play a more important role in these relatively smaller, marginal populations (Carson 1959; Mayr 1965; Templeton 1980; Brussard 1984).
Several alternative models have been proposed to describe the pattern of genetic diversity and genetic structure across a species’ geographic distribution. In the first alternative model, genetic diversity may be highest in populations at the range margin because these populations are likely to experience fluctuating selection pressures, compared with populations located at the center of a species distribution (Fisher 1930; Lesica and Allendorf 1995; Volis et al. 1998; Munwes et al. 2010). The second
alternative model proposes no significant differences in genetic diversity between central and marginal populations, and this pattern has been detected in several studies (Mayr 1965; Brussard 1984; Safriel et al. 1994; Kark et al. 2001; Garner et al. 2004; Cahill and Levington 2016). For instance, Garner et al. (2004) found no significant difference in the genetic diversity of central and marginal populations of Rana latastei (the Italian agile frog), which they suggested was the result of asymmetric range expansion and
contraction during periodic, large-scale climate fluctuations. The third alternative model states that populations residing between a species range center and range margins, or at the ‘sub-periphery’ of the range, should exhibit the highest genetic diversity because populations in such locations would be expected to receive gene flow from multiple core populations (Kark et al. 2008; Duncan et al. 2015).
grass is a diploid, winter annual that is primarily self-pollinating (McKell et al. 1962; Frederiksen 1986). Most of the pollen grains this plant produces are dispersed within the floret, with each of the short anthers producing only a moderate number of pollen grains. Cleistagomous flowers, as found in this species, promote self-pollination, but some cross-pollination by wind has been suggested in this species (Frederiksen and Von Bothmer 1986; Brock 1998). In southern France, one portion of the species’ native range,
Taeniatherum caput-medusae is listed as a weed in vineyards, without causing much crop damage (Blank and Sforza 2007). Across the plant’s distribution in the Mediterranean Basin, it is typically found in “garrigue” habitats, which are characterized as low scrublands on limestone soils (Blank and Sforza 2007). Other native plants growing in the garrigues include Thymus vulgaris L. (thyme), Rosmarinus officinalis L. (rosemary), and Ficus carica L. (fig tree) (Blank and Sforza 2007).
fires in western rangelands now occur more frequently and are more severe, compared to range fires prior to European settlement (Whisenant 1990; Novak and Rausch 2009).
Due to the negative ecological consequences associated with the invasion of medusahead across the western US, recent studies have been conducted by Peters (2013) and Skaar (2015) using allozymes to determine the level and structure of genetic diversity within and among native populations, compare the genetic diversity of native populations with that of invasive populations, and identify putative source populations or regions in the native range. Peters (2013) analyzed 34 populations of the grass from across its native range (from Morocco and Spain to Iran), while Skaar (2015) analyzed 48 populations from a smaller geographic area (southeastern Europe and south-central Turkey). Both studies found relatively low levels of within-population genetic diversity, and relatively high levels of genetic structure, compared with other diploid seed plants (Hamrick and Godt 1996). However, each of these studies also reported higher amounts of genetic diversity across native populations (e.g., allelic richness and number of polymorphic loci) and within native populations than in invasive populations, thus providing evidence for founder effects among invasive populations. Finally, results from these two studies suggest that geographic origins for this invasion may have been drawn from across the native range of the grass, with putative source populations occurring in France, Sardinia (Italy), Albania, Macedonia, Greece, Romania, Bulgaria, Turkey, and the Crimean Peninsula of Ukraine.
Despite the analysis of populations from across the Eurasian range of
study was to assess the biogeographic pattern of medusahead in its native range in Eurasia using a molecular approach, amplified fragment length polymorphisms analysis (AFLPs). The specific goals of my research are to: (1) determine the level of genetic diversity across and within native populations of medusahead, (2) determine the genetic and geographic structure of native populations of this grass, (3) evaluate these genetic data in the context of the Central-Marginal hypothesis, and other models used to describe biogeographic patterns, and (4) compare and combine AFLP results with previously reported allozyme data to more fully assess the demographic and evolutionary forces that have shaped the genetic diversity of medusahead in its native range.
METHODS
Plant Collections
In order to assess the biogeographic pattern of medusahead in its native range, my goal was to analyze populations across Eurasia. A total of 70 populations of medusahead from 13 countries were analyzed in this study, with populations ranging from Morocco to Russia (Fig. 2, Table 1). Mature spikes with caryopses (hereafter referred to as seeds) from each of these populations were collected from 2001 to 2013 by Dr. Rene F. H. Sforza and Dr. Stephen J. Novak. Populations in my study ranged from 13 m to 1984 m in elevation, from 29° North to 45° North latitude, and 8° West to 39° East longitude. For the complete population locality information, see Table 1. In order to maximize the total number of populations analyzed in this study, I capped the number of individuals sampled within populations at 10. This sampling strategy is believed to optimize the detection of within- and among-population genetic diversity (Wagner et al. 2011; Prinz et al. 2009). Spikes from 20-30 individuals were collected in each population, and each spike was placed into a separate paper envelopes and stored at room temperature until DNA extraction.
DNA Extraction and AFLP Procedures
Total genomic DNA was extracted from the imbibed seeds using the Qiagen DNeasy Plant Mini prep kits (Valencia, California). The DNA extraction procedures I used generally followed the manufacturer’s recommendations with a slight modification (Qiagen 2015). This modification involved the incubation of samples in a 65° C water bath for 2 h.
The Amplified Fragment Length Polymorphism protocol was conducted on the extracted DNA using the protocol developed by Vos et al. (1995), with slight
modifications described by Lucardi (2012). To ensure the appropriate conditions were maintained, restriction enzyme digests with EcoR1 and Mse1, and the ligation of the corresponding AFLP adaptor pairs were performed in a BioRad PTC-200 Thermocycler (Hercules, California). A pilot study was conducted prior to the start of conducting the AFLP procedure on sampled populations to determine the most polymorphic selective primer pairs. Three primer pairs were tested (see Table 2) with the two most
polymorphic primers used in the AFLP procedure.
The restriction enzyme double digest reactions were set up as follows: 15 µl of extracted DNA were added to 9.58 µl H20, 2.5 µl NEB 4 buffer (New England Biolabs, Ipswich, Massachusetts), 0.25 µl BSA (10 mg/ml) (Promega Corp., Madison,
ligation reaction was incubated for 3 h at 37° C. Pre-selective amplification consisted of the following reaction: 3.0 µl of ligated DNA were added to 7.1 µl water, 4.0 µl 5X GoTaq buffer (Promega Corp.), 2.5 µl dNTPs (0.2 mM) (Promega Corp.), 1.2 µl MgCl2 (25 mM) (Promega Corp.), 1.0 µl Mse1 + C primer (10 µM) (Eurofins Operon,
Huntsville, Alabama), 1.0 µl EcoR1 + A primer (10 µM) (Eurofins Operon), and 0.2 µl GoTaq Flexi DNA Polymerase (5 u/µl) (Promega Corp.). The reaction was heated to 94º C for 1 m, and 30 PCR cycles were conducted as follows: 30 s at 94º C, 1 m at 56º C, and 1 m at 72º C. A final elongation step conducted for 2 m at 72° C. A 1:20 dilution of pre-selective amplification products was conducted. Selective amplification reactions
consisted of the following: 3.0 µl of diluted pre-selective amplification products added to 6.05 µl water, 4.0 µl 5X GoTaq Buffer, 2.5 µl dNTPs (0.2 mM), 3.7 µl MgCl2 (25 mM), 1.0 µl Mse1 + CXX primer (5 µM), 1.0 µl EcoR1 + AXX primer (1 µM), and 0.2 µl GoTaq Flexi DNA Polymerase (5 u/µl). The reaction was conducted for 2 m at 94° C, 10 cycles of (30 s at 94° C, 30 s at 65° C, 1 m at 72° C), 30 cycles of (30 s at 94° C, 30 s at 56° C, 1 m at 72°C), and a final step for 30 s at 72° C.
AFLP Loci Selection and Error Rate Estimation
AFLP bands were visualized, selected, and scored using the default algorithm in the program Peak Scanner 2 (Applied Biosystems Industries, Waltham, Massachusetts) and using a custom panel created in the program GeneMarker (SoftGenetics, State
range were considered present when the eletropherogram showed an intensity value greater than 75 relative fluorescent units (rfu) and displayed a discrete “peak” shape. These loci selection criteria have been employed in other AFLP studies (e.g., Wolf et al. 2004; Trybush et al. 2006; Bjerregaard and Wolf 2008; Zhang and Hare 2012; Voss et al. 2012; Preite et al. 2015). Once 110 AFLP loci were selected from both primer pairs, individual AFLP electropherograms were scored as present or absent (“1” or “0”,
respectively). Restricting the fragment size range from 60 to 400 bp mitigates the effects of AFLP band homoplasy while maximizing the potential of detecting polymorphisms (Vekemans et al. 2002).
In order to calculate an AFLP error rate, samples were chosen for replicate reactions from the entire set of successfully amplified samples in my analysis. Twenty percent (20%) of the individuals originally analyzed were randomly selected (99
individuals) and reanalyzed using the AFLP procedures described above, beginning with the restriction digestion step. The replication error rate was calculated to be 2.009%, which was then used to determine the maximum number of loci by which individuals could differ and still be considered genetically identical (Gaskin et al. 2013; Hufford et al. 2013). With an error rate of 2.009% for 110 scored AFLP loci, individuals differing at 2.2 loci would still be considered genetically identical.
Data Analysis
The program AFLP-SURV (Vekemans 2002) estimates genetic diversity,
system which results in significant deviation from Hardy-Weinberg equilibrium (S.J. Novak, unpublished data), “option 1 – fragment frequencies (homozygous at marker loci)” was chosen to calculate allelic frequencies in AFLP-SURV. AFLP-SURV uses the dominant marker bi-allelic coding system derived in GeneMarker to compute the number of polymorphic loci (P), the percentage of polymorphic loci (%P), and Nei’s (1978) gene diversity (HT) values for each population. Nei’s gene diversity is equivalent to expected heterozygosity (HE) when it is calculated with bi-allelic data, as is the case with AFLPs (Lynch and Milligan 1994; Nybom 2004). AFLP-SURV can also be used to conduct a hierarchical analysis of how the total gene diversity (HT) is partitioned within and among populations. The parameter HS describes the amount of the total gene diversity that is partitioned within populations, while DST describes the amount of the total gene diversity that is portioned among populations. These parameters are related by the equation HT = HS + DST. GST is a parameter that describes the proportion of the total gene diversity that is partitioned among populations, and it is calculated as GST = DST/HT. Pairwise
population FST values and pairwise population genetic distance values were estimated using one thousand permutations with one thousand bootstrap replicates. AFLP-SURV computes pairwise population FST values and genetic distance values that can be inputted into other population genetics programs such as STRUCTURE and PHYLIP.
genetic clusters (Pritchard et al. 2000). Because AFLPs are a dominant molecular marker, which generate a pseudo-haploid data matrix, and STRUCTURE is designed for diploid data, AFLP-SURV produces an input file for STRUCTURE with the second allelic state recorded as missing data (-9). I used the “No Admixture” model in the Ancestry model as input parameters, as recommended by AFLP-SURV. I used a burn-in of 10,000 and 50,000 Monte Carlo Markov Chains (MCMC) iterations to determine the number of genetic clusters in my AFLP data. I calculated delta K using the method of Evanno et al. (2005) using Microsoft Excel where [L”(K)] equals the second order mean logarithmic probability of assignment with the formula ΔK = ([L”(K)]) / (StdDev L(K)). I confirmed this calculation using the applet STUCTURE HARVESTER (Earl and vonHoldt 2012). My first STRUCTURE analysis testing population assignments of K = 1 to K = 20 with 10 replicates per K value, a burn-in of 10,000 iterations, and 50,000 MCMC iterations yielded results that supported a K = 10, but this result was somewhat equivocal. I reran STRUCTURE testing population assignments of K = 6 through K = 14 with the same parameters described above. This analysis found a K = 9 to be the best supported.
determines how many loci an individual can differ at and still be considered genetically identical. Based on my previously calculated AFLP error rate of 2.009%, or a mismatch of 2.2 AFLP loci, I used a threshold of three loci for this analysis. GenoType produces an input file for its complementary program, GenoDive (Meirmans and Van Tienderen 2004). The program GenoDive calculates diversity indices after GenoType assigns individuals to genotypes. Several genetic parameters are computed by GenoDive: s is the number of genotypes, n is the sample size, and pi is the frequency of genotype i in the sample. Indices include Nei’s (1987) genetic diversity corrected for sample size (Simpson’s diversity index) using the formula (n/(n-1))*(1-Σpi2). Simpson’s evenness was calculated using the formula (1/S)*(1/(Σpi2)). The Wiener (or Shannon-Weaver) diversity index was calculated using the formula –Σpi*logpi.
The program PHYLIP 3.695 was used to create unrooted Neighbor-Joining trees based on Nei’s genetic distance (Felsenstein 2004). The program GenAlEx was used to conduct an Analysis of Molecular Variance (AMOVA) to determine how genetic
diversity was partitioned within and among populations and regions (Peakall and Smouse 2006, 2012). Two separate AMOVAs were conducted: the first AMOVA investigated the partitioning of genetic variance among and within populations, and the second AMOVA was based on the hierarchical arrangement of populations into five regions based on their geographical locations and apparent barriers to gene flow (Fig. 2). Region 1 included populations from Spain and Morocco, separated from the remainder of
Sea. Region 3 included populations from Albania, Bulgaria, Greece Macedonia, Romania, western Turkey, and Serbia, separated from other populations by the Adriatic Sea, the Black Sea, and the Carpathian Mountains. Region 4 included populations from the Ukraine and Russia, separated from other populations by the Carpathian Mountains, Caucasus Mountains, and the Black Sea. Region 5 included Anatolian Turkish
populations and is separated from other populations by the Aegean Sea, the Sea of Marmara, the Bosporus and Dardanelles Straits, and the Black Sea. R 3.1.2 (R Core Development Team 2014) was used to generate descriptive statistics, execute correlation tests, test univariate linear regression models, produce genetic diversity indices, and prepare software input files in AFLPdat.
Evaluating the Central-Marginal Hypothesis
Based on the recommendations provided by Eckert et al. (2008), I did not employ qualitative criteria for the categorical assignment of populations to central or marginal groups. Instead, I evaluated the Central-Marginal hypothesis among populations of medusahead across its native range using three quantitative approaches. In the first approach, I identified the geographic centroid of the locality polygon of all 70
= √((q1-p1)2 + (q2-p2)2) where p = latitude and q = longitude. A univariate linear regression model in R was used to assess the relationship between the HE value of a population and its distance to the geographic centroid. The second method employed to evaluate the Central-Marginal hypothesis used the same univariate regression model described above, but analyzed the relationship between the %P value of a population and its distance to the geographic centroid. The third method employed to evaluate the Central-Marginal hypothesis used a univariate linear regression model in R to assess how genetic diversity in medusahead was distributed over a longitudinal gradient. Because the geographic distribution of medusahead in its native range mainly occurs along an east-west axis (see Frederiksen 1986), this test of the Central-Marginal hypothesis is appropriate.
Comparing Molecular Markers: AFLPs and Allozymes
One of the specific goals of this research is to compare the estimates of genetic diversity obtained using AFLPs with the estimates previously reported using allozymes. Allozyme genetic data comes from two recent studies: Peters (2013) analyzed 956
RESULTS
In this study, the level and structure of genetic diversity within and among
populations from across much of the native range of medusahead was estimated based on the analysis of 495 individuals from 70 populations (Fig. 2, Table 1). My goal was to analyze 10 individuals per population, but because DNA could not be successfully extracted from all seeds, the actual sample size was an average of 7.2 individuals per population. The smallest number of individuals sampled in any population (two) occurred for Tizi n’test, Morocco, while 10 individuals were analyzed in several
populations (Table 1). Because I was concerned that estimates of genetic diversity might be positively correlated with population size, I conducted a correlation analysis of the number of AFLP multilocus genotypes (MLGs) detected in each population (without using the AFLP error rate) and the sample size (n) of each population and a correlation analysis of the HE and the sample size of each population. This analysis indicated that there was no significant correlation between the number of AFLP MLGs and population sample size (y = 0.1693x + 1.2787, P > 0.5) (Fig. 3), nor a significant correlation between HE and population sample size (y = 0.0010x + 0.0409, P > 0.5) (data not shown).
Genetic Diversity
Based on the criteria described above, 110 AFLP loci were scored to generate estimates of range-wide and within-population genetic diversity. Of the 110 AFLP loci selected for scoring, 104 loci (94.5%) were polymorphic across all individuals and
populations of medusahead across its native range (Table 3). A moderate level of genetic diversity was discovered across all individuals across the native range of the grass (HE = 0.166). Among the 70 populations of medusahead analyzed in this study, the populations from Bancizaray, Ukraine (38 polymorphic loci, 34.5 %P, and 0.188 HE), Tenevo,
Bulgaria (38 polymorphic loci, 34.5 %P, and 0.135 HE), and Tleta tassrit, Morocco (33 polymorphic loci, 30.0 %P, and 0.158 HE), exhibited the highest level of genetic
diversity; while the population located near Poggiorsini, Italy, had the lowest amount of genetic diversity (1 polymorphic locus, 0.9 %P, and 0.004 HE) (Table 3). The mean value for these three parameters across all 70 populations was 7.82 polymorphic loci, 11.72 %P, and 0.049 HE (Table 3). The mean value for the coefficient of inbreeding (FIS) across all populations was 0.991 (SD = 0.0097).
Populations from Region 1 and Region 3 had the highest genetic diversity, the populations from Regions 4 and 5 had intermediate levels of genetic diversity, and the populations from Region 2 exhibited the lowest amount of genetic diversity (Table 4). Estimates of HE and %P for all 70 populations of medusahead analyzed in this study using AFLPs were significantly and positively correlated (P<0.001, data not shown).
Genetic Structure
of the total gene diversity distributed among populations (GST) was 0.716, indicating that 71.6% of the total gene diversity of these 70 populations of medusahead was distributed among populations. The mean value of Wright’s FST for all populations (0.717) (Table 5) was in close agreement with the GST values reported above. The highest population pairwise FST value was 0.974, and this value occurred for the Tizi n’tishka, Morocco and Poggiorsini, Italy, population pair (Appendix A). The lowest population pairwise FST value (0.012) occurred between Sudak and Trudalyubivka, Ukraine. The mean genetic distance value for all 70 populations of medusahead was 0.145 (Appendix B). The highest population pairwise genetic distance value was 0.643 and occurred for the Kakcaveli, Ukraine and Izvorishte, Bulgaria, population pair. The lowest population pairwise genetic distance value (0.004) occurred for the Sudak and Trudalyubivka, Ukraine populations.
Analysis of molecular variance (AMOVA) was used to partition genetic diversity 1) within and among populations and 2) within and among populations within regions and among regions. In the first AMOVA analysis, genetic diversity was partitioned at two hierarchical levels, and 29.92% of the variation was partitioned within individuals and 70.08% of the variation was partitioned among populations (Table 6A). In the second AMOVA analysis, 32.11% of the genetic diversity was partitioned within populations, 39.41% of the diversity was partitioned among populations within the five regions, and 28.48% of the diversity was partitioned among the five regions (Table 6B).
showed some clustering of populations based on geographical proximity, but the tree revealed that many clusters are composed of populations from the five different
geographical regions. The most genetically distinct populations on the neighbor-joining tree are Lodine, Sardinia, Italy, and three distinct clusters that include populations from Spain, Morocco and two from Ukraine (Bancizaray and Kakcevelli) (Fig. 4). In addition, with the exception of the population from Lodine, the remaining five populations from Italy formed a cluster. For evidence that populations from the different regions are genetically similar, note the distribution of populations from Regions 2 and 4 within multiple clusters throughout the neighbor-joining tree. Genetic clustering in the
neighbor-joining tree presented a similar pattern to that of the pairwise FST and pairwise genetic distance matrices (Appendices A and B, respectively).
Based on the methods of Pritchard et al. (2000) and Evanno et al. (2005), a K = 9 clusters had the strongest support (Fig. 5), and the assignment of the 70 populations of medusahead to these nine clusters are shown in Fig. 6 A & B. The genetic cluster indicated by the blue color had the highest occurrence among the medusahead
different genetic clusters, with five different genetic clusters identified. Ten populations had individuals assigned to four genetic clusters, 17 populations had individuals assigned to three genetic clusters, and 21 populations had individuals assigned to two genetic clusters.
Multilocus Genotypes
Initially, 419 AFLP MLGs were identified across the 495 individuals in the 70 populations analyzed in this study. Employing an AFLP error rate of 2.009%, 132 ALFP MLGs were detected in this analysis. The mean number of MLGs detected per
population was 2.6, and a maximum of 10 genotypes occurred in the Tenevo, Bulgaria population (Tables 7 & 8). Several populations (28) possessed only one MLG. However, there was no significant correlation between the number of MLGs identified in a
population and its sample size (Fig. 3). The most common AFLP MLG across the range of medusahead was MLG #1, found in 275 of 495 (55.6%) of individuals. Henceforth, this genotype is referred to as the Most Common Genotype (MCG). The MCG was detected in 46 of 70 (65.7%) populations surveyed in this study. The only countries in which the MCG was not found were Italy, Morocco, and Spain. The majority of MLGs detected in this study, 110 of 132 (83.3%) genotypes, were singletons (detected in just one individual) (Tables 7 & 8). For MLGs detected in more than one individual, that number ranged from two individuals (nine MLGs) to 13 individuals (MLG #30).
The mean value for Simpson’s evenness across all populations was 0.859. The
populations from Slava Rus, Romania and Izvorishte, Bulgaria had the lowest evenness values (0.48), with several populations having the maximum evenness value of 1.0. The mean value for the Shannon-Wiener diversity index was 0.254, with these values ranging from 0.0 to 1.0 (1.0 for the Tenevo, Bulgaria population).
Biogeographical Patterns
Comparison of Molecular Markers
Based on a comparison of the populations of medusahead previously analyzed using allozymes and this AFLP analysis, a total of 65 populations were analyzed using both molecular markers. A significant, positive correlation was detected between AFLP HE and allozyme HE (y = 0.2373x + 0.0384, P < 0.05) (Fig. 9). The mean value of HE using AFLPs (0.049) was significantly higher than the mean values obtained using allozymes (0.03) (Wilcoxon rank sum test, P<0.001) (Table 9). A total of 66 allozyme MLGs (1.94 MLGs per population) were reported among 34 native populations by Peters (2013), and 35 allozyme MLGs (0.73 MLGs per population) were reported among 48 native populations by Skaar (2015). My analysis with AFLPs, using the error rate calculation, yielded a total of 132 MLG in 70 populations (1.89 MLG per population), and I found a significant positive correlation between the number of MLGs discovered per country between my AFLP data and the previous allozyme data (y = 1.34x + 1.58, P < 0.05) (Fig. 10). Estimates of Nei’s gene diversity statistics calculated in this study with AFLPs show conflicting results when compared to the estimates using allozyme data (Table 9). The value for the total gene diversity (HT) in my study was 0.171, compared with the values of 0.262 and 0.248 previously reported by Peters (2013) and Skaar
(2015), respectively, using allozymes. The value of GST in this AFLP analysis was 0.715, compared with the values of 0.745 and 0.417 previously reported by Peters (2013) and Skaar (2015), respectively (Table 9).
DISCUSSION
The 70 populations of medusahead analyzed using 110 AFLP loci allow me to make broad inferences across much of this species’ Eurasian range, using a highly polymorphic molecular marker. The populations of medusahead analyzed in this study show low to moderate levels of range-wide genetic diversity that is largely partitioned among populations (i.e., high levels of genetic structure) (Nybom 2004). In addition, my results indicated that genetic diversity is distributed randomly across the species’ native range thus providing no support for the Central-Marginal hypothesis. These AFLP results are generally consistent with a previous study that analyzed the same populations of medusahead using allozymes. Finally, these results for medusahead are similar to the results reported for Lolium rigidum, another self-pollinating, annual grass species that is broadly distributed across much of Eurasia.
Genetic Diversity
A critical goal of this research was to determine the level and structure of genetic diversity of medusahead across its range in Eurasia. To accomplish this goal, my
individuals sampled per population increases the statistical reliability of within-population estimates of genetic diversity (e.g., expected heterozygosity). A similar sampling strategy has been employed in other studies assessing genetic diversity and genetic differentiation of broadly distributed species (e.g., Wagner et al. 2011; Prinz et al. 2009; Gaskin et al. 2013). Moreover, the non-significant relationship between population sample size and the number of MLGs (Fig. 3) and sample size and values of HE (data not shown) indicated that sample sizes did not limit the estimates of genetic diversity
reported here.
A previous study estimated that the mean value for the inbreeding coefficient (F) for native populations of medusahead using allozymes was 0.997 (S.J. Novak,
mating system, gravity seed dispersal, and an early successional status had a mean expected heterozygosity of 0.166, which is higher than the value I obtained in this study (HE = 0.049). Using AFLPs, Voss et al. (2012) reported a mean HE value of 0.005 (Standard Error = 0.0012) in native populations of Ceratocapnos claviculata, a primarily selfing plant species. The value of HE reported here for medusahead is approximately 10-fold greater than the value reported by Voss et al. (2012). Additionally, the values of Simpson’s genotypic diversity index and Simpson’s evenness for medusahead (0.36 and 0.859, respectively) (Table 8) were considerably lower than the values reported for Chondrilla juncea (0.99 and 0.96, respectively) by Gaskin et al. (2013), indicating that these populations of medusahead demonstrate relatively low levels of multilocus genotype diversity (Tables 8).
The number and distribution of AFLP Multilocus Genotypes (MLG) is a measure of the level and distribution of genetic diversity among native populations of
medusahead. My analysis of 495 individuals detected 132 MLGs (utilizing the error rate) (Tables 7 & 8), which resulted in a G/N value (G/N is the proportion of distinct
number of MLGs discovered for medusahead, compared with that reported for Chondrilla juncea (Gaskin et al. 2013). Chondrilla juncea is a perennial herbaceous plant that is believed to reproduce both sexually and asexually in its native range in Eurasia, but which appears to reproduce asexually through gametophytic apomixis throughout its invasive range in North America, Australia, and Argentina (Panetta and Dodd 1987; Chaboudez 1994; McVean 1996; Gaskin et al. 2013). Thus, even infrequent bouts of sexual reproduction and genetic recombination in Chondrilla juncea would lead to a higher level of genetic variation within and among native populations, compared with native populations of medusahead. In addition, the study conducted by Gaskin et al. (2013) analyzed populations of the entire species of Chondrilla juncea, whereas my study analyzed populations from a single subspecies of medusahead (T. caput-medusae
subspecies asperum). Genetic analyses that include taxa from different taxonomic levels might lead to the detection of higher amounts of genetic diversity in Chondrilla juncea. While the native ranges of medusahead and Chondrilla juncea overlap longitudinally, Chondrilla juncea occurs across a greater latitudinal range throughout much of Eurasia. This larger geographical distribution of Chondrilla juncea compared to medusahead, and its resulting occupancy of a variety of habitats and potentially more diverse ecological niches, may be associated with the overall higher levels of genetic diversity detected for Chondrilla juncea compared with medusahead.
Genetic Structure
genetic diversity for populations of medusahead is partitioned among populations: a pattern of partitioning genetic diversity that is often associated with plants that have a primarily self-pollinating mating system (Barrett and Husband 1990; Novak and Mack 1993; Nybom 2004, Voss et al. 2012; Pajkovic et al. 2014). Results from both AMOVA runs provided results similar to the GST and FST values mentioned above, and indicated that the majority of the genetic diversity is partitioned among population (70.1%, Table 6A), or partitioned among populations within regions (39.4%) or among regions (28.5%) (Table 6B). These data indicate 28.5% of the total genetic variance of medusahead is partitioned among the five geographic regions described in Fig. 2. This result probably stems from the primarily self-pollinating mating system of medusahead and from barriers to gene flow such as mountain ranges and bodies of water that are present across the Eurasian range of medusahead.
The Neighbor-Joining tree (Fig. 4), which is based on Nei’s genetic distance values, reveals most clusters consist of populations from different geographic regions. For instance, populations from Region 1 occur in one cluster, although this cluster also included two populations from Region 4. As a further way of visualizing this pattern, note the distribution of populations from Bulgaria and Turkey in various clusters throughout the neighbor-joining tree. The occurrence of populations from different countries in the same cluster indicates that there is little relationship between geographic distance and genetic distance.
(2005) both identified the same number of genetic clusters (K = 9) (Fig. 5). Second, several genetic clusters exhibited a restricted geographical distribution and were only present in some populations from Morocco, Italy and Bulgaria (Fig. 6). Third, populations assigned to the genetic cluster indicated by the yellow color exhibited a disjunct distribution, occurring in Region 1 (Spain and Morocco) and Region 4 (Ukraine). Finally, populations in the central and eastern portions of the native range of medusahead included individuals possessing various frequencies of four different genetic clusters (blue, teal, purple, and orange) (Fig. 6). Populations in these regions exhibited a high degree of genetic admixture that likely resulted from gene flow between these
populations, most probably due to seed dispersal leading to the establishment of populations following disturbance events.
Biogeographical Pattern
Range-wide tests of the Central-Marginal hypothesis are rare. The meta-analysis of Eckert et al. (2008) revealed the existence of only 28 such studies; with most studies examining only one region of a species’ distribution, or analyzing populations located only at the center of a species’ distribution, only at the species’ range boundary, or only disjunct populations. In order to maximize the possibility of detecting genetic patterns at geographically meaningful scales, I attempted to maximize the number of populations analyzed across the entire Eurasian range of medusahead. The most common genetic diversity parameters used to test the Central-Marginal hypothesis are expected
was not a uniform outcome (Eckert et al. 2008). Therefore, my study was designed to evaluate the tenets of the Central-Marginal hypothesis using two parameters, HE and %P, in order to independently investigate the species’ distribution using a genetic approach. Eckert et al. (2008) found that 60.5% of the studies that used some statistical analysis found support for either 1) a decline in genetic diversity or 2) an increase in genetic differentiation in marginal versus central populations. These results included studies that categorically assigned populations to “central” or “marginal” groups. Conversely, studies that used a quantitative measure of centrality such as distance to centroid and statistical analysis found that only 47% of studies yielded evidence in support of the two tenants of the Central-Marginal hypothesis described above (Eckert et al. 2008). Despite the lower support for the Central-Marginal hypothesis using a quantitative measure of centrality, Eckert et al. (2008) recommended the use of this approach when testing this hypothesis. Therefore, my evaluation of the Central-Marginal hypothesis was conducted on
medusahead populations using a quantitative approach in which populations were
analyzed as being continuously distributed across the species’ range. The results reported here provide support for a random distribution pattern of genetic diversity, and this result is in agreement with 53% of studies reviewed in Eckert et al. (2008).
Results of my evaluation of the distribution of genetic diversity across
portion of its distribution. My results may provide partial support for the Fisher hypothesis because the genetic diversity of populations from Region 1, which included Spanish and Moroccan populations at the species’ westernmost range boundary, exhibited on average the highest levels of genetic diversity (Table 4). In addition to testing the Central-Marginal hypothesis using AFLP data, I wanted to test this hypothesis using previously reported (Peters 2013; Skaar 2015) allozyme data. Results using AFLP data (Fig. 7) and allozyme data (Fig. 8) were in agreement, and indicate that genetic diversity is randomly distributed across the native range of medusahead. These results for medusahead using both allozymes and AFLPs are one of only two studies I am aware of that have tested the Central-Marginal hypothesis in the same species (same
Comparison with Other Studies Assessing Biogeographic Pattern
The Central-Marginal hypothesis has been used as a framework to test the biogeographical pattern of many taxa (see Eckert et al. 2008). The pattern of genetic variation among 55 European populations of Ceratocapnos claviculata reported by Voss et al. (2012) was not consistent with the Central-Marginal hypothesis. Garner et al. (2004) found that the centrality of the population failed to explain significant differences in the level of genetic diversity observed among 19 populations of Rana latastei, the Italian agile frog. Munwes et al. (2010) reported an increase in the genetic diversity of populations of the eastern spadefoot toad (Pelobates syriacus) at the species’ range boundary, results consistent with the hypothesis of Fisher (1930) described above.
While the studies cited above provide tests of the Central-Margin hypothesis that can be compared to my results, it would probably be more appropriate to compare my results to those of a species with similar life-history traits as medusahead. In a range-wide assessment of genetic diversity within and among native populations of Lolium rigidum, a self-pollinating, annual grass that is broadly distributed across Eurasia, Balfourier et al. (1998) found a non-significant statistical relationship between both HE and allelic richness and longitude. These results indicate a random distribution of genetic diversity across the native range of L. rigidum, similar to that reported here for
medusahead. The near continuous sampling of populations across the Eurasian range of both medusahead and L. rigidum greatly assisted in uncovering range-wide
biogeographical patterns.
associated with the geographical distribution of the grass: 1) the expansion of primitive agriculture from the Middle East across Europe in the last 10,000 years, or 2)
colonization of European populations from glacial refugia which were established just prior to the last glacial episode (Balfourier et al. 1998; Balfourier et al. 2000; Salamini et al.2002; Fuller et al. 2011). The expansion of primitive agriculture following the
domestication of cereal crops from the Middle East is generally believed to have occurred along two routes; a southwestern expansion towards Mediterranean countries, and a northwestern expansion towards northern Poland, Germany, France, and ultimately the United Kingdom and Scandinavia (Balfourier et al. 1998; Balfourier et al. 2000; Fuller et al. 2011). Using cpDNA sequence data, Balfourier et al. (2000) concluded that the random distribution of genetic diversity within Eurasian populations of L. rigidum is based on human-mediated dispersal following the spread of primitive agriculture along the southwestern expansion route described previously. The second scenario of
recolonization from glacial refugia has been documented in many plant and animal species distributed across Europe (Balfourier et al. 1998; Sharbel et al. 2000). My AFLP data does not allow me to differentiate between the two alternate scenarios described above. The fact that medusahead is a ruderal species and is an agricultural weed
(Frederiksen 1986; Blank and Sforza 2007; Fuller et al. 2011) suggests that seeds of the plant could have inadvertently been transported by humans during the spread of
Comparison of AFLP and Allozyme Results
My research analyzed many of the same populations of medusahead analyzed by Peters (2013) and Skaar (2015) using allozymes, and therefore provides an opportunity to compare estimates of genetic diversity obtained using two molecular marker systems. In my study, I assessed genetic diversity in native populations of medusahead using 110 AFLP loci, whereas 23 loci were used in the two allozyme studies (Peters 2013; Skaar 2015). One hundred and four of 110 AFLP loci (94.5%) were polymorphic, compared to 15 and seven (65.2% and 30.4%, respectively) polymorphic allozyme loci. Even with the higher number of polymorphic AFLP loci, the AFLP and allozyme data shared some similarities. The significant correlation between AFLP and allozyme HE values detected among the 65 populations analyzed using both markers similar estimates for the pattern of genetic diversity in these populations of medusahead (Fig. 9). In addition, the two populations with the highest value of HE (Sozopol, Bulgaria and Tleta tassrit, Morocco) and the population displaying the lowest value of HE (Monesterio, Spain) (Table 3 of the current study and Peters 2013 and Skaar 2015) were the same using each of these
level of genetic diversity associated with AFLP data compared to the genetic diversity contained in the allozyme data. The differences in genetic diversity estimated described here through the comparison of AFLP and allozyme data (higher HE, greater number of MLGs, and finer-scale genetic structure associated with AFLPs) is consistent with other studies that have used both marker systems (see Wolf and Sinclair 1997; Bjerregaard and Wolf 2008; Johnson 2009; Gaskin et al. 2013; Hufford et al. 2013). At least two reasons have been presented to explain this pattern: 1) a larger number of loci are assayed in the majority of AFLP studies compared with allozyme analyses, and 2) AFLP loci are assumed to be distributed across the entire genome of an organism rather than just a few specific locations as occurs for allozyme loci (Vos et al. 1995; Vekemans et al. 2002; Bjerrergaard and Wolf 2008).
Conclusions
LITERATURE CITED
Allendorf FW, Luikart G (2007) Units of conservation. Conservation and the genetics of populations, 380-420.
Andrewartha HG, Birch LC (1954) The distribution and abundance of animals. University of Chicago press, Chicago, IL.
Antonovics J (1976a) The nature of the limits to natural selection. Annals of the Missouri Botanical Garden, 63, 224-247.
Antonovics J (1976b) The input from population genetics: ‘the new ecological genetics.’ Systematic Botany, 1, 233-245.
Balfourier F, Charmet G, Ravel C (1998) Genetic differentiation within and between natural population of perennial and annual ryegrass (Lolium perenne and L. rigidum). Heredity, 81, 100-110.
Balfourier F, Imbert C, Charmet G (2000) Evidence for phylogeographic structure in Lolium species related to the spread of agriculture in Europe. A cpDNA study. Theoretical Applied Genetics, 101, 131-138.
Barrett SCH, Husband BC (1990) Variation in outcrossing rates in Eichhornia paniculata: the role of demographic and reproductive factors. Plant Species Biology, 5, 41-55.
Betancourt JL, Schuster WS, Mitton JB, Anderson RS (1991) Fossil and genetic history of a Pinyon Pine (Pinus edulis) isolate. Ecological Society of Amerca, 72(5), 1685-1697.
Blank RF, Sforza R (2007) Plant-soil relationships of the invasive annual grass
Taeniatherum caput-medusae: a reciprocal transplant experiment. Plant Soil, 298, 7-19.
Bridle JR, Vines TH (2007) Limits to evolution at range margins: when and why does adaptation fail? Trends in Ecology and Evolution, 22, 140-147.
Brock JH (1998) Ecological characteristics of invasive alien plants. In: The future of arid grasslands: identifying issues, seeking solutions: Proceedings; 1996 October 9-13; Tuscon, AZ. Eds Tellman B, Finch D, Edminster C, Hamre R. Proceedings RMRS-P-3. Fort Collins, CO: US Department of Agriculture, Forest Service, Rocky Mountain Research Station: 137-143.
Brown JH (1984) On the relationship between abundance and distribution of species. American Naturalist, 124, 255-279.
Brown JH, Gibson AH (1983) Biogeography. St. Louis, MO: C. V. Mosby.
Brown JH, Mehlman DW, Stevens GC (1995) Spatial variation in abundance. Ecology, 76, 2028-2043.
Brown JH, Lomolino MV (1998) Biogeography. Sinaur associates. Sunderland, Massachusetts.
Brussard PF (1984) Geographical patterns and environmental gradients: the central-marginal model in Drosophila revisited. Annual Review of Ecology and Systematics, 15, 25-64.
Cahill AE, Levinton JS (2016) Genetic differentiation and reduced genetic diversity at the northern range edge of two species with different dispersal modes. Molecular Ecology, 25, 515-526.
Carson HL (1959) Genetic conditions which promote or retard the formation of species. Cold Spring Harbor Symposia on Quantitative Biology, 24, 87-105.
Cotgreave P (1993) The relationship between body size and population abundance in animals. Trends in Ecology and Evolution, 8, 7, 244-248.
Cox CB, Moore PD (1985) Biogeography: an ecological and evolutionary approach, 4th edn. Blackwell Scientific Publications, Oxford.
Duncan SI, Crespi EJ, Mattheus NM, Rissler LJ (2015) History matters more when explaining genetic diversity within the context of the core-periphery hypothesis. Molecular Ecology, 24, 4323-4336.
Earl DA, vonHoldt BM (2012) STRUCTURE HARVESTER: a website and program for visualizing STRUCTURE output and implementing the Evanno method.
Conservation Genetics Resources, 4, 359-361.
Eckert CG, Samis KE, Lougheed SC (2008) Genetic variation across species’ geographical ranges: the central-margin hypothesis and beyond. Molecular Ecology, 17, 1170-1188.
Ehrich D (2006) AFLPdat: a collection of R functions for convenient handling of AFLP data. Molecular Ecology Notes, 6, 603-604.
Evanno G, Regnaut S, Goudet J (2005) Detecting the number of clusters of individuals using the software STRUCTURE: a simulation study. Molecular Ecology, 14, 2611-2620.
Fazekas AJ, Yeh FC (2001) Random amplified polymorphic DNA diversity of marginal and central populations in Pinus contorta subsp. Latifolia. Genome, 44, 13-22. Fisher RA (1930) The Genetical Theory of Natural Selection. Clarendon Press, Oxford. Felsenstein J (2004) PHYLIP (Phylogeny Inference Package) version 3.6. Distributed by
the author. Department of Genome Sciences, University of Washington, Seattle. Frederiksen S (1986) Revision of Taeniatherum (Poaceae). Nordic Journal of Botany, 6,
389-397.
Fuller DQ, Wollcox G, Allaby RG (2011) Early agricultural pathways: moving outside the ‘core area’ hypothesis in Southwest Asia. Journal of Experimental Botany, 63(2), 617-633.
Garcia-Ramos G, Kirkpatrick M (1997) Genetic models of adaptation and gene flow in peripheral populations. Evolution, 51, 21-28.
Garner TWJ, Pearman PB, Angelone S (2004) Genetic diversity across a vertebrate species’ range: a test of the central-peripheral hypothesis. Molecular Ecology, 13, 1047-1053.
Gaskin JF, Schwarzlander M, Kinter CL, Smith JF, Novak SJ (2013) Propagule pressure, genetic structure, and geographic origins of Chondrilla Juncea (Asteraceae): an apomictic invader on three continents. American Journal of Botany, 100(9), 1871-1882.
Gaston KJ, Blackburn TM, Lawton JH (1997) Interspecific abundance-range size relationships: an appraisal of mechanisms. Journal of Animal Ecology, 66, 579-601.
Hamrick JL, Godt MJW (1996) Effects of life history traits on genetic diversity in plant species. Philosophical Transactions: Biological Sciences, 351(1345), 1291-1298. Hanski I, Kuussaari M, Nieminen M (1994) Metapopulation structure and migration in
the butterfly Melitaea cinxia. Ecology, 75, 747-762.
Hansson L (1991) Dispersal and connectivity in metapopulations. Biological Journal of the Linnean Society, 42, 89-103.
Hartl DL, Clark AG (1997) Principles of Population Genetics, Vol 116. Sinauer Associates, Sunderland, Massachusetts.
Hengeveld R (1988) Mechanisms of biological invasions. Journal of Biogeography, 819-828.
Hochberg ME, Ives AR (1999) Can natural enemies enforce geographical range limits? Ecography, 22(3), 268-276.
Hoffman AA, Blows MW (1994) Species borders: ecological and evolutionary perspectives. Trends in Ecology and Evolution, 9, 223-227.
Holsinger KE, Lewis PO (2003) HICKORY: A package for analysis of population genetic data. Distributed by the authors. Department of Ecology and Evolutionary Biology, University of Connecticut.
Holt RD, Keitt TH, Lewis MA, Maurer BA, Taper ML (2005) Theoretical models of species’ borders: single species approaches. Oikos, 108, 18-27.
Hufford KM, Mazer SJ, Hodges SA (2013) Genetic variation among mainland and island populations of a native perennial grass used in restoration. Annals of Botany Plants, 6, plt055.
Invaders Database System (1997-2014). http://invader.dbs.umt.edu, Division of Biological Sciences, University of Montana – Missoula.
Johnson RL (2009) A comparison of genetic structuring of Yellowcheek Darters
(Etheostoma moorei) using AFLPs and allozymes. Biochemical Systematics and Ecology, 37, 298-303.
Kark S, Hadeny L, Safriel WK (2008) How does genetic diversity change towards the range periphery? An empirical and theoretical test. Evolutionary Ecology Research, 10, 391-414.
Kark S, Safriel UN, Tabarroni C, Randi E (2001) Relationship between heterozygosity and asymmetry: a test across the distribution range. Heredity, 86, 119-127.
Kawecki TJ (2008) Adaptation to marginal habitats. Annual Review of Ecology Evolution Systematics, 39, 321-342.
Keller S, Taylor D (2008) History, chance, and adaptation during biological invasion: separating stochastic phenotypic evolution from response to selection. Ecology Letters, 11, 852-866.
Kendeigh SC (1974) Ecology with special reference to animals and man. Prentice-Hall, New Jersey.
Kirkpatrick M, Barton NH (1997) Evolution of a species’ range. American Naturalist, 150, 1-23.
Kubisch A, Poethke HJ, Hovestadt T (2011) Density-dependent dispersal and the formation of range borders. Ecology, 34, 1002-1008.
Lawton JH (1993) Range, population abundance and conservation. Trends in Ecology and Evolution, 8, 409-413.
Lesica P, Allendorf FW (1995) When are peripheral populations valuable for conservation? Conservation Biology, 9, 753-760.
Linde-Laursen IB, Frederiksen S (1989) Giemsa C-banded karyotypes of three subspecies of Taeniatherum caput-medusae and two intergeneric hybrids with Psathyrostachys spp. (Poaceae). Hereditas, 110(3), 283-288.
Lucardi RD (2012) Multi-scale population genetic analysis of Cogongrass (Imperata cylindrica) in the southeastern United States: introduction history, range expansion, and hybridization. PhD dissertation, Mississippi State, MS. Mississippi State University.
Lynch M, Milligan BG (1994) Analysis of population genetic structure with RAPD markers. Molecular Ecology, 3, 91-99.
Mayr E (1965) Populations Species and Evolution. An Abridgement of Animal Species and Evolution. Belknap Press, Cambridge, MA.
McKell CM, Robinson JP, Major J (1962) Ecotypic variation in medusahead, an introduced annual grass. Ecology, 43, 686-698.
Meirmans PG, Van Tienderen PH (2004) GENOTYPE and GENODIVE: two programs for the analysis of genetic diversity of asexual organisms. Molecular Ecology Notes, 4, 792-794.
Micheletti SJ, Storfer A (2015) A test of the central-marginal hypothesis using population genetics and ecological niche modelling in an endemic salamander (Ambystoma barbouri). Molecular Ecology, 24, 967-979.
Millar CI, Libby WJ (1991) Strategies for conserving clinal, ecotypic, and disjunct
population diversity in widespread species. In: Genetics and Conservation of Rare Plants (eds Falk DA, Holsinger KE), pp 149-170. Oxford University Press, New York.
Miller HC, Clausnitzer D, Borman MM (1999) Medusahead. Pages 271-281 in RL Sheley and JK Petroff, eds. Biology and Management of Noxious Rangeland Weeds. Corvalis, OR: Oregon State University Press.
Munwes I, Geffen E, Roll U, Friedmann A, Daya A, Tikochinski Y, Gafny S (2010) The change in genetic diversity down the core-edge gradient in the eastern spadefoot toad (Pelobates syriacus). Molecular Ecology, 19, 2675-2689.
Nei M (1978) Estimation of average heterozygosity and genetic distance from a small number of individuals. Genetics, 89, 583-590.
Nei M (1987) Molecular evolutionary genetics. Columbia University Press, New York. Novak SJ, Mack RN (1993) Genetic variation in Bromus tectorum (Poaceae): comparison
between native and introduced populations. Heredity, 71, 167-176.
Novak SJ, Rausch JH (2009) Use of field surveys, distributed data and genetic analyses to monitor alien species: Taeniatherum caput-medusae as an example of the approach. Biological Invasions: Towards a Synthesis. Neobiota, 8, 169-182. Nybom, H (2004) Comparison of different nuclear DNA markers for estimating
intraspecific genetic diversity in plants. Molecular Ecology, 13, 1143-1155. Pajkovic M, Lappe S, Barman R, Parisod C, Neuenschwander S, Goudet J, Alvarez N,
wild relatives: empirical estimates from approximate Bayesian computation in Aegilops triuncialis. Molecular Ecology, 23, 5089-5101.
Panetta FD, Dodd J (1987) The biology of Australian weeds 16. Chondrilla juncea L. Journal of the Australian Institute of Agricultural Science, 53, 83-95.
Peakall R, Smouse PE (2006) GenAlEx 6: genetic analysis in Excel. Population genetic software for teaching and research. Molecular Ecology Notes, 6, 288-295.
Peakall R, Smouse PE (2012) GenAlEx 6.5: genetic analysis in Excel. Population genetic software for teaching and research – an update. Bioinformatics, 28, 2537-2539. Peters ML (2013) Genetic and morphological variation in Taeniatherum caput-medusae
(Medusahead): Taxonomic diversity, geographic origins, multiple introductions, and founder effects. M.S. Thesis, Boise State University, Boise, ID.
Pouget M, Youssef S, Migliore J, Juin M, Medail F, Baumel A (2013) Phylogeography sheds light on the central-marginal hypothesis in a Mediterranean narrow endemic plant. Annals of Botany, 112, 1409-1420.
Preite V, Snoek LB, Oplaat C, Bierre A, Van Der Putten WH, Verhoeven KJF (2015) The epigenetic footprint of poleward range-expanding plants in apomictic dandelions. Molecular Ecology, 24, 4406-4418.
Pritchard JK, Stephens M, Donnelly P (2000) Inference of population structure using multilocus genotype data. Genetics, 155, 945-959.
Prinz K, Weising K, Hensen I (2009) Genetic structure of coastal and inland populations of the annual halophyte Suaeda maritima (L.) Dumort. in Central Europe, inferred from amplified fragment length polymorphism (AFLP) markers. Plant Biology, 11, 812-820.
Qiagen (2015) DNeasy Plant Handbook and Technical Manual.
R Core Development Team, R Foundation of Statistical Computing (2014) R version 3.1.2 “Pumpkin Helmet.”
Sagarin RD, Gaines SD (2002) The ‘abundant centre’ distribution: to what extent is it a biogeographic rule? Ecology letters, 5, 137-147.
Salamini F, Ozkan H, Brandolini A, Schafer-Pregl R, Martin W (2002) Genetics and geography of wild cereal domestication in the Near East. Nature Reviews, 3, 429-441.
Sharbel TF, Haubold B, Mitchell-Olds T (2000) Genetic isolation by distance in Arabidopsis thaliana: biogeography and postglacial colonization of Europe. Molecular Ecology, 9, 2109-2118.
Sexton JP, McIntyre PJ, Angert AL, Rice KJ (2009) Evolution and ecology of species range limits. Annual Review of Ecology Evolutionary Systematics, 40, 415-436. Skaar SK (2015) Identifying the geographic origins for the introduction of Taeniatherum
caput-medusae subspecies asperum (Medusahead) in the western United States. M.S. Thesis, Boise State University, Boise, ID.
Templeton AR (1980) The theory of speciation via the founder principle. Genetics, 94, 1011-1038.
Trybush S, Hanley S, Cho KH, Jahodova S, Grimmer M, Emelianov I, Bayon C, Karp A (2006) Getting the most out of fluorescent amplified fragment length
polymorphism. Canadian Journal of Botany, 84, 1347-1354.
Vekemans X (2002) AFLP-SURV version 1.0. Distributed by the author, Universite Libre de Bruxelles, Belgium. Laboratoire de Genetique et Ecologie Vegetale.
Vekemans X, Beauwens T, Lemaire M, Roldan-Ruiz I (2002) Data from amplified fragment length polymorphisms (AFLPs) markers show indication of size
homoplasy and of a relationship between degree of homoplasy and fragment size. Molecular Ecology, 11, 139-151.
Vos P, Hogers R, Bleeker M, Reijans M, Lee T, Hornes M, Frijters A, Pot J, Peleman J, Kuiper M, Zabeau M (1995) AFLP: a new technique for DNA fingerprinting. Nucleic Acid Research, 23, 4407-4414.
Voss N, Eckstein RL, Durka W (2012) Range expansion of a selfing polyploid plant despite widespread genetic uniformity. Annals of Botany, 110, 585-593. Vucetich JA, Waite TA (2003) Spatial patters of demography and genetic processes
across the species’ range: null hypotheses for landscape conservation genetics. Conservation Genetics, 4, 639-645.
Wagner V, Durka W, Hensen I (2011) Increased genetic differentiation but no reduced genetic diversity in peripheral vs. central populations of a steppe grass. American Journal of Botany, 98(7), 1173-1179.
Whisenant SG (1990) Postfire population dynamics of Bromus japonicus. The American Midland Naturalist, 123(2), 301-308.
Wolf PG, Doche B, Gielly L, Taberlet P (2004) Genetic structure of Rhododendron ferrugineum at a wide range of spatial scales. Journal of Heredity, 95(4), 301-308. Wolf PG, Sinclair RB (1997) Highly differentiated populations of the narrow endemic
plant Maguire primrose (Primula maguirei). Conservation Biology, 11, 375-381. Yeh FC, Layton C (1979) The organization of genetic variability in central and marginal populations of lodgepole pine (Pinus contorta ssp. latifolia). Canadian Journal of Genetics and Cytology, 21, 487-503.
Yeh FC, Cheliak WM, Dancik BP, Illingworth K, Trust DC, Pryhitka BA (1985) Populations differentiation in lodgepole pine, Pinus contorta spp. Latifolia – a discriminant analysis of allozyme variation. Canadian Journal of Genetics and Cytology, 27, 210-218.
TABLES AND FIGURES
Table 1 Locality Data for 70 native populations of Taeniatherum
caput-medusae subspecies asperum analyzed in this study. Also included is each
population’s Euclidian distance from the calculated geographic centroid.
Population
Number Country Locality Code
Number of Individuals
(n) Latitude Longitude
Elevation (m) Collection Date Distance to Geographic Centroid (km) 1 Albania Bilisti BAL 9 40.6680 20.8222 878 7/14/2011 277.45 2 Struga SAL 9 41.0777 20.6069 1016 6/26/2011 295.78 3 Bulgaria Beronovo BBG 8 42.8275 26.7094 358 10/4/2010 312.06 4 Devnja DEBG 6 43.2322 27.5425 128 10/4/2010 390.96 5 Dripclevo DBG 4 41.9947 26.1958 461 7/3/2011 218.19 6 Galabets GBG 10 41.8275 25.4508 322 7/4/2011 159.34 7 Harmanli HBG 7 41.9675 25.9950 241 10/3/2010 203.28 8 Izgrev IGBG 5 42.1447 27.8105 137 10/5/2010 343.64 9 Izvorishte IBG 10 42.6586 27.4352 278 7/3/2011 344.62 10 Izvorsko IZBG 5 43.2797 27.7825 323 7/2/2011 408.99 11 Orizare OBG 5 42.7119 27.6177 77 10/4/2010 359.69 12 Razlog RBG 9 41.9030 23.5013 834 10/2/2010 129.33 13 Rudnik RUBG 4 42.9861 27.7883 75 7/12/2003 389.29 14 Sozopol SBG 10 42.3686 27.6852 50 10/5/2010 345.01 15 Sredec SRBG 7 42.2136 27.0363 332 10/5/2010 289.71 16 Staro Orjahovo SOBG 7 42.9863 27.7880 65 10/4/2010 289.42 17 Tenevo TBG 10 42.3605 26.5719 145 7/3/2011 268.26 18 Zvezdel ZBG 10 41.4711 25.5400 572 7/4/2011 142.09
19 France
Pezenes Les