DEMOGRAPHIC RESEARCH
VOLUME 35, ARTICLE 33, PAGES 991
−
1010
PUBLISHED 5 OCTOBER 2016
http://www.demographic-research.org/Volumes/Vol35/33/ DOI: 10.4054/DemRes.2016.35.33
Research Article
On the association between weather variability
and total and cause-specific mortality before and
during industrialization in Sweden
Daniel Oudin Åström
Sören Edvinsson
David Hondula
Joacim Rocklöv
Barbara Schumann
©2016 Daniel Oudin Åström et al.
This open-access work is published under the terms of the Creative Commons Attribution NonCommercial License 2.0 Germany, which permits use, reproduction & distribution in any medium for non-commercial purposes, provided the original author(s) and source are given credit.
1 Background 992
2 Material and methods 993
2.1 Population data 993
2.2 Climate data 994
2.3 Statistical methods 995
3 Results 996
4 Discussion 1000
5 Strengths and limitations 1003
6 Conclusions 1004
7 Acknowledgements 1004
On the association between weather variability and
total and cause-specific mortality before and during industrialization
in Sweden
Daniel Oudin Åström1, 2 Sören Edvinsson3
Daniel Hondula4 Joacim Rocklöv5 Barbara Schumann3, 5
Abstract
BACKGROUNDWhile there is ample evidence for health risks associated with heat and other extreme weather events today, little is known about the impact of weather patterns on population health in preindustrial societies.
OBJECTIVE
To investigate the impact of weather patterns on population health in Sweden before and during industrialization.
METHODS
We obtained records of monthly mortality and of monthly mean temperatures and precipitation for Skellefteå parish, northern Sweden, for the period 1800–1950. The associations between monthly total mortality, as well as monthly mortality due to infectious and cardiovascular diseases, and monthly mean temperature and cumulative precipitation were modelled using a time series approach for three separate periods, 1800−1859, 1860–1909, and 1910–1950.
1 Centre for Primary Health Care Research, Department of Clinical Science, Malmö, Lund University, Lund, Sweden. E-Mail: [email protected].
2 Occupational and Environmental Medicine, Department for Public Health and Clinical Medicine, Umeå University, Umeå, Sweden.
3 Centre for Demographic and Ageing Research, Umeå University, Umeå, Sweden.
RESULTS
We found higher temperatures and higher amounts of precipitation to be associated with lower mortality both in the medium term (same month and two-months lag) and in the long run (lag of six months up to a year). Similar patterns were found for mortality due to infectious and cardiovascular diseases. Furthermore, the effect of temperature and precipitation decreased over time.
CONCLUSIONS
Higher temperature and precipitation amounts were associated with reduced death counts with a lag of up to 12 months. The decreased effect over time may be due to improvements in nutritional status, decreased infant deaths, and other changes in society that occurred in the course of the demographic and epidemiological transition. CONTRIBUTION
The study contributes to a better understanding of the complex relationship between weather and mortality and, in particular, historical weather-related mortality.
1. Background
Following the Little Ice Age between the 14th and 19th centuries (Ljungkvist 2009), an
increase in global average temperatures has been observed (IPCC 2013). Since the end of the 20th century, more frequent heat waves have been reported and these put stress on the elderly and sick especially, as they suffer most from heat-sensitive health concerns, including cardiovascular and respiratory diseases (Smith et al. 2013). Apart from the impact of high temperature on morbidity and mortality, the effects of cold have also been shown (Mäkinen et al. 2009; Oudin Åström et al. 2013; Näyhä et al. 2011).
Human well-being depends to a large degree on the availability of basic environmental resources, such as agricultural yields and clean water, which are influenced by climate (McMichael 2012). Most existing studies on the impact of preindustrial climate on human health focus on the role of harvest outcomes. For example, in the 17th century, at the height of the Little Ice Age, considerably lower annual temperatures led to harvest failures and food shortages. These in turn caused famines and epidemics, as well as armed conflicts, throughout Europe (Ljungkvist 2009; McMichael 2012; Parker 2013; Zhang et al. 2011).
However, there is less evidence about the role of weather patterns or weather extremes on infectious disease outbreaks beyond the pathway of harvest and food supply. Catalano, Bruckner, and Smith (2008) showed that around 1900 in Scandinavia the gestational survival of male foetuses increased when the annual temperature was higher, while longevity of males decreased (due to natural selection of less fit male babies). According to our earlier research, in Sweden between 1749 and 1859 annual average temperature and precipitation had little impact on annual death counts. But while higher springtime temperatures and precipitation decreased annual mortality, high levels of rain in autumn led to higher annual mortality (Rocklöv et al. 2014; Schumann et al. 2013). There was also evidence that older children were most vulnerable to an unfavourable climate, while there was a less pronounced impact on infants (Rocklöv et al. 2014). These findings applied to a period of slowly decreasing mortality trends before the onset of industrialization in Sweden. Much insight is to be gained from studying changes in climate impact during the economic and sociodemographic transition after 1860. Additionally, we need to know more about the sensitivity to weather conditions of different diseases. Although little reliable information on specific causes of death is available for previous centuries, analyses of disease groups − infectious and cardiovascular diseases – are likely to be more valid. These should increase our knowledge about the vulnerability of preindustrial populations to extreme weather.
2. Material and methods
2.1 Population dataThe population data for the Skellefteå region, located on the Gulf of Bothnia coast in the north of Sweden, comes from the POPLINK dataset at the Demographic Database (DDB), Umeå University. The POPLINK dataset is based on long-term parish records (registers of births, deaths, and migration, and population registers – i.e., clerical surveys (husförhörslängder) until the 1890s and parish registers thereafter). In this study, we used data for the period 1800–1950. The population was continuously recorded in the clerical surveys and parish registers, and the individual records have been linked, allowing us to reconstruct the biographies of people from a demographic and social perspective as long as they remained in the region (Edvinsson 2000; Wisselgren et al. 2014).
The main variables considered in this study were date and cause of death. Individual deaths were included in the analyses if the person had died within the study region and if information on month and year of death was available.
Cause of death was determined and recorded by the parish ministers from the mid-18th century in Sweden. For the first decades of the 19th century a large proportion of records have missing data on cause of death, and infant deaths were under-reported. There is probably also some under-reporting of deaths of young children, but not for other age groups. From 1911 it became mandatory to report the cause of death for all deceased persons. The validity of the given causes was then controlled by doctors. Thus the most reliable data on cause of death related to the last period in our study. Reported causes of death were assigned an ICD code at the DDB. We grouped diseases into two main categories: a) infectious (including respiratory) diseases and b) cardiovascular diseases. Specific analyses were conducted for total mortality, infectious disease mortality, and cardiovascular disease mortality respectively.
2.2 Climate data
exception of Tornedalen data, which was taken from Klingbjer and Moberg (2003). Uppsala temperature measurements have been homogenized and validated by Moberg and Bergström (Moberg and Bergström 1997; Bergström and Moberg 2002).
The precipitation record for Umeå for the period 1748–1859 was reconstructed using bootstrapped linear regression modelling with precipitation observations from Uppsala. Cross-validation was applied to test the predictive capacity of this approach for 1860–1950, when observations were available from both locations. Modelled precipitation totals for Umeå for 1860–1950 were all within 5% of actual observations across the ensemble of regression models, with the median model differing from observations by less than 4 centimetres over the entire record. The average correlation coefficient between modelled and observed monthly precipitation time series ranged from 0.59 to 0.62, with a median of 0.61 (see Supplementary Figure 1). More details on the precipitation reconstruction method are available in the supplementary material.
Temperature values are indicated in degrees Celsius (°C) and precipitation in centimetres (cm).
Exact and reliable estimates of local harvest results are not available throughout our study period. In our analysis, we have chosen to identify years characterized by harvest failures. Harvest estimates and general descriptions of harvests were reported from the 18th century by parish ministers and later by county governors based on local reports (Hellstenius 1871). They can be used only as crude measures of yearly harvest results, but they clearly indicate years with severe crop failure. This information has been evaluated and validated by other sources, such as minutes from local parish board meetings and data on relief consignments from the government. For the period 1870 onwards, we have used data on harvests at local level from hushållningssällskapet, local organizations for the promotion of agriculture (Statistics Sweden 1926).
2.3 Statistical methods
function of time trend, which was allowed 1 degree of freedom (DF) per year to control for unmeasured confounding from variability in mortality due to seasonality and longer time trends. Furthermore, we adjusted for known periods with mortality extremes that were not caused by climate, namely the war between Sweden and Russia (high mortality in September 1809) and the Spanish flu (high mortality due to infectious disease from October 1918 to January 1919).
We investigated total mortality as well as cause-specific mortality due to infectious and cardiovascular diseases for three separate periods, 1800–1859, 1860–1909, and 1910–1950. The periodic stratification of analyses was done in order to make possible assessment of changes in the exposure response relationships over time in the context of socioeconomic development and epidemiological transitions. We stratified analyses in groups of cause of death and time period. Moreover, we stratified the analyses on sex and age for the different time periods. In additional analyses we adjusted for harvest failure the previous year. Relative risks (RR) were presented with 95% confidence intervals (CI).
We assumed the relationship between monthly mortality and temperature and precipitation to be approximately linear. To further investigate if this assumption was valid we performed sensitivity analyses where the different lags were modelled as smooth functions (with 5 DF each).
To investigate if temperature and precipitation distributions, as well as mean temperatures and mean precipitation levels, changed between the three periods, which would affect our assessment of temporal variation in weather-related mortality impacts, we performed two-sample Kolmogorov–Smirnov tests and one-way analyses of variance and considered a p-value < 0.05 to be statistically significant.
SAS version 9.2 was used to create datasets. R version 3.1.2 and the MGCV add-on package was used for statistical modelling (R Core Team 2015, Wood 2006). The code used is available in the supplementary material (Supplementary Material 2 R-code).
3. Results
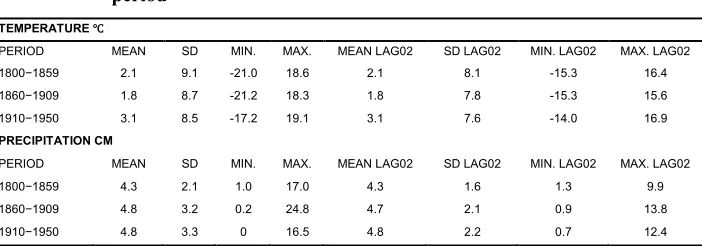
ones. Precipitation distribution and mean values were similar across the observed values in the last two periods (1860–1909 and 1910–1950), while the distribution and reconstructed values for the first period were significantly lower than the two later ones (Table 1).
Table 1: Descriptive statistics of temperature and precipitation presented by period
TEMPERATURE ℃
PERIOD MEAN SD MIN. MAX. MEAN LAG02 SD LAG02 MIN. LAG02 MAX. LAG02
1800−1859 2.1 9.1 -21.0 18.6 2.1 8.1 -15.3 16.4
1860−1909 1.8 8.7 -21.2 18.3 1.8 7.8 -15.3 15.6
1910−1950 3.1 8.5 -17.2 19.1 3.1 7.6 -14.0 16.9
PRECIPITATION CM
PERIOD MEAN SD MIN. MAX. MEAN LAG02 SD LAG02 MIN. LAG02 MAX. LAG02
1800−1859 4.3 2.1 1.0 17.0 4.3 1.6 1.3 9.9
1860−1909 4.8 3.2 0.2 24.8 4.7 2.1 0.9 13.8
1910−1950 4.8 3.3 0 16.5 4.8 2.2 0.7 12.4
Notes: Lag02 is the three-month moving average of monthly mean temperatures and cumulative precipitation for lags 0‒2. SD is the standard deviation, min. is minimum, max. is maximum.
In total, 58,947 deaths with valid information on month and year of death were recorded in the region over the entire study period. Population size grew considerably between 1800 and 1950, as did the monthly death counts. Reported infectious disease deaths remained higher than cardiovascular deaths (Table 2).
We found that higher monthly temperatures were associated with lower total mortality for the shorter lags during all our investigated periods. This pattern was not as strong for the longer lags. The association between higher temperatures and total and cause-specific mortality at different lags was largest in the first period and less pronounced from 1860 onwards.
Table 2: Descriptive statistics of cause-specific mortality
POPULATION SIZE MORTALITY (TOTAL) MONTHLY NUMBER OF DEATHS
PERIOD MEAN MIN. MAX. N MEAN SD MEDIAN MIN. MAX.
1800−1859 10,446 5,658 17,200 Total 10,744 14.9 10.8 13 0 198ᴬ
Infectious 446 0.6 2.02 0 0 25
Cardiovascular 236 0.3 1.0 0 0 19
1860−1909 24,396 17,246 33,678 Total 23,193 38.7 13.8 37 7 93
Infectious 5,572 9.3 7.9 8 0 64
Cardiovascular 669 1.1 1.2 1 0 6
1910−1950 45,883 33,714 62,041 Total 25,010 50.8 13.6 49 27 179
Infectious 7,663 15.6 10.5 14 0 140ᴮ
Cardiovascular 577 1.2 1.3 1 0 7
Notes: ᴬThe 198 deaths in September 1809 were related to the war between Sweden and Russia, otherwise the maximum number of total deaths was 60 (October 1809) and 48 (August 1857).
ᴮ140 infectious disease deaths due to Spanish flu in November 1918 (September 43, October 84, December 58 and January
1919 55). Otherwise the largest amount of infectious disease deaths was 50 (January 1931).
N is the total number of deaths in each period, SD is the standard deviation, min. is minimum, max. is maximum.
In general, patterns for infectious and cardiovascular disease mortality related to temperature and precipitation were similar to those of total mortality. However, the estimates were less precise, particularly before 1860. Age and sex did not modify the association between temperature or precipitation and total mortality during any of the investigated time periods (Table 3).
Adjustment for harvest failure the previous year for the first two periods (1800−1859 and 1860−1909) slightly modified the effect estimates for temperature and total mortality; estimates for precipitation were unchanged. The association of harvest failure the previous year and total mortality was not statistically significant at the 5% level (Supplementary Table 1).
Table 3: Relative risks and 95% confidence intervals of mortality associated with a unit increase in monthly temperature and precipitation Temperature (change in mortality per ℃ increase in monthly mean temperatures)
Lag 02
Period Total Infectious CVD Males Females
1800−1859 0.983 (0.976–0.990) 0.964 (0.928–1.001) 0.951 (0.919–0.985) 0.996 (0.986–1.007) 0.978 (0.964–0.993)
1860−1909 0.989 (0.984–0.994) 0.990 (0.977–1.003) 1.017 (1.001–1.033) 0.988 (0.979–0.997) 0.991 (0.982–1.000)
1910−1950 0.989 (0.986–0.993) 0.978 (0.971–0.985) 0.985 (0.969–1.002) 0.990 (0.986–0995) 0.989 (0.985–0.994)
Lag 36
Period Total Infectious CVD Males Females
1800−1859 0.970 (0.957–0.984) 0.895 (0.834–0.960) 0.882 (0.826–0.941) 0.993 (0.972–1.015) 0.964 (0.936–0.993)
1860−1909 0.997 (0.988–1.006) 1.010 (0.986–1.034) 1.009 (0.981–1.038) 0.998 (0.977–1.015) 1.003 (0.984–1.022)
1910−1950 1.000 (0.994–1.007) 0.991 (0.978–1.004) 0.973 (0.943–1.003) 1.004 (0.997–1.012) 1.000 (0.990–1.009)
Lag 712
Period Total Infectious CVD Males Females
1800−1859 0.972 (0.954–0.989) 0.852 (0.778–0.933) 0.851 (0.782–0.926) 1.002 (0.974–1.030) 0.963 (0.926–1.002)
1860−1909 0.995 (0.983–1.006) 1.016 (0.986–1.047) 1.034 (0.996–1.072) 0.998 (0.974–1.022) 0.999 (0.975–1.024)
1910−1950 1.003 (0.995–1.011) 1.000 (0.983–1.018) 0.980 (0.942–1.020) 1.008 (0.998–1.019) 1.002 (0.990–1.014)
Precipitation (change in mortality per 1 cm increase in monthly precipitation) Lag 02
Period Total Infectious CVD Males Females
1800−1859 0.961 (0.932–0.992) 1.005 (0.873–1.156) 0.848 (0.714–1.007) 0.972 (0.941–1.004) 0.960 (0.923–1.000)
1860−1909 0.984 (0.971–0.996) 0.974 (0.948–1.001) 0.967 (0.930–1.006) 0.974 (0.960– 0.989) 0.991 (0.976–1.007)
1910−1950 0.990 (0.982–0.999) 0.971 (0.955–0.987) 0.977 (0.938–1.018) 0.987 (0.977–0.997) 0.993 (0.982–1.004)
Lag 36
Period Total Infectious CVD Males Females
1800−1859 0.976 (0.923–1.031) 0.701 (0.531–0.924) 0.683 (0.495–0.942) 0.990 (0.939–1.044) 0.988 (0.920–1.062)
1860−1909 1.018 (0.998–1.039) 1.003 (0.988–1.081) 0.971 (0.926–1.018) 1.012 (0.989–1.035) 1.021 (0.997–1.046)
1910−1950 1.025 (1.014–1.035) 1.031 (1.011–1.052) 1.009 (0.962–1.058) 1.022 (1.010–1.034) 1.027 (1.014–1.040)
Lag 712
Period Total Infectious CVD Males Females
1800−1859 0.969 (0.902–1.042) 0.642 (0.452–0.912) 0.648 (0.428–0.982) 1.004 (0.937–1.076) 0.973 (0.886–1.069)
1860−1909 0.992 (0.967–1.018) 1.003 (0.947–1.063) 1.091 (1.032–1.153) 0.990 (0.961–1.019) 0.992 (0.962–1.023)
1910−1950 0.991 (0.978–1.004) 0.977 (0.951–1.003) 0.997 (0.939–1.060) 0.991 (0.975–1.006) 0.990 (0.974–1.007)
Period Total Age 0−4 Age 5−19 Age 20−59 Age 60+
1800−1859 0.983 (0.976–0.990) 0.998 (0.981–1.015) 0.998 (0.973–1.023) 0.992 (0.978–1.005) 0.981 (0.967–0.993)
1860−1909 0.989 (0.984–0.994) 0.994 (0.980–1.008) 0.994 (0.978–1.010) 0.997 (0.988–1.006) 0.982 (0.974–0.990)
1910−1950 0.989 (0.986–0.993) 0.982 (0.974–0.989) 0.993 (0.982–1.004) 0.997 (0.992–1.002) 0.988 (0.983–0.992)
Lag 36
Period Total Age 0−4 Age 5−19 Age 20−59 Age 60+
1800−1859 0.970 (0.957–0.984) 0.982 (0.949–1.016) 0.956 (0.910–1.005) 0.991 (0.966–1.018) 1.000 (0.976–1.025)
1860−1909 0.997 (0.988–1.006) 1.015 (0.985–1.045) 0.981 (0.950–1.013) 1.001 (0.983–1.019) 1.002 (0.986–1.018)
1910−1950 1.000 (0.994–1.007) 1.000 (0.986–1.014) 0.982 (0.963–1.003) 1.001 (0.991–1.011) 1.008 (1.000–1.016)
Lag 712
Period Total Age 0−4 Age 5−19 Age 20−59 Age 60+
1800−1859 0.972 (0.954–0.989) 1.001 (0.957–1.046) 0.945 (0.890–1.011) 0.991 (0.957–1.026) 1.000 (0.968–1.032)
1860−1909 0.995 (0.983–1.006) 1.016 (0.978–1.056) 0.980 (0.940–1.021) 1.013 (0.990–1.037) 0.991 (0.970–1.012)
1910−1950 1.003 (0.995–1.011) 1.005 (0.987–1.024) 0.986 (0.960–1.012) 1.007 (0.995–1.020) 1.007 (0.997–1.018)
Precipitation (change in mortality per 1 cm increase in monthly precipitation) Lag 02
Period Total Age 0−4 Age 5−19 Age 20−59 Age 60+
1800−1859 0.961 (0.932–0.992) 0.959 (0.912–1.009) 0.957 (0.886–1.035) 0.970 (0.930–1.010) 0.975 (0.939–1.012)
1860−1909 0.984 (0.971–0.996) 0.986 (0.965–1.008) 0.998 (0.973–1.024) 0.968 (0.952–0.984) 0.978 (0.961–0.995)
Table 3: (Continued)
Temperature (change in mortality per ℃ increase in monthly mean temperatures)
Lag 36
Period Total Age 0−4 Age 5−19 Age 20−59 Age 60+
1800−1859 0.976 (0.923–1.031) 0.975 (0.891–1.066) 0.812 (0.709–0.929) 0.954 (0.891–1.020) 1.096 (1.032–1.165)
1860−1909 1.018 (0.998–1.039) 1.032 (0.997–1.067) 0.989 (0.951–1.028) 0.993 (0.970–1.017) 1.018 (0.994–1.043)
1910−1950 1.025 (1.014–1.035) 1.042 (1.020–1.064) 1.014 (0.983–1.046) 1.007 (0.993–1.022) 1.035 (1.022–1.049)
Lag 712
Period Total Age 0−4 Age 5−19 Age 20−59 Age 60+
1800−1859 0.969 (0.902–1.042) 1.039 (0.925–1.166) 0.857 (0.721–1.018) 0.936 (0.858–1.022) 1.002 (0.925–1.085)
1860−1909 0.992 (0.967–1.018) 0.992 (0.950–1.036) 1.025 (0.975–1.076) 1.001 (0.970–1.032) 0.944 (0.914–0.975)
1910−1950 0.991 (0.978–1.004) 0.978 (0.952–1.006) 1.027 (0.988–1.068) 1.008 (0.989–1.026) 0.981 (0.965–0.997)
Notes: Lag02 is the three-month moving average of monthly mean temperatures and monthly cumulative precipitation for lags 0‒2. Lag36 is the four-month moving average of monthly mean temperatures and monthly cumulative precipitation for lags 3‒6. Lag 712 is the six-month moving average of monthly mean temperatures and monthly cumulative precipitation for lags 7‒12. CVD represents cardiovascular mortality.
During 1800−1860 the total number of deaths of males and females in the different age groups does not add up to the total number of deaths due to information missing in the registers.
4. Discussion
Our study investigated the association of temperature and precipitation with total infectious disease and cardiovascular disease mortality in Skellefteå, northern Sweden, between 1800 and 1950. This period was characterized by profound societal, demographical, and epidemiological transitions in Sweden (Sundin and Willner 2007), so our intention was also to identify potential temporal changes in weather vulnerability.
Results indicated on the whole that both higher temperature and higher precipitation were associated with lower mortality – warmer weather and more rain or snow decreased monthly death counts in most periods and in most lags up to 12 months after exposure.
Vulnerability to adverse weather conditions was more pronounced in the first periods (1800s) than in the last (1900s). Weather impacts were thus largest before the onset of industrialization, when the region of Skellefteå was still a predominantly agricultural society and when average temperatures were lower. This was the case for both temperature and precipitation, and for mortality by infectious and cardiovascular diseases.
prices and other covariables, which might hide some of the temperature effects that we observed.
During the 19th century, the local economy in the Skellefteå region was dominated
by agriculture, primarily animal husbandry, on land owned by freeholders. New settlements were established in the previously sparsely populated interior of Skellefteå (Fahlgren 1953). Mortality was high overall, although lower than in most other parts of Sweden (Edvinsson 2004), and fertility was high as well (Coale and Watkins 1986). People in the region experienced several crises during the century: for example, in connection with the Finnish War of 1808–1809, when Russian troops occupied large parts of Västerbotten County. The remote nature of this region and its harsh climate made the population vulnerable to harvest failures, such as during consecutive years of bad harvests in the 1830s and in 1867.
For this preindustrial period between 1800 and 1859, we found quite large impacts of temperature and precipitation on monthly mortality at both shorter and longer lags up to one year. Lower temperatures increased infectious disease and cardiovascular disease mortality mostly after a lag of three to 12 months. This delayed effect may be explained by two causal pathways. First, low summer temperatures can result in poorer harvest outcomes, which would lead to a decreased nutritional status the next spring when people ran out of resources. Appleby (1980), Ljungkvist (2009), Zhang et al. (2011), and McMichael (2012), among others, provided evidence that in preindustrial societies during the Little Ice Age epidemics were related to harvest failures, which in turn are linked to environmental and climatic conditions. This assessment is supported by our analyses on the relationship of harvest outcomes with climate and mortality in the Skellefteå region. Here we found that the largest risk for harvest failure was a cold summer, and harvest failure significantly increased annual death counts in the following year (Schumann, Edvinsson, and Rocklöv 2014). In our present study, harvest failure the previous year slightly changed the association between temperature and mortality towards 1, but not between precipitation and mortality. Thus agricultural production might have functioned as a mediating factor between climate and mortality, explaining the observed long-term effects up to one year.
other associations, the short-term effect of temperature on infectious disease mortality was greatest during the first period (1800–1859), but persisted even after that.
We have also shown earlier that in preindustrial Sweden high levels of precipitation during springtime decreased annual mortality, while precipitation during autumn increased mortality (Rocklöv et al. 2014; Schumann et al. 2013). Our present analyses do not consider seasonal differences in weather−mortality impacts, so these opposing effects might be disguised. However, in the first period, 1800–1859, the impact of precipitation on infectious diseases occurred mainly with a lag of three to 12 months. This gives support to the hypothesis that food yields following heavy rains in spring contribute to improved nutritional status, leading to lower mortality the next year. Rain in autumn, on the other hand, can cause more short-term increases in mortality due to contamination of food and water with pathogens or due to crowding and the spread of airborne diseases.
At the end of the 19th century mortality decreased and infectious disease epidemics
became less frequent in Sweden, although they were still the dominant cause of death (Hofsten 1986; Sundin and Willner 2007). The period 1860–1910 was the coldest in our study region and it was also wetter than the decades before. Despite this, impacts of temperature and precipitation on total and cause-specific mortality were lower than in the first period. At the same time, socioeconomic development, including improved living standards, better sanitary conditions, less overcrowding, and improved child care, led to increased life expectancy and declining infant and child mortality (mainly caused by infectious diseases) (Brändström, Edvinsson, and Rogers 2002; Sundin and Willner 2007). Better social organization and improved communications also mitigated the effects of harvest failures towards the end of the century. Higher living standards may have contributed to reduced climate vulnerability.
In a previous study, we found that in preindustrial Skellefteå it was children aged three to nine years who were most affected by unfavourable weather conditions (Rocklöv et al. 2014). This age-specific vulnerability and decreasing child mortality trends may partly explain declining health impacts of weather in our present study.
The population of Skellefteå increased rapidly during the first part of the 20th
In this period, the first half of the 20th century, total mortality in Skellefteå was hardly affected by temperature. For infectious disease mortality, we found only short-term impacts, while cardiovascular mortality was affected to some degree also at longer lags. Contemporary studies have shown that cardiovascular mortality is related to low temperature (Hajat, Kovats, and Lachowycz 2007; Huynen et al. 2001), which was also the case for our preindustrial and industrializing setting in northern Sweden. Thus the decline in weather vulnerability in cardiovascular diseases from the first to the second period (which may be attributed to improved living standards) was less pronounced in the last period. One reason might be that the emergence of lifestyle-related cardiovascular risk factors (sedentary occupation, smoking) produced a more susceptible population which counterbalanced benefits in living standards. The changing age distribution in the population, caused by longer live expectancy and decline in fertility, is likely to explain, too, weather impacts on cardiovascular mortality.
5. Strengths and limitations
This study has relied on unique digitized parish records on individual vital data, including the dates and causes of death of almost 60,000 individuals between 1800 and 1950. Most studies on historical populations have so far focused on long-term fluctuations in climate and mortality (years, decades, or centuries) (Galloway 1986; McMichael 2012; Zhang et al. 2011), while our analyses relied on the use of monthly data for temperature, precipitation, and death counts. This data gave us the possibility of also investigating short-term impacts, which might provide insights into causal pathways. Furthermore, the time range from the early 1800s to the mid-20th century allowed for the observation of temporal changes in weather vulnerability during the epidemiological transition.
A limitation of this study was the low number of total and cause-specific monthly death counts occurring during the first period, resulting in our risk estimates being less precise and requiring cautious interpretation.
the absence of any other available information, we surmised that the reconstruction method was adequate to inform subsequent mortality modelling; supporting indicators include correlation coefficients strongly suggestive of a linear relationship between Umeå and Uppsala precipitation totals, as well as close agreement between observed and modelled precipitation totals. The modelled precipitation totals had less variance than observations and thus the reconstructed data for the historical period are biased towards the mean.
Although the statistical models controlled for trend, it is possible that not all the seasonal effects were captured.
6. Conclusions
In this study of a community in northern Sweden before and during industrialization, we were able to show short- and medium-term impacts of monthly weather on total and cause-specific mortality. We found that both higher temperature and precipitation were associated with lower mortality: that is, monthly death counts with a lag of up to one year were negatively correlated with warmer weather and more precipitation. The decreasing risk of mortality related to adverse weather conditions from the early 1800s to the middle of the 20th century demonstrates that contextual factors such as
dependence on agricultural production, living standards, and lifestyle, as well as demographic factors, can contribute substantially to the climate and weather vulnerability of a population.
Future studies should look into seasonal variations in weather impacts to provide more detailed insights into potential causal pathways for communicable and cardiovascular diseases.
7. Acknowledgements
References
Appleby, A.B. (1980). Epidemics and famine in the little ice age. The Journal of Interdisciplinary History 10(4): 643−663. doi:10.2307/203063.
Bengtsson, M. (2002). The interpretation of cause of death among infants. Hygiea Internationalis 3(1): 53−74. doi:10.3384/hygiea.1403-8668.023153.
Bengtsson, T. and Lindström, M. (2000). Childhood misery and disease in later life: The effects on mortality in old age of hazards experienced in early life, southern Sweden, 1760−1894. Population Studies 54(3): 263−277. doi:10.1080/ 713779096.
Bengtsson, T. and Dribe, M.( 2002). New evidence on the standard of living in Sweden during the 18th and 19th centuries: Long-term development of the demographic response to short-term economic stress among landless in western Scania. Lund Papers in Economic History 82: 1−44.
Bengtsson, T. and Broström, G. (2010). Mortality crises in rural southern Sweden 1766−1860. In: Kurosu, S., Bengtsson, T., and Campbell, C. (eds.).
Demographic responses to economic and environmental crises. Kashiwa: Reitaku University: 1−16.
Bergström, H. and Moberg, A. (2002). Daily air temperature and pressure series for Uppsala (1722–1998). In Camuffo, D. and Jones, P.D. (eds.). Improved understanding of past climatic variability from early daily European instrumental sources. Dordrecht: Springer: 213‒252.
Brändström, A., Edvinsson, S., and Rogers, J. (2002). Illegitimacy, infant feeding practices and infant survival in Sweden 1750−1950. A Regional Analysis Hygiea Internationalis 3: 13−52.
Catalano, R., Bruckner, T., and Smith, K.R. (2008). Ambient temperature predicts sex ratios and male longevity. Proceedings of the National Academy of Sciences of the United States of America 105(6): 2244−2247. doi:10.1073/pnas.0710711104. Coale, A.J. and Watkins, S.C. (1986). The decline of fertility in Europe. Princeton:
Princeton University Press.
Edvinsson, S. (2000). The demographic data base at Umeå University – a resource for historical studies. In: Hall, P.H., McCaa, R., and Thorvaldsen, G. (eds.).
Edvinsson, S. (2004). Social differences in infant and child mortality in 19th century
Sweden. In: Breschi, M. and Pozzi, L. (eds.). The determinants of infant and child mortality in past European populations. Udine: Forum: 67−88.
Fahlgren, K. (1953). Skellefte sockens historia. Del 1 [Skellefteå parish history, Part 1]. Uppsala: Almqvist & Wiksell.
Galloway, P. (1986). Long-term fluctuations in climate and population in the preindustrial era. Population and Development Review 12(1): 1−24. doi:10.2307/ 1973349.
Hellstenius, J. (1871). Skördarna i Sverige och deras verkningar (Harvests in Sweden and their repercussions). Statistisk tidskrift 29: 77−119.
Hajat, S., Kovats, R.S., and Lachowycz, K. (2007). Heat-related and cold-related deaths in England and Wales:Who is at risk? Occupational and environmental medicine
64(2): 93−100. doi:10.1136/oem.2006.029017.
Hofsten, E. (1986). Svensk befolkningshistoria: några grunddrag i utvecklingen från 1750 [Swedish population history: General features of development since 1750]. Stockholm: Rabén and Sjögren.
Huynen, M.M., Martens, P., Schram, D., Weijenberg, M.P., and Kunst, A.E. (2001). The impact of heat waves and cold spells on mortality rates in the Dutch population. Environmental health perspectives 109(5): 463−470. doi:10.1289/ ehp.01109463.
Intergovernmental Panel on Climate Change (IPCC) (2013). Summary for policymakers. In: Stocker, T.F., Qin, D., Plattner, G.-K., Tignor, M.M.B., Allen, S.K., Boschung, J., Nauels, A., Xia, Y., Bex, V., and Midgley, P.M. (eds.).
Climate Change 2013: The Physical Science Basis Contribution of Working Group I to the Fifth Assessment Report of the Intergovernmental Panel on Climate Change. Cambridge and New York: Cambridge University Press. Klingbjer, P. and Moberg, A. (2003). A composite monthly temperature record from
Tornedalen in northern Sweden, 1802−2002. International Journal of Climatology 23(12): 1465−1494. doi:10.1002/joc.946.
Ljungkvist, F.C. (2009). Global nedkylning ‒ Klimatet och människan under 10000 år [Global cooling ‒ climate and humans during 10000 years]. Stockholm: Norstedts.
and low humidity are associated with increased occurrence of respiratory tract infections. Respiratory medicine 103(3): 456−462. doi:10.1016/j.rmed.2008. 09.011.
McMichael, A.J. (2012). Insights from past millennia into climatic impacts on human health and survival. Proceedings of the National Academy of Sciences of the United States of America 109(13): 4730−4737. doi:10.1073/pnas.1120177109. Moberg, A. and Bergström, H. (1997). Homogenization of Swedish temperature data 3.
The long temperature records from Uppsala and Stockholm. International Journal of Climatology 17(7): 667−699. doi:10.1002/(SICI)1097-0088 (19970615)17:7<667::AID-JOC115>3.0.CO;2-J.
Näyhä, S., Hassi, J., Jousilahti, P., Laatikainen, T., and Ikaheimo, T.M. (2011). Cold-related symptoms among the healthy and sick of the general population: National FINRISK Study data, 2002. Public health 125(6): 380−388.
doi:10.1016/j.puhe.2011.02.014.
Oudin Åström, D., Forsberg, B., Edvinsson, S., and Rocklov, J. (2013). Acute fatal effects of short-lasting extreme temperatures in Stockholm, Sweden: Evidence across a century of change. Epidemiology 24(6): 820−829. doi:10.1097/01. ede.0000434530.62353.0b.
Parker, G. (2013). Global crisis-war, climate change and catastrophe in the seventeenth century. New Haven: Yale University Press.
Portier, C.J., Thigpen Tart, K., Carter, S.R., Dilworth, C.H., Grambsch, A.E., Gohlke, J., Hess, J., Howard, S.N., Luber, G., Lutz, J.T., Maslak, T., Prudent, N., Radtke, M., Rosenthal, J.P., Rowles, T., Sandifer, P.A., Scheraga, J., Schramm, P.J., Strickman, D., Trtanj, J.M., and Whung, P.-Y. (2010). A human health perspective on climate change: A report outlining the research needs on the human health effects of climate change. Research Triangle Park: Environmental Health Perspectives/National Institute of Environmental Health Sciences.
doi:10.1289/ehp.100227.
Puranen, B.I. (1984). Tuberkulos. En sjukdoms förekomst och dess orsaker: Sverige 1750−1980 [Tuberculosis. Occurrence of a diseases and its causes: Sweden 1750−1980]. Umeå: Umeå Studies in Economic History.
Rocklöv, J., Ebi, K., and Forsberg, B. (2011). Mortality related to temperature and persistent extreme temperatures: A study of cause-specific and age-stratified mortality. Occupational and environmental medicine 68(7): 531−536.
doi:10.1136/oem.2010.058818.
Rocklöv, J., Edvinsson, S., Arnkvist, P., Sjöstedt de Luna, S., and Schumann, B. (2014). Association of seasonal climate variability and age-specific mortality in northern Sweden before the onset of industrialization. International Journal of Environmental Research and Public Health 11(7): 6940−6954.
doi:10.3390/ijerph110706940.
Schumann, B., Edvinsson, S., and Rocklöv, J. (2014). Is harvest failure the link between climate variability and mortality in a pre-industrial society? Results from northern Sweden. In: Abstracts of the 2014 Conference of the International Society of Environmental Epidemiology (ISEE). Research Triangle Park: Environmental Health Perspectives.
Schumann, B., Edvinsson, S., Evengård, B., and Rocklöv, J. (2013). The influence of seasonal climate variability on mortality in pre-industrial Sweden. Global Health Action 6: 20153. doi:10.3402/gha.v6i0.20153.
Semenza, J.C. and Menne, B. (2009). Climate change and infectious diseases in Europe.
The Lancet Infectious Diseases 9(6): 365‒375. doi:10.1016/S1473-3099(09) 70104-5.
Smith, K.R., Woodward, A., Campbell-Lendrum, D., Chadee, D.D., Honda, Y., Liu, Q., Olwoch, J.M., Revich, B., and Sauerborn, R. (2013). Human health: impacts, adaptation, and co-benefits. In: Field, C.B., Barros, V.R., Dokken, D.J., Mach, K.J., Mastrandrea, M.D., Bilir, T.E., Chatterjee, M., Ebi, K.L., Estrada, Y.O., Genova, R.C., Girma, B., Kissel, E.S., Levy, A.N., MacCracken, S., Mastrandrea, P.R., and White, L.L. (eds.). Climate change 2014: Impacts, adaptation, and vulnerability Part A: Global and sectoral aspects contribution of working group II to the fifth assessment report of the intergovernmental panel on climate change. Cambridge and New York: Cambridge University Press: 709−754.
Statistics Sweden (1926). Hushållningssällskapens berättelser. Jordbruk och boskapsskötsel (Yearly reports on agricultural statistics). Stockholm 1865−1925. Sundin, J. and Willner, S. (2007). Social change and health in Sweden: 250 Years of
politics and practice. The European Journal of Public Health 18(4): 430−431.
Wisselgren, M.J., Berggren, M., Edvinsson, S., and Larsson, M. (2014). Testing methods of record linkage on Swedish censuses. Historical Methods: A Journal of Quantitative and Interdisciplinary History 47: 138−151.
Wood, S.N. (2006). Generalized additive models: An introduction with R. Chapman and Hall.
Zacharias, S., Koppe, C., and Mucke, H.G. (2015). Climate change effects on heat waves and future heat wave-associated IHD mortality in Germany. Climate 3(1): 100−117. doi:10.3390/cli3010100.