Aldona Kasprzak
1, Agnieszka Adamek
2, Wiesława Przybyszewska
1, Witold
Szaflarski
1, Karolina Sterzyńska
1, Agnieszka Seraszek
3, Iwona Mozer-Lisewska
2,
Elżbieta Kaczmarek
3, Wiesława Biczysko
3Expression of IGF-I and Viral Proteins (C, NS3, NS5A)
in the Livers of Patients with Chronic HCV Infection*
Ekspresja IGF-I oraz białek wirusowych (C, NS3, NS5A)
w wątrobie pacjentów z przewlekłym zakażeniem HCV
1Department of Histology and Embryology, University of Medical Sciences, Poznań, Poland 2Department of Infectious Diseases, University of Medical Sciences, Poznań, Poland 3Department of Clinical Pathomorphology, University of Medical Sciences, Poznań, Poland
Abstract
Background. Hepatitis C virus (HCV) infection leads to chronic hepatitis in over 80% of infected individuals and is regarded as the most important factor in the development of hepatocellular carcinoma (HCC). The involvement of HCV genome products in the etiology of HCC has been proven. The role of Insulin-like Growth Factors I and II (IGF-I and II) as markers of HCV progression to liver cirrhosis and HCC remains relatively unrecognized. Objectives. The aim of the study was to evaluate HCV protein (C, NS3, NS5A) and IGF-I tissue expression in liver biopsies obtained from patients with long-lasting HCV infection and to correlate them with clinical data. Material and Methods. The study was conducted on liver biopsies obtained from chronic hepatitis C (CH-C) patients (n = 30), fragments of patients’ livers (n = 6), and a tissue microarray including samples from livers with HCC (n = 57) and control livers (n = 9). The immunocytochemical ABC and ImmunoMax techniques were used. The intensity of HCV protein expression was evaluated on a semiquantitative scale and the expression of IGF-I was demonstrated using a spatial visualization technique.
Results. In hepatocytes the cytoplasmic localization of IGF-I was demonstrated. The mean expression of IGF-I was most pronounced in the control livers, in which it was significantly higher than in patients with CH-C or patients with HCC. In patients with CH-C no correlation could be demonstrated between the cellular expression of IGF-I on the one hand and the grade of inflammation activity (grading), stage of fibrosis (staging), steatosis, serum HCV RNA and alpha-fetoprotein levels on the other. Positive correlations were detected between tissue expressions of IGF-I and two HCV proteins: C and NS3. Negative correlations were detected between the expression of IGF-I and the activity of both aminotransferases (ALT and AspAT). In patients with HCC no relationship could be estab-lished between the expression of IGF-I and the histological malignancy of the tumor.
Conclusions. Lower tissue expression of IGF-I was found in the patients with damaged livers (CH-C and HCC) in comparison with the control livers. This decrease correlated with increased aminotransferases activity in the patients with chronic hepatitis C. In the HCV-infected livers, a positive correlation was found between IGF-I expression and the expression of two HCV viral proteins: C and NS3 (Adv Clin Exp Med 2011, 20, 3, 263–273).
Key words: chronic infection with HCV, insulin-like growth factor-I, immunocytochemistry, spatial visualization technique.
Streszczenie
Wprowadzenie. Zakażenie wirusem C zapalenia wątroby (HCV) prowadzi do przewlekłego zapalenia wątroby u ponad 80% zakażonych i uznaje się je za najważniejszy czynnik ryzyka rozwoju pierwotnego raka wątroby (HCC). W etiologii HCC dowiedziono udziału produktów genomu HCV. Mało jest poznana rola insulinopodobnych czyn-ników wzrostu (insulin-like growth factors) I i II (IGF-I i II) jako markerów progresji zakażenia HCV w kierunku marskości wątroby i HCC.
Adv Clin Exp Med 2011, 20, 3, 263–273 ISSN 1230-025X
oRIGINAL PAPERS
© Copyright by Wroclaw Medical University
Cel pracy. ocena tkankowej ekspresji białek HCV (C, NS3, NS5A) oraz IGF-I w biopunktatach wątroby pacjentów z długotrwałym zakażeniem HCV oraz ich korelacji z danymi klinicznymi.
Materiał i metody. Do badań zakwalifikowano biopunktaty wątroby pacjentów z przewlekłym zapaleniem wątroby typu C (CH-C) (n = 30), fragmenty wątroby pacjentów (n = 6) i tkankowy panel z rakiem wątrobowokomórkowym (HCC) (n = 57) oraz fragmenty kontrolnej wątroby (n = 9). Zastosowano metodę immunocytochemiczną ABC i ImmunoMax. Nasilenie ekspresji białek HCV oceniono w skali półilościowej, a ekspresję IGF-I z zastosowaniem techniki wizualizacji przestrzennej.
Wyniki. Wykazano cytoplazmatyczne umiejscowienie IGF-I w hepatocytach. Średnia ekspresja IGF-I była naj-większa w kontrolnej wątrobie, istotnie naj-większa niż u pacjentów z CH-C i pacjentów z HCC. U pacjentów z CH-C nie wykazano korelacji między komórkową ekspresją IGF-I a aktywnością zapalną, nasileniem włóknienia, stłusz-czeniem, surowiczym stężeniem HCV RNA oraz alfafetoproteiny. Pozytywne korelacje dotyczyły tkankowej eks-presji IGF-I oraz dwóch białek HCV: C oraz NS3. Negatywne korelacje wykazano między ekspresją IGF-I a aktyw-nością obu aminotransferaz (ALT i AspAT). U pacjentów z HCC nie udało się wykazać zależności między ekspresją IGF-I i stopniem złośliwości histologicznej nowotworu.
Wnioski. Wykazano obniżoną tkankową ekspresję IGF-I u pacjentów z uszkodzoną wątrobą (CH-C i HCC) w porównaniu z wątrobą kontrolną, obniżenie to korelowało ze zwiększoną aktywnością aminotransferaz u pacjen-tów z przewlekłym zapaleniem wątroby typu C. W zakażonej HCV wątrobie wykazano pozytywną korelację mię-dzy ekspresją IGF-I i dwóch białek wirusowych HCV: C i NS3 (Adv Clin Exp Med 2011, 20, 3, 263–273). Słowa kluczowe: przewlekłe zakażenie HCV, insulinopodobny czynnik wzrostu I, immunocytochemia, technika wizualizacji przestrzennej.
The number of individuals infected with hepa-titis C virus (HCV) is estimated at 3% population or over 170 million people worldwide, including approximately 700 thousand in Poland [1, 2]. In over 80% of the cases, infection with the virus leads to chronic hepatitis; the chronic inflamma-tory process in the liver results in liver cirrhosis in at least 20% of the patients within 20 years fol-lowing infection with HCV, and in hepatocellular carcinoma (HCC) in an average of 25% of infected patients [1, 2]. Epidemiological studies indicate that hepatocellular carcinoma develops in 3–6% patients with liver cirrhosis induced by HCV and in around 1% of patients with the infection but with no signs of cirrhosis. This suggests the ex-istence of various signalling pathways leading to hepatocarcinogenesis [3]. The molecular founda-tions of HCC development are complex and not completely understood [4]. The direct agents that induce a disturbed cell cycle in hepatocytes involve products of the HCV genome, which has been the subject of intense study. Research has particularly emphasized the involvement of three HCV proteins (C, NS3 and NS5A) in the process. Several reports point to a relationship between the subcellular lo-cation, concentration and specific molecular form of the proteins, the presence of specific domains (e.g., the presence of a nuclear localization signal homologous to Bcl-2) and their effects on mecha-nisms linked to oncogenesis [5]. A disturbed equi-librium between the proliferation and apoptosis of hepatocytes in chronic HCV infection may re-sult in a loss of normal response to cytokines and growth factors, among which Insulin-like Growth Factors I and II (IGFs) play a significant role [4]. In recent years increasing attention has been devoted to interactions between HCV and IGF genome
products, although the influence of HCV proteins themselves on the expression of IGF system compo-nents has been reported relatively infrequently [6]. Both IGFs stimulate DNA synthesis and cell pro-liferation, and are involvedin the growth, differ-entiation and survival of several cell types [7, 8]. In humans, the main cellular source of IGFs are hepatocytes [9]. IGF-I circulates in a complex with binding proteins (IGF-BPs) in blood and it exerts its biological functions primarily through the me-diation of the IGF receptor type I (IGF-IR) [10]. A normal mature liver shows high IGF-I expres-sion and low IGF-II expresexpres-sion. However, despite its high expression, IGF-I plays an insignificant role in a normal liver due to a low level of recep-tor type I expression [11]. Lowered production of the peptide and elevated production of its recep-tor has been demonstrated in various chronic liver diseases [12–14]. The potential involvement of the IGF system in hepatic carcinogenesis is linked to observations of the strong mitogenic effect of both IGFs on cultured cells of hepatocellular carcinoma [4, 9, 15]. Findings related to the role of IGF-I in the progression of chronic hepatitis C in humans are inconsistent [14, 16]. In HCV infection elevat-ed levels of circulating IGF-I have been observelevat-ed [16], as have lower levels as compared to the con-trol groups [14, 17, 18].
No reports are available on correlations be-tween cellular expression of IGF-I and expression of HCV proteins of potential significance for he-patocarcinogenesis in the course of long-lasting chronic hepatitis C.
viral proteins (C, NS3 and NS5A) in liver biopsies, in relation to selected clinical data in patients with long-term chronic hepatitis C and hepatocellular carcinoma.
Material and Methods
The Patients
A series of tests were performed on 30 archi-val liver biopsies obtained from the Department of Infectious Diseases, Poznan University of Medi-cal Sciences in Poznan, Poland, where the biop-sies were performed between 2005 and 2008. The biopsies were from adult patients (16 men and 14 women, including six patients with cirrhosis) with documented long-term chronic hepatitis C (mean duration of HCV infection was 22 ± 10 years), confirmed serologically (anti-HCV and HCV RNA were positive in all patients). All the patients were seronegative for other viruses (HBV, HCMV, EBV, HIV-1 and HIV-2) in standard en-zyme immunoassays (ELISA). other causes of liv-er damage (e.g. α1-antitrypsin deficiency, Wilson’s
disease, alcohol dependency) were ruled out. All the patients had exhibited elevated serum alanine aminotransferase (ALT) level for at least 6 months (normal level is below 40 U/l). All the patients we-re seropositive for HCV antibody in ELISA tests (HCV version 3.0 AXYM System, Abbott). Quan-tification of HCV RNA was conducted using the AMPLICoR HCVTM test, version 2.0 (RoCHE,
Mannheim, Germany) with a sensitivity of 600 IU/ /ml. The test was standardized against the WHo International Standard for HCV RNA. Before the liver biopsy none of the patients had been treated with anti-viral therapy. Written informed consent was obtained from each patient before the liver bi-opsy, and approval for the study was granted by the institution’s Ethical Committee.
Tests were also performed on paraffin blocks with HCC livers from six patients and a tissue microarray panel (Cybrdi Inc., Maryland, USA) (n = 57). only one patient from the HCC group was HCV-positive; in the remaining patients (in-cluding the tissue microarray panel) the serologi-cal status in terms of HCV infection remained unknown. The negative control samples were ob-tained from livers of serologically HCV-, HBV-, HCMV- and EBV-negative organ donors and from normal livers in a tissue microarray panel (Cybrdi Inc., Maryland, USA) (n = 9). These nor-mal controls showed no morphological evidence of pathology. The liver biopsy specimens were fixed in 10% buffered formalin and embedded in paraffin for the purposes of light microscopy.
His-topathological lesions were evaluated using classi-cal H + E staining and a numericlassi-cal scoring system for portal/periportal necroinflammation grading (G1 = 0-4), for lobularnecroinflammation grad-ing (G2 = 0–4) and for fibrosis staggrad-ing (S = 0–4), as proposed by Scheuer [19]. Liver steatosis was semi-quantitatively appraised, scoring 0 when no steatosis was noted under a light microscope, grade 1 when < 30% of the hepatocytes were af-fected, and grade 2 when 30–70% of the hepato-cytes were affected [20].
Immunocytochemistry
For immunocytochemistry, 5 µm thick sec-tions were cut and mounted onto SuperFrost/Plus microscope slides. Monoclonal mouse anti-human IGF-I antibodies (R&D Systems Inc., in a 1 : 500 dilution) were used, as well as mouse monoclonal antibodies against the NS3 and NS5A proteins (NoVoCASTRA Labs) and against the capsid C protein (CHEMICoN International, Inc.) all in a dilution of 1 : 50. The tests were conducted according to the classical ABC (avidin-biotin-peroxidase complex) technique (IGF-I) [21] and ImmunoMax technique (C, NS3, NS5A), as de-scribed in detail in our previous studies [20]. In the ImmunoMax technique, the key reaction in-volved an eight-minute incubation with biotiny-lated tyramine (1:50, PerkinElmer Life Sciences, Inc.) at room temperature. This was followed by another application of streptavidin complex. Con-trol reactions were based on substituting specific antibodies with normal control sera of the respec-tive species in 0.05 M Tris-HCl, pH 7.6, supple-mented with 0.1% BSA and 15 mM sodium azide (internal negative control).
Evaluation of the Results
and Morphometric Analysis
The histological slides with IGF-I tissue ex-pression were examined under an optical olym-pus BH-2 microscope connected to a Nikon DS-5M-U1 digital camera. Color microscope images (2560 × 1920 pixels in size) were recorded and archived using a ×40 objective (at least 10 fields for every microscope slide with a positive immu-nocytochemical reaction) using LUCIA Image 5.0 software to document them in jpg format on the computer hard disc.In order to conduct the statistical analysis, the results obtained using the two image analysis pro-grams (LUCIA Image 5.0 and A4D) were exported to the Microsoft Excel program format, which is compatible with the Statistica PL v. 8 program. The mean surface area of the immunocytochemi-cal reaction for IGF-I per the entire surface area of liver parenchyma in every patient and every group of patients was calculated and expressed in per-centages (Fig. 1).
The ImmunoMax technique was used to ascer-tain the NS3, NS5A and C protein contents in the liver biopsies. The results were calculated by a semi-quantitative technique and rated as follows: 0 = 0% positive cells; 1 = individual positive cells (< 10%); 2 = 10–25% positive cells; 3 = 26–50% positive cells; 4 = 51–75% positive cells; 5 = 76–100%
posi-tive cells [23], evaluating10 microscopic fields at a magnification of 400×. The final result repre-sented the mean score from 10 microscopic fields.
Statistical Methods
First, the parameters of the descriptive statis-tics were calculated (the arithmetic mean, standard deviation, median value, minimum and maximum values). The statistical analysis of qualitative traits used the Mann-Whitney test for unlinked samples and the Wilcoxon test for non-parametric depen-dent data. Spearman’s correlation was applied to associate values of variables, while comparisons of three independent samples were conducted using the Kruskal-Wallis non-parametric test. Spear-man’s rank correlation was applied to examine the
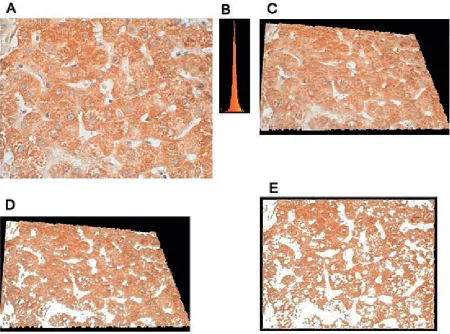
Fig. 1. A4D software screen shot: threshold segmentation of ICC reaction(brown) of IGF-I expression in the liver of a patient with chronic hepatitis C: (A) image obtained using a light microscope (×40 objective) connected to a dig-ital camera, ABC technique; cell nuclei counterstained with hematoxylin, (B) histogram of the colors composing the shades of the brown IGF-I coloring, (C) spatial transformation of a flat microscope image (A), (D) segmentation of IGF-I from a spatial image (C), (E) projection of the spatially transformed reaction onto a plane as a final result of automatic IGF-I segmentation for measuring its area and its share (%) of the area of liver parenchyma
association between variable values. Differences and relationships were regarded as statistically sig-nificant when p ≤ 0.05. The statistical analysis used Statistica PL v. 8 software.
Results
Clinical Data of the Patients
with Chronic Hepatitis C
Selected demographic, biochemical and his-topathological data of the patients with chronic hepatitis C are presented in Table 1.
Cellular Expression of HCV
Proteins – C, NS3 and NS5A
In the studied biopsies of CH-C livers, most-ly cytoplasmic localization of HCV proteins was demonstrated, with variable intensity of expres-sion. Semi-quantitative analysis demonstrated that the most abundant expression was of the NS3 protein, which was significantly more pronounced than the expression of the C protein or NS5A protein (Fig. 2). No significant differences were detected between the C (core) protein expression and the expression of NS5A (Table 2). No expres-sion of HCV proteins was detected in the livers of the control patients or the patients with HCC.Table 1. Selected clinical data and histopathology results of patients with long-term chronic hepatitis C
Tabela 1. Wybrane dane kliniczne i wyniki badania histopatologicznego pacjentów z przewlekłym długotrwałym zapaleniem wątroby typu C
Statistical trait
(Cecha statystyczna) Mean(Średnia) Median(Mediana) Mode(Moda)
Frequency of the mode (Liczność mody)
Min. Max. SD
Age of patients – years
(Wiek pacjentów – lata) 42.20 42.50 multip. 2 19.00 74.00 16.50
Duration of infection – years
(Czas trwania infekcji – lata) 22.17 20.00 19.00 3 9.00 44.00 9.97
ALT 82.26 75.00 multip. 2 22.00 261.00 53.92
AspAT 71.85 57.00 multip. 2 18.00 178.00 46.15
AFP 6.34 4.00 multip. 1 1.14 55.64 11.00
G1* 1.70 2.00 1.00 12 0.00 3.00 0.92
G2* 1.93 2.00 multip. 10 0.00 3.00 0.91
Staging (S)*
(Włóknienie) 2.27 2.00 1.00 13 0.00 4.00 1.41
Steatosis*
(Stłuszczenie) 1.30 1.00 1.00 15 0.00 2.00 0.65
ALT – alanine aminotransferase. AspAT – aspartate aminotransferase. AFP – alpha-fetoprotein.
G1 – grade of portal/periportal necroinflammation. G2 – grade of lobularnecroinflammation.
S – stage of fibrosis.
* – parameters evaluated on a semi-quantitative scale (see Material and Methods). SD – standard deviation.
multip. – multiplication.
ALT – aminotransferaza alaninowa. AspAT – aminotransferaza asparaginianowa. AFP – alfafetoproteina.
G1 – aktywność zmian martwiczo-zapalnych w przestrzeni bramnej i okołobramnej. G2 – aktywność zmian martwiczo-zapalnych wewnątrz zrazików.
S – zaawansowanie włóknienia.
* – parametry ocenione w skali półilościowej (zob. Materiał i metody). SD – odchylenie standardowe.
Tissue Expression of IGF-I
Thecellular expression of IGF-I in all the stud-ied cases involved mainly hepatocytes, but a posi-tive reaction was also noted also in the epithelial cells of the bile ducts and the cells of the liver si-nuses (Browicz-Kupffer cells and the vascular en-dothelium). A highly variable intensity of IGF-I reaction was observed in individual patients with chronic hepatitis C and HCC, while in the control livers an intense reaction prevailed (Fig. 3). The mean expression of IGF-I reached its maximum in the control livers, and was significantly higher
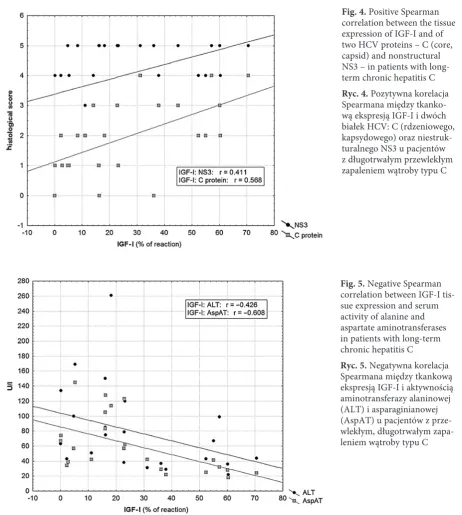
than the analogous expression in patients with chronic hepatitis C or HCC. No significant differ-ences in expression of the peptide were detected between the patients with HCV infection and those with HCC (Table 3). In the group of patients with chronic HCV infection, no significant Spearman correlations were detected between the expression of IGF-I and the grade of portal/periportal necro-inflammation (G1) (r = –0.053), the grade of lobu-lar necroinflammation (G2) (r = –0.192), the stag-ing (r = –0.245), steatosis (r = 0.031), serum level of HCV RNA (r = 0.005) and AFP (r = –0.306) (p > 0.05 in all cases). A pronounced positive Spearman correlation was demonstrated between the tissue expression of IGF-I and the expression of the C protein; a less pronounced one was found between the tissue expression of IGF-I and the ex-pression of the NS3 protein (Fig. 4). Negative cor-relations were detected between the expression of IGF-I and the activity of both aminotransferases (Fig. 5).
In the group of patients with HCC, no significant differences or correlations were detected between he-patic expression of IGF-I and histologic malignancy in this type of tumor (r = –0.210; p > 0.05).
Discussion
IGF-I controls the expression of over 50 genes linked to mitogenesis and cell differentiation. Its mitogenic effects mainly reflect stimulation of DNA synthesis and of cyclin D1 expression – cyclin D1 being the cyclin that accelerates cells’ passage from the G1 phase to the S phase of the cell cycle [8]. Numerous signalling pathways of IGF-I have been described which may promote tumor develop-Fig. 2. Immunocytochemical localization of NS3
protein in hepatocyte cytoplasm in a patient with chronic hepatitis C, ABC-ImmunoMax technique, Hematoxylin counterstained, ×40 objective Ryc. 2. Immunocytochemiczne umiejscowienie białka NS3 w cytoplazmie hepatocytów u pacjenta z przewlekłym zapaleniem wątroby typu C, technika ABC-ImmunoMax, podbarwienie hematoksyliną, powiększenie obiektywu ×40
Table 2. Mean expression of HCV proteins (C, NS3 and NS5A) in liver biopsies from patients with long-term chronic HCV infection
Tabela 2. Wartości średniej ekspresji białek HCV (C, NS3 i NS5A) w biopunktatach wątroby pacjentów z przewlekłym długotrwałym zakażeniem HCV
HCV proteins
(Białka HCV) n Mean(Średnia) Median(Mediana) Mode(Moda) Frequency of the mode(Liczność mody) Min. Max. SD
C 30 2.23* 2 Multip. 7 0 4 1.33
NS3 30 4.10** 4.5 5 15 0 5 1.32
NS5A 26 2.23 2 1 8 0 5 1.45
* – p = 0.0001 – NS3 protein vs. C protein. ** – p = 0.0001 – NS3 protein vs. NS5A. SD – standard deviation.
Multip. – multiplication.
* – p = 0,0001 – między ekspresją białka NS3 i białka C. ** – p = 0,0001 – między ekspresją białka NS3 i białka NS5A. SD – odchylenie standardowe.
ment in humans, such as the signalling pathway involving phosphatidylinositol 3-kinase (PI3K) and mitogen-activated protein kinase (MAPK), which control transcription and are involved in the progression of the cell cycle [24].
Examination of the reciprocal correlations be-tween the expression of IGF-I and the expression
of potentially oncogenic HCV proteins in livers of patients with chronic hepatitis C demonstrated positive correlations with the proteins best repre-sented in the liver biopsies: NS3 and capsid (core, C) protein. There are no reports on this subject in the available literature. Both HCV proteins might undergo translocation to the cell nucleus, where they act as transcription activators [25]. The in-volvement of these proteins in cell cycle control has been described; it is mediated by interactions with p21 and p53 proteins and cyclins. NS3 spe-cifically inhibits the activity of the p21/WAF1 pro-moter, in a dose-dependent manner. The effect is not cell specific and it manifests a synergy with the effect of the C protein [26]. Several studies point to interrelationships between subcellular local-ization, molecular forms, concentrations of the proteins in hepatocytes of patients with chronic hepatitis C and their effects on mechanisms linked to oncogenesis (see Kasprzak and Adamek [5] for a review).
It has been demonstrated that transfection with HCV-core protein in human liver carcino-ma HepG2 cell line increases endogenous IGF-II expression from promoter 4 of the IGF-II gene through two cis-acting elements: Sp1 and Egr1 binding sites. These results indicate that protein C of HCV functions as a positive regulator of IGF-II transcription through the protein kinase C path-way and may play an important role in promoting cell division during hepatic carcinogenesis [6].
There are only a few reports related to he-patic expression of IGF-I and its receptor at vari-ous stages of chronic hepatitis C in humans [27]. Those studies point to increased production of mRNA for the IGF-I receptor (IGF-IR), but not of IGF-I transcript, in patients with chronic hepa-titis C as compared to control groups. The aug-mented production of mRNA and IGF-IR protein itself was accompanied by proliferation of the bile ducts [27].
The tests performed by the current authors documented reduced IGF-I expression in the liv-ers of patients with long-lasting chronic hepatitis C andHCC, as compared to the expression of the peptide in the livers of the control patients. No significant differences were detected in the inten-sity of the peptide expression between patients with chronic hepatitis C and patients with HCC. Similarly, lowered cellular expression of IGF-I has been described by other authors in 100% of the studied cases of hepatocellular carcinoma [15]. The results of the present study indirectly confirm observations of lowered serum concentrations of IGF-I in chronic liver diseases, including cancer of the liver [18, 28]. However, the current study found no correlation between the production of Fig. 3. Immunocytochemical localization of IGF-I in
hepatocyte cytoplasm in (A) a patient with chronic hepatitis C; (B) a patient with HCC; and (C) a control liver, ABC technique, hematoxylin counterstained, ×40 objective
Ryc. 3. Immunocytochemiczne umiejscowienie IGF-I w cytoplazmie hepatocytów u pacjenta z prze-wlekłym zapaleniem wątroby typu C (A), HCC (B) i wątrobie kontrolnej (C), technika ABC, podbarwienie hematoksyliną, powększenie obiektywu ×40
A
B
IGF-I in the livers of HCV-infected patients and liver steatosis, the intensity of inflammatory le-sions or fibrosis of the liver, although an earlier study described a pronounced positive correlation between a decrease in IGF-I production and fatty liver degeneration [29]. However, reports are also available in which patients with chronic hepatitis C showed increased serum IGF-I concentration as compared to the control [16]. In the course of anti-viral therapy, an increase in IGF-I concentra-tion has been observed [14], as has a decrease in its concentration, accompanied by an increase in the concentration of growth hormone [18].
In general, HCV infection is (like HCC) as-sociated with a decrease in serum IGF-I concen-tration, which, as a rule, correlates with more ad-vanced liver fibrosis [12–14]. Some investigators regard IGF-I as a marker of liver fibrosis [14].
The results of the current study tend to con-firm the observations of authors who detected no relationship between IGF-I concentration and disease severity (Child score) [28]; the tests per-formed did not demonstrate significant relation-ships between expression of the peptide and the advancement of liver histopathology, serum HCV RNA and AFP levels. Some investigators regard
Fig. 4. Positive Spearman correlation between the tissue expression of IGF-I and of two HCV proteins – C (core, capsid) and nonstructural NS3 – in patients with long-term chronic hepatitis C Ryc. 4. Pozytywna korelacja Spearmana między tkanko-wą ekspresją IGF-I i dwóch białek HCV: C (rdzeniowego, kapsydowego) oraz niestruk-turalnego NS3 u pacjentów z długotrwałym przewlekłym zapaleniem wątroby typu C
Fig. 5. Negative Spearman correlation between IGF-I tis-sue expression and serum activity of alanine and aspartate aminotransferases in patients with long-term chronic hepatitis C
IGF-I as a risk factor for the development of HCC arising from cirrhosis in HCV infections: Work-ing with a group of over 100 patients in a prospec-tive study, Mazziotti et al. found that IGF-I con-centration drastically decreased 9 ± 3 months before development of HCC [12]. The authors of the current study were unable to confirm this ob-servation, since there were only six liver cirrhosis patients in the analyzed group of patients with chronic hepatitis C. Also, the current study dis-closed no significant differences in the expression of IGF-I in patients with HCC which would de-pend on the histological malignancy of the tumor
in vivo. Except in one patient, we were unaware
of the specific etiology of the HCC. In addition to quantitative differences in IGF-I expression, the results of the current study showed that reduced IGF-I expression in HCV-positive patients corre-lates with enhanced activity of both aminotrans-ferases. A similar correlation between a decrease in IGF-I and enhanced ALT activity has been described in fatty liver degeneration independent of a viral infection [29]. Those authors observed a hyperechogenic liver pattern that was associated with low serum IGF-I levels, a low serum IGF-I/ /IGFBP-3 ratio and increased serum ALT levels; and they concluded that hepatic steatosis is asso-ciated with low serum IGF-I levels [29].
IGF-I is produced primarily by the liver as an endocrine hormone, and in target tissues in a para-crine/autocrine fashion [7, 8]. The lowered tissue expression of IGF-I (as compared to the controls) found in the current study in patients who had CH-C or HCC could be attributed to liver damage from chronic inflammation and/or neoplastic al-terations. our observations only partially confirm the data in the literature, in which a reduced se-rum IGF-I level has been observed among virus-positive (HCV and HBV) HCC patients compared with virus-negative metastatic liver cancer and control subjects [30]. In the set of HCC livers in the current study, the serological status connected with the HCV infection was generally unknown. The reduced tissue expression of IGF-I in the CH-C patients was better correlated with the tissue ex-pression of two HCV proteins (C and NS3) than with histopathological changes in the liver.
The authors conclude that in comparison with the control group, lowered tissue expression of IGF-I was found in the patients with damaged liv-er (CH-C and HCC). In the patients with chronic hepatitis C this decrease was correlated with in-creased aminotransferases activity. In HCV-infect-ed livers, a positive correlation was found between IGF-I expression and the expression of two HCV viral proteins: C and NS3.
Table 3. Comparison of mean expression of IGF-I in liver biopsies with long-term chronic HCV infection, those with hepa-tocellular carcinoma and the control liver samples
Tabela 3. Porównanie wartości średniej ekspresji IGF-I w biopunktatach wątroby z długotrwałym przewlekłym zakażeniem HCV, w pierwotnym raku wątroby oraz wątrobie kontrolnej
Group of patients
(Grupa pacjentów) IGF-I – % of reaction(IGF-I – % reakcji) mean
(średnia) min. max. SD(odchylenie standardowe)
CH-C (n = 30) 26.56* 0.06 70.51 21.76
HCC (n = 63) 32.09** 8.98 68.67 14.19
C (n = 9) 45.08 19.86 62.54 13.44
CH-C – chronic hepatitis C. HCC – hepatocellular carcinoma. C – control livers.
* – p = 0.0312 – CH-C vs. control group (C). ** – p = 0.0095 - HCC vs. control group (C). SD – standard deviation.
CH-C – przewlekłe zapalenie wątroby typu C. HCC – pierwotny rak wątroby.
C – kontrolne wątroby.
References
[1] Fattovich G, Stroffolini T, Zagni I, Donato F: Hepatocellular carcinoma in cirrhosis: Incidence and risk factors. Gastroenterology 2004, 127, S35–S50.
[2] Rehermann B, Nascimbeni M: Immunology of hepatitis B virus and hepatitis C virus infection. Nature Rev 2005, 5, 215–229.
[3] Colombo M: Hepatitis C virus and hepatocellular carcinoma. Sem Liv Dis 1999, 19, 263–269.
[4] Alexia C, Fallot G, Lasfer M, Schweizer-Groyer G, Groyer A: An evaluation of the role of insulin-like growth factors (IGF) and of type-I IGF receptor signalling in hepatocarcinogenesis and in the resistance of hepatocellular cells against drug-induced apoptosis. Biochem Pharmacol 2004, 86, 1003–1015.
[5] Kasprzak A, Adamek A: Role of hepatitis C virus proteins (C, NS3, NS5A) in hepatic oncogenesis. Hepatol Res 2008, 38, 1–26.
[6] Lee S, Park U, Lee YI: Hepatitis C virus core protein transactivates insulin-like growth factor II gene transcription through acting concurrently on Egr1 and Sp1 sites. Virology 2001, 283, 167–177.
[7] Le Roith D, Werner H, Beitner-Johnson D, Roberts CT Jr: Molecular and cellular aspects of the insulin-growth factor I receptor. Endocr Rev 1995, 16, 143–163.
[8] Le Roith D, Bondy C, Yakar S, Liu JL, Butler A: The somatomedin hypothesis: 2001. Endocr Rev 2001, 22, 53–74. [9] Scharf JG, Dombrowski F, Ramadori G: The IGF axis and hepatocarcinogenesis. Mol Pathol 2001, 54, 138–144. [10] Daughday WH, Rotweien P: Insulin-like growth factors I and II: peptide, messenger ribonucleic acid and gene
structures, serum and tissue concentrations. Endocr Rev 1989, 10, 68–91.
[11] Caro JF, Poulos J, Ittoop O, Pories WJ, Flickinger EG, Sinha MK: Insulin-like growth factor I binding in hepa-tocytes from human liver, human hepatoma, and normal, regenerating, and fetal rat liver. J Clin Invest 1988, 81, 976–981.
[12] Mazziotti G, Sorvillo F, Morisco F, Carbone A, Rotondi M, Stornaiuolo G, Precone DF, Cioffi M, Gaeta GB, Caporaso N, Carella C: Serum insulin-growth factor I evaluation as a useful tool for predicting the risk of devel-oping hepatocellular carcinoma in patients with hepatitis C virus-related cirrhosis: a prospective study. Cancer 2002, 95, 2539–2545.
[13] Vyzantiadis T, Theodoridou S, Giouleme O, Harsoulis P, Evgenidis N, Vyzantiadis A: Serum concentrations of insulin-like growth factor-I (IGF-I) in patients with liver cirrhosis. Hepatogastroenterology 2003, 50, 814–816. [14] Lorenzo-Zuniga V, Bartoli R, Masnou H, Montoliu S, Morillas RM, Planas R: Serum concentration of
insulin-like growth factor-I (IGF-I) as a marker of liver fibrosis in patients with chronic hepatitis C. Dig Dis Sci 2007, 52, 3245–3250.
[15] Huynh H, Chow PKH, Ooi LLP, Soo KC: A possible role of insulin-like growth factor-binding protein-3 autocrine/ paracrine loops in controlling hepatocellular carcinoma cell proliferation. Cell Growth Differ 2002, 13, 115–122. [16] Okan A, Comlekci A, Akpinar H, Okan I, Yesil S, Tankurt E, Simsek I: Serum concentration of
insulin-like growth factor-I and insulin-insulin-like growth factor binding protein-3 in patients with chronic hepatitis. Scand J Gastroenterol 2000, 35, 1212–1215.
[17] Mahdy KA, Ahmed HH, Mannaa F, Abdel-Shaheed A: Clinical benefits of biochemical markers of bone turnover in Egyptian children with chronic liver diseases. World J Gastroenterol 2007, 13, 785–790.
[18] Plöckinger U, Krüger D, Bergk A, Weich V, Wiedenmann B, Berg T: Hepatitis-C patients have reduced growth hormone (GH) secretion which improves during long-term therapy with pegylated interferon-alpha. Am J Gastroenterol 2007, 102, 2724–2731.
[19] Scheuer PJ: Classification of chronic viral hepatitis: a need for reassessment. J Hepatol 1991, 13, 372–374. [20] Kasprzak A, Adamek A, Biczysko W, Seidel J, Przybyszewska W, Olejniczak K, Juszczyk J, Zabel M: Intracellular
expression of the proliferative marker Ki-67 and viral proteins (NS3, NS5A and C) in chronic, long lasting hepa-titis C virus (HCV) infection. Folia Histochem Cytobiol 2007, 45, 357–366.
[21] Hsu S, Raine L, Fanger H: Use of a avidin-biotin peroxidase complex (ABC) in immunoperoxidase techniques. J Histochem Cytochem 1981, 29, 577–580.
[22] Kaczmarek E, Strzelczyk R: From two to three-dimensional visualisation of structures in light and confocal microscopy – applications for biomedical studies. In: Current issues on multidisciplinary microscopy research and education. FoRMATEX microscopy book series no. Eds.: Mendez-Vilas A, Labajos-Broncano L, II Formatex Research Centre, Badajoz 2005, 1st ed., 289–295.
[23] Volkmann M, Schiff JH, Hajjar Y, Otto G, Stilgenbauer F, Fiehn W, Galle PR, Hofmann WJ: Loss of CD95 expression is linked to most but not all p53 mutants in European hepatocellular carcinoma. J Mol Med. 2001, 79, 594–600.
[24] Grimberg A: Mechanisms by which IGF-I may promote cancer. Cancer Biol Ther 2003, 2, 630–635.
[25] Anzola M. Hepatocellular carcinoma: role of hepatitis B and hepatitis C viruses proteins in hepatocarcinogenesis. J Viral Hepat 2004, 11, 383–393.
[26] Kwun HJ, Jung EY, Ahn JY, Lee MN, Jang KL: p53-dependent transcriptional repression of p21 (waf1) by hepa-titis C virus NS3. J Gen Virol 2001, 82, 2235–2241.
[27] Stefano JT, Correa-Giannella ML, Ribeiro CMF, Alves VAF, Massarollo PCB, Machado MCC, Giannella- -Neto D: Increased hepatic expression of insulin-like growth factor-I receptor in chronic hepatitis C. World J Gastroenterol 2006, 28, 3821–3828.
[29] Völzke H, Nauck M, Rettig R, Dörr M, Higham C, Brabant G, Wallaschofski H: Association between hepatic stea-tosis and serum IGF1 and IGFBP-3 levels in a population-based sample. Eur J Endocrinol 2009, 161, 705–713. [30] Stuver SO, Kuper H, Tzonou A, Lagiou P, Spanos E, Hsieh CC: Insulin-like growth factor 1 in hepatocellular
carcinoma and metastatic liver cancer in men. Int J Cancer 2000, 87, 118–121.
Address for correspondence:
Aldona Kasprzak
Department of Histology and Embryology University of Medical Sciences
Święcickiego 6 60-781 Poznań Poland
Tel.: 48 61 854 64 41
E-mail address: [email protected]
Conflict of interest: None declared