Address for correspondence
Mohammad Najafi E-mail: nbsmmsbn@iums.ac.ir
Funding sources
None declared
Conflict of interest
None declared
Received on November 17, 2015 Revised on December 18, 2015 Accepted on April 25, 2016
Abstract
Background. Cholesterol homeostasis is dependent upon the sterol regulatory element binding protein 2 (SREBP-2) regulatory system and the functioning of plasma proprotein convertase subtilisin/kexin type 9 (PCSK9). Many studies have also reported that low density lipoprotein receptor (LDLR) levels in cellular membranes are related to the functioning of these proteins.
Objectives. The aim of this study was to investigate the association of lipid profiles with circulating PCSK9 protein values and SREBP-2 expression levels in normal subjects.
Material and methods. The study involved 120 randomly chosen healthy subjects. Their lipid profiles were measured using routine laboratory techniques, and the plasma PCSK9 protein and SREBP-2 expression levels were determined by ELISA and real time quantitative PCR methods, respectively. A statistical analysis was carried out using a statistical software package.
Results. Linear regression analyses showed a significant correlation between total cholesterol and PCSK9 (3.54 ± 1.31 ng/mL), as well as between total cholesterol and SREBP-2 (0.1–35.38) (p = 0.002 and p = 0.02, respectively). Furthermore, multiple regression analyses showed strict correlations between PCSK9 and cholesterol-related parameters especially the total cholesterol/HDL-C ratio (β = 3.53, p = 0.001). There was no significant correlation between circulating PCSK9 and SREBP-2 expression levels (r = 1.2, p = 0.3). Conclusions. The study results revealed that serum cholesterol-related parameters are strictly associated with plasma PCSK9 values, suggesting that PCSK9 function has a greater effect on serum total cholesterol levels than SREBP-2 expression does. Furthermore, the total cholesterol/HDL-C ratio was a better indicator for evaluating PCSK9 level than total cholesterol.
Key words: lipid profile, PCSK9, SREBP-2
DOI
10.17219/acem/62836
Copyright
© 2017 by Wroclaw Medical University This is an article distributed under the terms of the Creative Commons Attribution Non-Commercial License (http://creativecommons.org/licenses/by-nc-nd/4.0/)
Circulating PCSK9 affects serum LDL and cholesterol
levels more than SREBP-2 expression
Asghar Mohammadi
3, B–D, Mohamad Shabani
1, A, Faezeh Naseri
2, B, F, Bita Hosseni
1, B, F,
Elham Soltanmohammadi
1, B, F, Sadegh Piran
1, B, F, Mohammad Najafi
1, 4, A, C-F1 Biochemistry Department, Medical School, Iran University of Medical Sciences, Tehran, Iran
2 Biochemistry Department, Medical School, Shahid Beheshti University of Medical Sciences, Tehran, Iran 3 Biochemistry Department, Medical School, Tarbiat Modares University of Medical Sciences, Tehran, Iran
4 Cellular and Molecular Research Center, Biochemistry Department, Medical School, Iran University of Medical Sciences, Tehran, Iran
A – research concept and design; B – collection and/or assembly of data; C – data analysis and interpretation; D – writing the article; E – critical revision of the article; F – final approval of article
Plasma PCSK9
PCSK9 ELISA kits (Abnova, Taiwan) were used in accor-dance with the manufacturer’s instructions. A standard linear curve was used to identify the plasma PCSK9 level.
RNA extraction and cDNA synthesis
Total RNA was extracted from buffy coat samples using standard kits according to the manufacturer’s instruc-tions (Total RNA Extraction Kit, Arya tous, Mashhad, Iran). The RNA quantity and quality was determined using a NanoDrop spectrophotometer (NanoDrop Prod-ucts, Thermo Fisher Scientific Inc., Wilmington, USA) and agarose-gel electrophoresis (2%). cDNA was synthe-sized using a standard kit in accordance with the manu-facturer’s instructions (PrimeScript Double Strand cDNA Synthesis Kit, Takara Bio Inc., Kusatsu, Japan).
The SYBR green real-time
quantitative PCR method
SREBP-2 gene expression level was determined using the QuantiFast SYBR Green PCR Kit (Qiagen, Hilden, Ger-many) and was normalized with reference gene (β-ACTIN,
5’-TCCCTGGAGAAGAGCTACG-3’, 5’-GTAGTTTCGT-
GGATGCCACA-3’). The primers for SREBP-2 gene
(5’-CTACGGTGCAGACAGTTGCT-3’,
5’-CCAGGGTTG-GTACTTGAAGGG-3’) were designed with Genamics
Ex-pression Software v. 1.1 (Genamics™, New Zealand). The
temperature cycles (n = 35) were performed at 95˚C for 10 s
and 63˚C for 30 s.(E = efficiency; ΔCT = CTRef – CTTar;
CT = cycle threshold; Ref = reference gene; Tar = target
gene)was used to compare the gene expression levels.
Statistical analysis
The statistical analysis was performed using SPSS soft-ware v. 16 (SPSS Inc., Chicago, IL, USA). The data distri-bution was evaluated using the Kolmogorov–Smirnov test. PCSK9 protein and SREBP-2 expression levels between genders and BMI groups (< 30 and ≥ 30) were statistically evaluated by Student’s t-test and the Mann-Whitney U-test. Linear regression analyses were performed for PCSK9 pro-tein and SREBP-2 expression levels and other biochemical (LDL-C, total cholesterol, total cholesterol/HDL-C ratio and LDL-C/HDL-C ratio) and demographic (age, gender and BMI) parameters. Multiple regression analyses were performed after the elimination of insignificant parameters obtained from the linear regression analyses. Four param-eters (LDL-C, total cholesterol, total cholesterol/HDL-C ratio and LDL-C/HDL-C ratio) were applied for the PCSK9 protein expression levels, and 3 parameters (triglyceride, total cholesterol and total cholesterol/HDL-C ratio) were applied for the SREBP-2 expression levels. P values lower than 0.05 were considered statistically significant.
Atherosclerosis is the primary cause of coronary artery
diseases (CAD) and death in the world.1 Population
stud-ies have reported the classic factors involved in the ath-erosclerosis process, including age, gender, lifestyle, blood pressure, obesity, diabetes, lipid profile and genetic de-fects. Many studies have also confirmed that
inflammato-ry events can trigger the development of atherosclerosis.2
Among the various hypotheses describing the ath-erosclerosis process, the development of atherosclerotic plaque and remodeling is the most widely accepted. Mo-lecular events show that lipid accumulation, especially low-density lipoprotein (LDL) particles and its modified forms in subendothelial macrophages develop foam cells,
forming the core of atherosclerotic plaques.3 The
macro-phages scavenge the particles via LDL receptors (LDLR).4
Studies have also reported that the LDLR level is depen-dent upon the function of factors such as sterol regula-tory element binding protein-2 (SREBP-2) and proprotein convertase subtilisin/kexin type 9 (PCSK9). The reduced cellular cholesterol pool induces SREBP-2 expression,
re-sulting in an increase in LDLR level.5,6
Studies have also revealed that the SREBP-2 regula-tory system is involved in cholesterol homeostasis and is
related to 3 main factors: SREBP-2, PCSK9 and LDLR.7
Based on these descriptions, the authors posited that se-rum LDL-C levels in normal high-cholesterol cases may be related to LDL uptake and may be affected by SREBP-2 expression and PCSK9 protein levels.
Material and methods
Subjects
The study involved 120 healthy adult subjects (BMI > 20) selected by a physician. The subjects had no clinical problems (lupus, liver or kidney diseases or myocardial infarction) in their medical interviews. The ethics committee at Iran University of Medical Sciences approved the study, and informed consent was obtained from all the subjects.
Samples
Both coagulated and EDTA-containing whole blood samples (5 mL each) were prepared from all the partici-pants. Sera and buffy coat fractions were separated and
preserved at -80˚C.
Biochemical measurements
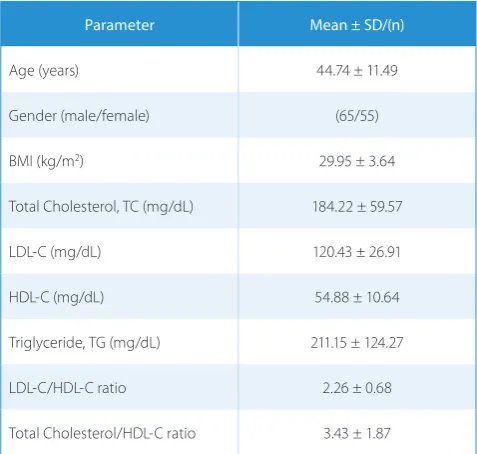
Table 1. Study population characteristics
Parameter Mean ± SD/(n)
Age (years) 44.74 ± 11.49
Gender (male/female) (65/55)
BMI (kg/m2) 29.95 ± 3.64
Total Cholesterol, TC (mg/dL) 184.22 ± 59.57
LDL-C (mg/dL) 120.43 ± 26.91
HDL-C (mg/dL) 54.88 ± 10.64
Triglyceride, TG (mg/dL) 211.15 ± 124.27
LDL-C/HDL-C ratio 2.26 ± 0.68
Total Cholesterol/HDL-C ratio 3.43 ± 1.87
Table 2. PCSK9 protein and SREBP-2 expression levels
Parameter (n) SREBP–2 (E(min–max)ΔCT) PCSK9 (ng/mL) mean ± SD
Gender male (65) female (55) p-value
0.1–35.31 0.1–27.29 0.009
3.37 ± 1.25 3.77 ± 1.36
0.1
Total (120) 0.1–35.38 3.54 ± 1.31
BMI < 30 (77) ≥ 30 (43) p-value
0.1–35.2 0.26–27.9
0.72
3.49 ± 1.29 3.66 ± 1.35
0.5
Total (120) 0.1–35.38 3.54 ± 1.31
Table 3. Linear regression analyses between plasma PCSK9 level and study parameters
Parameter coefficient (r-value)Correlation p-value
Age (year) 0.15 0.10
Body mass index
BMI (kg/m2) 0.05 0.54
Triglyceride (mg/dL) 0.07 0.44
HDL-C (mg/dL) -0.01 0.89
LDL-C (mg/dL) 0.31 0.001
Gender
(male 1, female 2) 0.15 0.1
Total cholesterol
(mg/dL) 0.29 0.002
LDL-C/HDL-C ratio 0.26 0.005
Total cholesterol/
HDL-C ratio 0.32 0.001
Results
The study population
Table 1 shows some of the biochemical and demo-graphic characteristics in study population.
Plasma PCSK9
The results showed that the plasma PCSK9 protein lev-els did not differ significantly between gender and BMI subgroups (p < 0.2 and p < 0.6, respectively), although the PCSK9 level was higher in women with BMI values over 30 (Table 2). The linear regression analyses showed that circulating PCSK9 levels were significantly correlated to LDL-C (r = 0.31, p = 0.001), total cholesterol (r = 0.29, p = 0.002), total cholesterol/HDL-C ratio (r = 0.26, p = 0.005) and LDL-C/HDL-C ratio (r = 0.32, p = 0.001) (Table 3). Moreover, the multiple regression analysis for the significant parameters showed that the circulating PCSK9 level is strictly correlated with the total choles-terol/HDL-C ratio (β = 3.53, p = 0.001) (Table 4).
SREBP-2 expression
The results showed that SREBP-2 expression was signifi-cantly higher in men than in women (p = 0.009). Further-more, the results showed significant linear correlations be-tween SREBP-2 expression and other parameters, including triglyceride (r = 0.34, p = 0.001), total cholesterol (r = 0.21, p = 0.02) and total cholesterol/HDL-C ratio (r = 0.16, p = 0.04) (Table 5). The multiple regression analysis of tri-glyceride, total cholesterol and the total cholesterol/HDL-C ratio showed that the SREBP-2 expression level is more re-lated to triglyceride (β = 0.07, p = 0.004) (Table 6). No sig-nificant linear correlation (r = 0.2, p = 0.3) was observed between the plasma PCSK9 protein and SRBPE-2 expres-sion levels (Fig. 1).
Table 4. Multiple regression analysis for plasma PCSK9 level
Parameter β SE p-value
LDL-C (mg/dL) 0.104 0.025 0.007
Total cholesterol
(mg/dL) 0.059 0.015 0.001
LDL-C/HDL-C ratio -5.079 1.299 0.005
Total cholesterol/
HDL-C ratio 3.533 0.853 0.001
Table 6. Multiple regression analysis for SREBP-2 expression
Parameter β SE p-value
Total cholesterol
(mg/dL) 0.01 0.001 0.05
Total cholesterol /
HDL-C ratio -0.009 0.008 0.366
Triglyceride (mg/dL) 0.07 0.001 0.004
Table 5. Linear regression analyses between SREBP-2 expression level and study parameters
Parameter coefficient (r-value)Correlation p-value
Age (year) 0.08 0.36
Body mass index,
BMI (kg/m2) 0.006 0.95
Triglyceride (mg/dL) 0.34 0.001
HDL-C (mg/dL) 0.033 0.72
LDL-C (mg/dL) 0.14 0.12
Gender
(male 1, female 2) -0.11 0.22
Total cholesterol
(mg/dL) 0.21 0.02
LDL-C/HDL-C ratio 0.07 0.45
Total cholesterol/
HDL-C ratio 0.16 0.04
Discussion
Experimental studies on the role of PCSK9 in cholester-ol homeostasis have revealed that PCSK9 acts as a plasma chaperone for LDLR internalization and LDLR lysosomal
degradation.8 Furthermore, finding the sterol regulatory
element (SRE) within the PCSK9 promoter showed that PCSK9 expression level is related to the SREBP-2
tran-scription factor.9 In the present study, the participants’
lipid profiles, PCSK9 protein levels and SREBP-2 expres-sion levels were evaluated. Some studies have suggested that the effect of PCSK9 on cellular membrane LDLR
lev-els might be different in extra-hepatic tissues producing
steroids10,11 In the present study, the circulating PCSK9
level was significantly correlated with LDL-C and total
cholesterol levels, confirming other studies12,13 The
re-sults also revealed that the PCSK9 level is strictly cor-related with the total cholesterol/HDL-C ratio, which might be a better indicator for assessing PCSK9. The data also showed a linear correlation, but not a significant one, between the plasma PCSK9 protein and SREBP-2 expres-sion levels. Since liver tissue is the primary site for PCSK9
expression14, it might be due to physiological
characteris-tics of extra-hepatic tissues that excess SREBP-2
increas-es LDL uptake due to LDLR over-exprincreas-ession.15,16 There is
a controversy over the function of PCSK9 and SREBP-2, since the former internalizes LDLR while the latter in-duces it. Furthermore, regression analyses showed that circulating PCSK9 is more closely associated with serum cholesterol-related parameters than SREBP-2 expression levels are. The authors suggested that cholesterol homeo-stasis could be due to degradation of LDLR rather than SREBP-2 induction. In agreement with this hypothesis, Dong et al. suggested that PCSK9 plays a significant role
in LDLR degradation in hamsters.17
Moreover, many studies have reported the increase of SREBP-2 in response to reduced intracellular cholesterol
levels.18 The results of the present study show a weak
cor-relation between total cholesterol and SREBP-2 expres-sion levels. The authors suggested that the induction of intracellular cholesterol synthesis by SREBP-2 reduces the need of extracellular cholesterol source in accordance with PCSK9 function.
Conclusions
In conclusion, the results of the current study revealed that serum cholesterol-related parameters are associated with circulating PCSK9 protein. Furthermore, total cho-lesterol/HDL-C ratio was strictly correlated with PCSK9 function. Many studies have reported that SREBP-2 is able to increase PCSK9 and LDLR expression levels so that they can inversely affect serum LDL-C levels. The present authors suggest that PCSK9 function has a great-er effect on sa great-erum total cholesta great-erol levels than SREBP-2 expression.
References
1. Thompson RC, Allam AH, Zink A, Wann, et al. Computed tomo-graphic evidence of atherosclerosis in the mummified remains of humans from around the world. Glob Heart. 2014;9(2):187–196. 2. Gijsberts CM, den Ruijter HM, Asselbergs FW, Chan MY, de Kleijn
DP, Hoefer IE. Biomarkers of coronary artery disease differ between Asians and Caucasians in the general population. Glob Heart. 2015; pii: S2211-8160(14)02671-4.
4. Najafi M, Roustazadeh A, Alipoor B. Ox-LDL particles: Modified components, cellular uptake, biological roles and clinical assess-ments. Cardiovasc Hematol Disord Drug Targets. 2011;119–128. 5. Eberlé D, Hegarty B, Bossard P, Ferré P, Foufelle F. SREBP
transcrip-tion factors: master regulators of lipid homeostasis. Biochimie. 2004;86(11):839–848.
6. Shimada YJ, Cannon CP. PCSK9 (Proprotein convertase subtilisin/ kexin type 9) inhibitors: Past, present, and the future. Eur Heart J. 2015; pii: ehv174.
7. Sokolov A, Radhakrishnan A. Accessibility of cholesterol in endoplasmic reticulum membranes and activation of SREBP-2 switch abruptly at a common cholesterol threshold. J Biol Chem. 2010;285(38):29480–29490.
8. Strøm TB, Tveten K, Leren TP. PCSK9 acts as a chaperone for the LDL receptor in the endoplasmic reticulum.Biochem J. 2014;457(1): 99-105. 9. Jeong HJ, Lee HS, Kim KS, Kim YK, Yoon D, Park SW.
Sterol-depen-dent regulation of proprotein convertase subtilisin/kexin type 9 expression by sterol-regulatory element binding protein-2. J Lipid Res. 2008;49(2):399–409.
10. Schulz R, Schlüter KD, Laufs U. Molecular and cellular function of the proprotein convertase subtilisin/kexin type 9 (PCSK9). Basic Res Cardiol. 2015;110(2):4.
11. Mbikay M, Mayne J, Chrétien M. Proprotein convertases subtilisin/ kexin type 9, an enzyme turned escort protein: hepatic and extra hepatic functions. J Diabetes. 2013;5(4):391–405.
12. AlbornWE, Cao G, Careskey HE, Qian YW, et al. Serum proprotein convertase subtilisin kexin type 9 is correlated directly with serum LDL cholesterol. Clin Chem. 2007;53(10):1814–1819.
13. Lambert G, Ancellin N, Charlton F, et al. Plasma PCSK9 concentrations correlate with LDL and total cholesterol in diabetic patients and are decreased by fenofibrate treatment. Clin Chem. 2008;54(6):1038–1045. 14. Cariou B, Si-Tayeb K, Le May C. Role of PCSK9 beyond liver
involve-ment. Curr Opin Lipidol. 2015;26(3):155–161.
15. Mbikay M, Sirois F, Simoes S, Mayne J, Chrétien M. Quercetin-3-glu-coside increases low-density lipoprotein receptor (LDLR) expres-sion, attenuates proprotein convertase subtilisin/kexin 9 (PCSK9) secretion, and stimulates LDL uptake by Huh7 human hepatocytes in culture. FEBS Open Bio. 2014;4:755–762.
16. Shin DJ, Osborne TF. Thyroid hormone regulation and cholester-ol metabcholester-olism are connected through Stercholester-ol Regulatory Element-Binding Protein-2 (SREBP-2). J Biol Chem. 2003;278(36):34114–34118. 17. Dong B, Wu M, Li H, Kraemer FB, Adeli K, Seidah NG, Park SW, Liu J.
Strong induction of PCSK9 gene expression through HNF1al-pha and SREBP2: mechanism for the resistance to LDL-cholester-ol lowering effect of statins in dyslipidemic hamsters. J Lipid Res. 2010;51(6):1486–1495.