DOI: 10.22075/jrce.2017.11561.1191
journal homepage: http://civiljournal.semnan.ac.ir/
Damage Detection in Post-Tensioned Slab Using 2D
Wavelet Transforms
S.R. Hoseini Vaez1*, E. Dehghani1 and V. Babaei1 1. Department of Civil Engineering, University of Qom, Qom. Iran.
Corresponding author:[email protected]
ARTICLE INFO ABSTRACT
Article history:
Received: 06 June 2017 Accepted: 09 July 2017
Earthquake force, loading more than structural capacity, cracking, material fatigue, and other unpredicted events are undeniable in the structure life cycle in order that environmental conditions of the structure would be changed and treats health. Damage of structures such as crack, corrosion of the post-tension cables from inappropriate grouting of the post-tension structures, etc., can lead to the collapse of the structure. Accordingly, damage detection precedes the damage is essential. In this article, damage detection in the post-tensioned slab through 2D wavelet transform investigated. Hence, the structure has been modeled with finite element method. Damaged cables have been modeled by a reduction of the post-tension force. The vertical displacement has been derived through static analysis of the intact and damaged structure. Damage location will be detected with wavelet transform on the difference of the vertical displacements. To demonstrate the ability of 2D wavelet transform single and multiple scenarios of the post-tension cables, are tested. The influence of noise in the vertical displacement data for these scenarios is also considered. Using 2D wavelet transform and damage index W, an empirical equation has been proposed to calculate damage severity of the post-tensioned slab cables.
Keywords: Damage Detection, Signal Processing, 2D Wavelet Transform, Post-Tensioned Slab.
1. Introduction
Structural damages can occur for various reasons, including fatigue, construction mistakes, corrosion, crack, and etc. In the post-tensioned slab, the post-tension cables are located in slabs such as adding not only pressure load on the concrete portion but also
an upward force in contrary to gravity load direction. This force makes loading capacity, and slab resistance increased as well, respectively.
as damage as well as damage severity of cables.
Newland is the first person who found wavelet transform in signal processing of vibrational response [1]. In the following, the results of previous studies show that the damage of a structure during an earthquake is related to the number of peak points in the wavelet points [2]. Additionally, Liu et al. suggested that wavelets are calculated in space based on the finite element method or finite-difference. They investigated uniform beam vibration having lateral crack applying finite-difference, as a numerical method. Subsequently, wavelet coefficients have been determined in accordance with beam via numerical solution for the beam deflection [3].
Fan and Qiao persuaded that methods based on modal analysis apply structural vibration response of pre- and post- damage for damage detection. They also demonstrated that the dynamic analysis of the finite element model of the structure is necessary for location and damage severity [4].
Roucka inspected the ordering effect of modes on the capability of damage detection in structures [5]. He applied the continuous wavelet transform of normalized mode shapes for damage detection. So, he studied the first eight modes of numerical and experimental in a cantilever beam. The results indicate the higher the mode shape order is, The reliability would increase.
Solís et al. proposed a method to detect damage of beams through continuous wavelet analysis, analyzing the damage from the change in mode shape between intact and damaged structures. They approximate wavelet coefficient of every mode of changes in natural frequency. Finally, mode shape
whose natural frequencies stayed fixed have been disregarded, and results of the other modes were compared. The method is sensitive to the minimum structural damage [6]. According to discrete curvelet transform with the use of unequal-interval of fast Fourier transform, Bagheri et al. applied a new method for damage detection in plate structures. In addition, he investigates the performance and sensitivity of the method through numerical and experimental data [7].Moreover, the use of signal processing techniques for detecting damage was developed by researchers [8-11].
In this study, a proposed approach applied based on 2D discrete wavelet with the use of deflection to detect the location of damages through extracted data from finite element model and assumed data from the lab in the post-tensioned slabs. Furthermore, the performance and sensitivity of this approach have been surveyed in different damage values of the post-tension cables. Finally, the damage severity of cables has been calculated by applying a damage index.
2.
Review
of
the
Wavelet
Transforms Theory
2.1. Continuous Wavelet Transform
In wavelet analysis, there is a transform that its performance is the same as the Fourier transform. Wavelet transform on signal f(t) results in coefficients called wavelet coefficient. Wavelet transform equation is displayed as follows:
𝑪(𝒔𝒄𝒂𝒍𝒆, 𝒑𝒐𝒔𝒊𝒕𝒊𝒐𝒏) = 𝑾𝒇(𝒔, 𝒖)
= ∫ 𝐟(𝐭). 𝛟(𝐬𝐜𝐚𝐥𝐞, 𝐩𝐨𝐬𝐢𝐭𝐢𝐨𝐧)𝐝𝐭
+
−
(1)
alternative for trigonometric functions, which are the function of frequency. So, the given function is location and scale.
Wavelet function has two properties: oscillation and short-term. Function Ψ (x) is called the wavelet function, only and if only the Fourier transform Ψ (w) is applied to the following equation: ∫ |𝜳(𝒘) 𝟐| |𝒘𝟐| +∞ −∞
𝒅𝒘 < +∞ (2)
where Ψ(x) is the mother wavelet function. According to the following equation, location and size of the wavelet functions applied in the processing are changed with two mathematic operations, including transmission and scale along with the processing signal. Ψ (x) is then stretched or compressed by a, and translated in space by b, to generate a set of basis functions Ψa,b(x) as follows:
𝜳𝒂,𝒃(𝒙) = 𝟏 √𝒂𝜳(
𝒙−𝒃
𝒂 ) (3)
Finally, continuous coefficients of wavelet on function f(x) in any point of signal b and for any scale values a are calculated through the equation:
𝐶𝑊𝑇(𝑎, 𝑏) = 1
√𝑎∫ 𝑓(𝑥)𝛹( 𝑥 − 𝑏 𝑎 +∞ −∞ ) 𝑑𝑥 = ∫ 𝑓(𝑥)𝛹𝑎,𝑏 +∞ −∞ (𝑥) 𝑑𝑥 (4)
Similarly, there is the following equation for a 2D signal f(x,y).
2𝐷𝑐𝑤𝑡(𝑠, 𝑎, 𝑏)
= 1 √𝑠. 𝑠∫ 𝑓(𝑥, 𝑦). 𝛹( 𝑥 − 𝑎 𝑠 +∞ −∞ ,𝑦 − 𝑏 𝑠 )𝑑𝑥𝑑𝑦 (5)
where a and b are the input signal coordinates and s is the scale.
2.2. Discrete Wavelet Transform
The other form of wavelet transform called DWT is applied to analyze the signal. Parameters such as transmission and scale are discontinuously chosen in the discrete wavelet transform.
𝑎 = 2−𝑗,𝑏 = 2−𝑗× 𝑘
where k and j are integers. With inducing a and b in the mother wavelet equation (Eq. 4), the discrete wavelet transform function is obtained.
𝛹𝑗,𝑘(𝑥) = 2 𝑗
2 𝛹(2𝑗 𝑥 − 𝑘) (6)
In 1D discrete wavelet transform, 1D input signal s(n) is decomposed into approximation section and details, according to the following equation:
𝑆0(𝑛) = 𝑆𝑖(𝑛) + ∑ 𝑤𝑗(𝑛)
𝑗≤𝑖 (7)
where, si(n) and wi(n) are approximation and details of a 1D signal in level i, respectively. They are calculated in level i+1:
𝑆𝑖+1(𝑛) = ∑ 𝑔(𝑘)𝑆𝑖(2𝑛 − 𝑘) 𝑙−1
𝑘=0
(8)
𝑊𝑖+1(𝑛) = ∑ ℎ(𝑘)𝑆𝑖(2𝑛 − 𝑘) 𝑙−1
𝑘=0
(9)
where g(k) and h(k) are low and high- pass filter coefficients, respectively, and l is for filter size. Corresponding, 2D signal S(n1, n2) is decomposed into approximation and details in 2D discrete transform, according to the following equation:
𝑆0(𝑛1, 𝑛2) = 𝑆𝑖(𝑛1, 𝑛2) + ∑𝑗≤𝑖𝑊𝑗1(𝑛1, 𝑛2) +
∑𝑗≤𝑖𝑊𝑗2(𝑛1, 𝑛2) + ∑𝑗≤𝑖𝑊𝑗3(𝑛1, 𝑛2) (10)
diagonal details of a 2D signal in level i. The approach to acquire wavelet transform for a 1D signal is that signal with a low pass filter, and a high pass filter is classified into two portions: high-frequency portion and low-frequency portion. Each portion has samples half the main signal. Subsequently, the low frequency portion again is divided into low frequency and high frequency. The action has
the same times as the decomposition level of the wavelet transform [12]. In Fig. 1, computation of three levels of 1-D wavelet transform has been depicted.
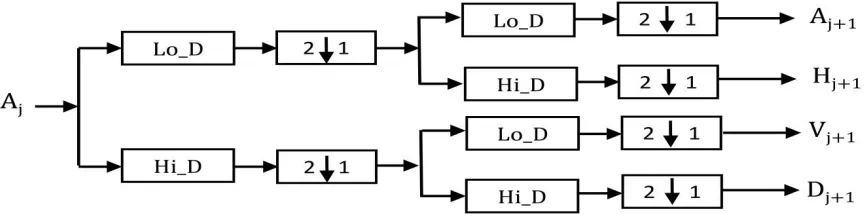
In 2D signal as the 1D signal, transform apply once in horizontal and another time in vertical. The diagram block in Fig.2 portrayed the 2D Wavelet transform.
Fig. 1. The diagram block of 1D wavelet transform in three decomposition levels.
Fig. 2. the Diagram block of 2D wavelet transform in two decomposition levels.
3. Damage Index in the 2D Wavelet
Transform
Four components are obtained through 2D wavelet transform on the vertical displacement of a 2D surface. CA1 is called as an approximate signal. CD11, CD12, CD13
are named horizontal detail signal, vertical detail signal, and diagonal detail signal in the first decomposition level, respectively.
Data is firstly determined in horizontal, vertical, diagonal directions in any levels of decomposition to identify the damage index. The value of e is the sum of the data for damage and healthy state of the structure.
e=| CD11|+| CD12|+| CD13| (11)
Finally, subtraction of e for the intact and damaged structures results in value
w,
as the damage index in the following equation:4. Numerical Analysis
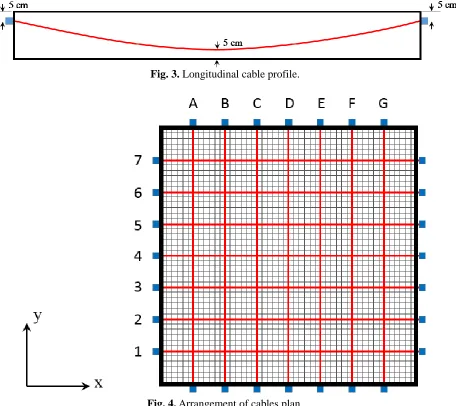
The dimensions of the post-tensioned slab in this study are 8m×8m×0.2m. According to Figs 3-4, the post-tension cables have been located at 1m intervals. Each of the cables includes three strands with a nominal diameter of 0.5 inches, having a cross-section area equal to 1cm2. Class of cables steel is A270 with failure ultimate strength 18900 kgf/cm2. Pursuant to valid regulations of pre-stressing such as ACI and BS, the maximal post-tension stress is about 75% of ultimate resistance. Thus, the force of the cables is considered up to 44250kgf. Properties of
concrete consist of Young’s modulus E= 20 GPa, specific density ρ=2500 kg/m2, and Poisson's ratio ν=0.2. The material properties of steel are Young’s modulus E=200 GPa, specific density p=7850kgf, and Poisson's ratio ν=0.2.
In the numerical model of the slab, shell elements are applied. Moreover, four edges simply supported of slab have been considered; so the post-tension effects can be passed into the slab through cables. Cables have been modeled with tendon element. Longitudinally, they have a total parabolic curve as shown in Fig. 3. In Table 1, five presumed damage scenarios are presented.
Fig. 3. Longitudinal cable profile.
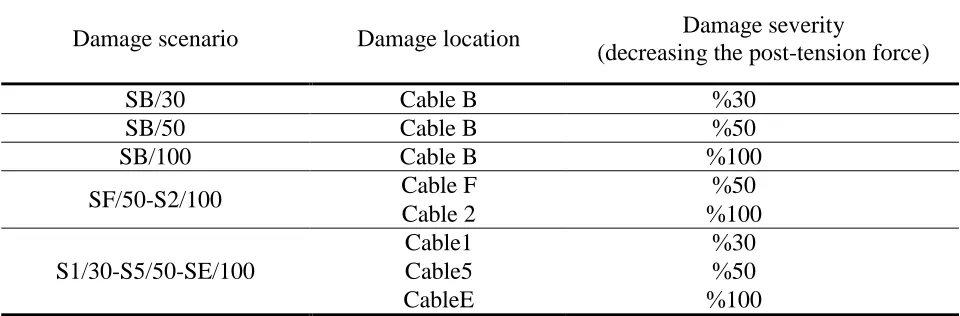
Table 1. Damage scenario defined in the post-tensioned concrete slab model. Damage severity
(decreasing the post-tension force) Damage location Damage scenario 30 % Cable B SB/30 50 % Cable B SB/50 100 % Cable B SB/100 50 % Cable F SF/50-S2/100 100 % Cable 2 30 % Cable1
S1/30-S5/50-SE/100 Cable5 %50
100 % CableE
5. Damage Detection Approach
The approach proposed in this study is based on 2D wavelet transform for damage detection in the cables of the post-tensioned concrete slab. 2D discrete wavelet transform has been applied to detect location and damage severity.
In the previous section, theories required for 2D wavelet transform were persuaded . This section investigates the implementation of this theory to detect damage of the post-tensioned concrete slabs. After the structural analysis of the presented scenarios, the displacement of nodes is saved in a 2D matrix. In fact, each array of the matrix express the displacement values of one of the slab's nodes. The more the number of the slab's nodes are, the bigger the dimensions of the matrix and the more accuracy the approach will be.
Values of details w1 (horizontal), w2 (vertical), w3 (diametric) be determined by applying a proper wavelet function on derived matrix from static analysis of intact and damaged structures. Subsequently, by applying the damage index e for intact and damaged structures and depicted the difference of these values as damage index W
in 3D histogram shape, location and severity of damage in the structure will be identified.
5.1. Adding Noise to Experimental Parameters
In a real test, the measured structural response data involves in deviation. The deviation is expected to have a remarkable effect on damage detection procedure. By producing a small deviation in the measured structural response data, this issue is measured as [13-15]:
ωdr= ωd× (1 + random(−1,1) ×
Noiseω) (13)
where w is the slab deflection, dr denotes a noisy value, and noisew denote deviations of
the extracted deflection data of structure which is equal 3%.
5.2. Identification of Damage Position
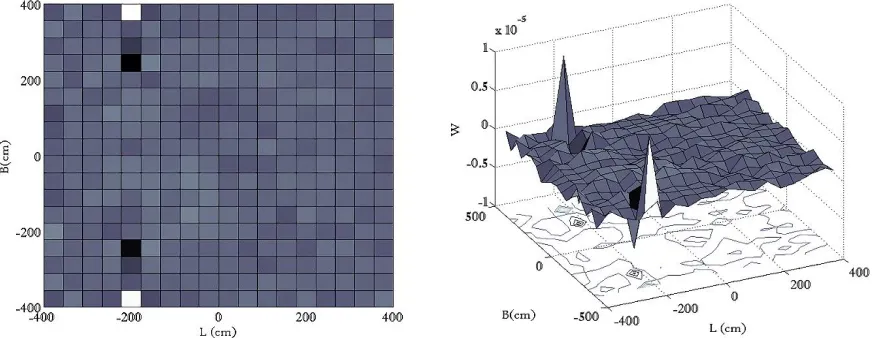
Applying the mentioned approach to detect the structural damage, the damage index is identified with discrete 2D wavelet transform. Figs. 5-14 present capacity of the mentioned approach to detect the damage location in the post-tensioned slab through damage index W.
As illustrated in Fig.5 in the first case of damage identification studies, the cable damage in the post-tensioned slab has been characterized by applying the damage index in the second level of decomposition. The results show that the peak of the damage index W is observed in the start and end position of the damaged cable in the model. In the other cables, the insignificant value of damage has been exhibited after performing wavelet transform. Moreover, the mentioned approach demonstrates the direction of the damaged cable carefully.
In Fig.6, noise added to the deflection data extracted from the finite element model to investigate the ability of 2D wavelet transform to detect damage of the post-tension cable. The direction of the damaged cable is detected. Pursuant to the results of
the damage index W of the second and third scenario cases, it will be obvious that the more the cable damage is, the more the damage index value in the cable location to the first case is.
In the fourth case, two damaged cables with different damage value have been defined in the post-tensioned slab. Damage severity of the first and second cable is 50% and 100%, respectively. As seen in Fig. 11, the damage index can locate damaged cables while the difference in the damage severity also specifies. Fig. 12 shown that 2D wavelet transforms for damage detection with added-noise data, and a little error demonstrates the damage location well.
In the fifth case, three damaged cables have been modeled with 30%, 50%, 100% damage severities. As illustrated in Fig. 13 and 14, the direction of damaged cables is identified.
The results indicate that the approach can greatly perceive single and multiple damage scenarios of the structure in a damage identification phase by applying damage index W, that is, sensitivity to 2D discrete wavelet transform is due to data processing.
Fig. 6 Coefficient result of 2D wavelet details bior2.4 in two levels of decomposition for the SB/30 scenario case with noise using W index.
Fig. 7 Coefficient result of 2D wavelet details bior2,4 in two levels of decomposition for the SB/50 scenario case using W index.
Fig. 9 Coefficient result of 2D wavelet details bior2,4 in two levels of decomposition for the SB/100 scenario case using W index.
Fig. 11 Coefficient result of 2D wavelet details bior2,4 in two levels of decomposition for the SF/50- S2/100 scenario case using W index.
Fig. 12. Coefficient result of 2D wavelet details bior2,4 in two levels of decomposition for the SF/50- S2/100 scenario case with noise using W index.
Fig. 14 Coefficient result of 2D wavelet details bior2,4 in two levels of decomposition for the S1/30- S5/50-SE/100 scenario case with noise using W index.
5.3. Calculation of Damage Severity
To compute the damage severity of the post-tension cables (tendons), an empirical equation has been extracted (Eq. 14). The equation calculates the damage severity through the damage index Wmaxi for cables on the basis of bior2.4 function.
𝐷𝑆
= (109 𝑊
max 𝑖2 + 13362𝑊max 𝑖
+ 0.0315) × 100 ∓ 10%
(14)
Wmaxi= the maximal damage index of the
cable
Ds= damage severity
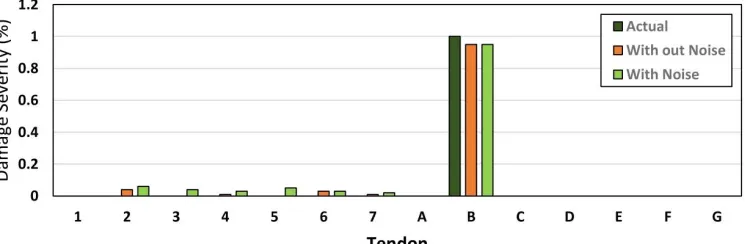
To calculate the damage severity of cables in added noise condition and free-noise condition, the above equation is applied. In Figs.15-19, the damage severity in the actual
condition, the added- noise condition and the noise-free condition can be seen.
Fig. 15. Damage severity of tendons in actual, added-noise, and free noise conditions corresponding to scenario SB/30.
Fig. 16. Damage severity of tendons in actual, added-noise and free noise conditions corresponding to scenario SB/50.
Fig. 17. Damage severity of tendons in actual, added-noise and free noise conditions corresponding to scenario SB/100.
Fig. 19. Damage severity of tendons in actual, added-noise and free noise conditions corresponding to scenario S1/30-S5/50-SE/100
Table 2. The values of computed damage severity of the damage scenarios versus the actual one.
Scenario Actual damage severity
(%) Wmax i
Computed damage value (%)
SB/30 30 9.943E-6 32
SB/50 50 1.606E-5 59
SB/100 100 2.228E-5 95
SF/50-S2/100 50 1.565E-5 59
100 2.194E-5 95
S1/30-S5/50-SE/100
30 1.407E-5 32
50 1.479E-5 59
100 2.106E-5 95
6. Conclusions
6.1. Discussion on Noise-Free Data
The results of the identification of the post-tensioned slab damages indicate that by applying appropriate wavelet function and damage index W, the location of single and multiple damaged cables can be found. By investigation different wavelet functions to identify damages of the post-tensioned slab, it is obvious that function db2 and bior2.4 can locate the damaged cables appropriately.
6.2. Discussion on Added Noise Condition
To actualize measuring deflection of different points of the structure, noise added to the data extracted from the static analysis of the structure. The appropriate wavelet function and the damage index W localize the single and multiple damaged cables with little
errors. By investigation different wavelet functions to identify damage of the structure, function db2 hasn’t introduced the location of damaged cables as well; but function bior2.4 indicates the location of damaged cables with the use of added noise data up to 3%.
6.3. Discussion on Damage Severity of Tendons
To calculate the damage severity of damaged tendons, the damage index Wmax has been
6.4. Conclusion
In this study, 2D wavelet transform has been applied to detect location and severity of damaged cables in the post-tensioned slab with using noise-free data and added noise data. As the study has shown, location and the damage severity of tendons can considerably be identified through performing the appropriate function as well as extracting the appropriate empirical equation.
REFERENCES
[1] Newland, D.E .(1993) .An Introduction to Random Vibrations, Spectral and Wavelet Analysis, third ed. Longman, New York. [2] Sone, A., Yamamoto, S., Nakaoka, A., &
Masuda, A. (1995). Health monitoring system of structures based on orthonormal wavelet transform (No. CONF-950740--). American Society of Mechanical Engineers, New York, NY (United States). [3] Liu, F., Cheng, J., Xu, J., & Wang, X. )1997(.
Wavelet based adaptive equalization algorithm. Global Telecommunications Conference, GLOBECOM'97., IEEE. Vol. 3. IEEE.
[4] Fan, W., and Qiao, P. (2011). Vibration-based damage identification methods: a review and comparative study. Structural Health Monitoring 10.1: 83-111..
[5] Rucka, M. (2011). Damage detection in beams using wavelet transform on higher vibration modes, Journal of theoretical and applied mechanics, 49(2), pp: 399-417. [6] Solís, M., M. Algaba, and P. Galvín. (2013).
Continuous wavelet analysis of mode shapes differences for damage detection, Mechanical Systems and Signal Processing, 40(2), pp: 645-666.
[7] Bagheri, G., Ghodrari Amiri, G., Seyed Razzaghi, S.A. (2009). “Vibration-Based Damage Identification of plates structure
via curvlet transform”.Journal of Sound and Vibration , Vol . 327 , PP. 593-603. [8] Li, Y., Xu, M., Wei, Y., & Huang, W. (2015).
An improvement EMD method based on the optimized rational Hermite interpolation approach and its application to gear fault diagnosis. Measurement, 63, 330-345.
[9] Li, Y., Xu, M., Wang, R., & Huang, W. (2016). A fault diagnosis scheme for rolling bearing based on local mean decomposition and improved multiscale fuzzy entropy. Journal of Sound and Vibration, 360, 277-299.
[10] Naderpour, H., & Fakharian, P. (2016). A synthesis of peak picking method and wavelet packet transform for structural modal identification. KSCE Journal of Civil Engineering, 7(20), 2859-2867. [11] Abbasi, A., Hoseini Vaez, S.R., Ghodrati
Amiri, G. (2017), “Damage Detection of Steel Plate Shear Walls by Wavelet Transform” Journal of Ferdowsi Civil Engineering, Vol.29, No. 2.
[12] Mallat S.G. (1999) A Wavelet tour of signal processing. 2nd ed, 1999, London: Academic press.
[13] Kaveh A, Hoseini Vaez SR, Hosseini P, Fallah N. (2016) Detection of damage in truss structures using Simplified Dolphin Echolocation algorithm based on modal data. SMART STRUCTURES AND SYSTEMS. Vol. 18, No. 5, pp. 983-1004. [14] Hoseini Vaez, S.R. and T. Arefzade, (2017)
Vibration-based damage detection of concrete gravity dam monolith via wavelet transform. Journal of Vibroengineering, Vol. 19, Issue 1, pp. 204‑213.