DOI: 10.22075/JRCE.2018.12887.1228
journal homepage: http://civiljournal.semnan.ac.ir/
Effect of the Frequency Content of Earthquake
Excitation on Damage Detection in Steel Frames
S.R. Hoseini Vaez1* and S.S. Tabaei Aghdaei1
1. Department of Civil Engineering, University of Qom, Qom. Iran.
Corresponding author: [email protected]
ARTICLE INFO ABSTRACT
Article history:
Received: 27 October 2017 Accepted: 05 February 2018
In this article, the effect of earthquake frequency content and noise effects on damage detection is inspected. For this purpose, the damage was defined as nonlinear behavior of beams and columns, and several ground motion records were scaled so that some elements yield under the applied excitation. Consequently, the acceleration response data of each floor obtained through the nonlinear dynamic analysis. Using the discrete wavelet analysis, the occurrence and time of damage in a frame can be detected based on the spikes appearing in the wavelet details plots acquired from discrete wavelet decomposition. The mean period (Tm) was utilized
to compute the frequency content of earthquakes. The implications of this parameter for the analyses with dissimilar ground motion records were investigated and the results indicates that the records with low Tm are more
suitable for structural damage detection. In order to examine the effect of noise or measurement errors on damage detection process, the discrete wavelet analysis was repeated with a noise introduced to the acceleration response data.
Keywords: Damage Detection, Frequency Content, Wavelet Transform, Steel Frames.
1. Introduction
Throughout the beneficial life of a building, it must endure a wide variety of damages caused by seismic loads, environmental conditions, fatigue, and cumulative crack propagation. The majority of such damages can be controlled through regular safety inspections followed by appropriate repair and maintenance operations to prevent the
Monitoring (SHM) is a process for acquiring accurate real-time information about the structural performance and conditions. Damage detection is also essential for structural safety, because an early detection of damage can prevent catastrophic structural failures in the future. SHM is founded upon the simple idea that the dynamic properties of a structure are a function of its physical properties. Thus, any damage-induced change in these physical properties (such as mass, stiffness, etc.) can change the dynamic properties (such as natural frequencies, damping ratio, and mode shapes) of the structure. As a result, structural damage can be detected by the study of vibration responses of the structure.
In many cases, the benedicial information of a signal lies in its frequency content, also referred to as signal spectrum. Put it differently , the spectrum of a signal represents its frequency content. On that account, the existence of appropriate means to measure the signal frequency content is of vital importance. One such means is the mathematical transformations. Applying the mathematical transformations, one can transform signals from time domain to other domains, such as frequency domain, so as to extract information concealed in the frequency content [1].
At present, the most popular signal analysis method is the wavelet transform. This transform has particular advantage over traditional methods in the analysis of signals with sudden spikes and discontinuities. The wavelet transforms can reveal a large amount of concealed signal information that is beyond the reach of other signal analysis
methods. The primary varieties of wavelet transform include the continuous wavelet transform (CWT), discrete wavelet transform (DWT), and static wavelet transform (SWT) [2].
Several studies exist on the detection and location of damages in structures by wavelet transform, some of which are mentioned here as well. In a study performed by Rathje et al. (1998), they examined 306 seismic records of 20 earthquakes and discovered that the parameter Tp induces the most uncertainty in
the forecast of earthquake’s frequency content and the best parameter for this purpose is Tm [3].
Ovanesova and Suarez (2004) examined the structural response at possible damage locations and were able to accurately estimate the damage location applying the wavelet transform [4].
In a study conducted by Goggins et al. (2007), they inspected the seismic response of braced frames and managed in order to acquire the frame’s buckling and yield points through wavelet analysis and measurement of floor and ground accelerations [5].
the damage as a thickness reduction of desired length and depth, and were able to apply mode shapes and discrete wavelet transform in order to detect damage in the plates [8]. Young Noh et al. (2011) examined three wavelet-based damage-sensitive features and then introduced three suitable wavelet functions for damage detection [9]. Bagheri and Kourehli (2013) developed a method for detection of earthquake-induced damage using the discrete wavelet analysis [10]. In a study conducted by Vafaei and Adnan (2014), they utilized a method based on discrete and continuous wavelet analyses to locate damage in an airport control tower [11]. Ezoddin et al. (2015) managed to apply the discrete wavelet to locate the cracks in concrete beams [12].
Foladghadam and Ghafouri (2015) used the wavelet analysis to detect the damage in a simply supported beam, a simple two-dimensional frame, and a suspended cable bridge [13]. In a study performed by Arefzade et al. (2016), they investigated the utility of the wavelet transform for location of multiple cracks in a cantilever RC beam. This study revealed that damage estimates obtained from the discrete wavelet transform are more accurate than those given by the continuous wavelet transform [14]. Patel et al. (2016) employed a new wavelet transform based techniques for damage location in concrete structures [15]. Chatterjee and Vaidya (2016) extracted the acceleration response of a damaged beam and applied the wavelet analysis to predict the crack depth and location in this element [16]. In a study performed by Hatzigeorgiou and Pnevmatikos (2017), they have examined the nonlinear behavior of frame structures under
seismic excitation, and used the discrete wavelet analysis to estimate the damage time and location [17].
The above review of literature clearly show the ability of the wavelet transform to facilitate the analysis of dynamic response of damaged structures under external excitations, and therefore its potential as a damage detection instrument. In the present study, the nonlinear behaviors of structural elements were incorporated into the analyses performed using the (nonlinear) bilinear hysteretic model. For the nonlinear time-history analysis, the steel frames were modeled in SAP2000 and then subjected to several ground motion records. Then, the extracted floor acceleration responses were processed using the wavelet transform to detect the time of damage. Additionally, the effect of earthquake frequency content and noise effects on damage detection investigated.
2. Wavelet Transform Theory
2.1. Continuous Wavelet Transform (CWT)
For a signal in time domain, the CWT is defined as:
A CWT produces the coefficient C a b( , ) (for
different scales and positions) and*( )x ,
which is the complex conjugate of wavelet basis function. As is clear, Eq. (1) is the inner product of the signal and the mother wavelet function. The mother wavelet is defined as Eq. (2):
Parameters a and b denote the translation and scale parameters respectively. In this context, translation means delaying the wavelet and scaling refers to the act of expanding or shrinking the signal (like a mathematical operator). In fact, the wavelet analysis can be described as a measure of similarity between the signal and the basis functions (wavelets). Because of the change in the scale parameter, which modifies the frequency domain of the wavelet basis functions, signal analysis needs to be performed at several different frequencies. As a result, the parameters a and
b must be changed to acquire a series of wavelet coefficients, which can then be analyzed to extract signal features such as damage indicators, etc. [18].
2.2. Discrete Wavelet Transform (DWT)
In the DWT, the wavelet coefficients are obtained at signal discontinuities, and scale and translation parameters transform into Eq. (3):
0 0
0 0
, 1
. , 0, ,
m
m
a a a
b n b b m n z
(3)
Accordingly, the wavelet basis function is:
2
, ( ) 0 . ( 0 0)
m m
m n x a a x nb
(4)
The signal ( )f x is expressed with:
, ,
( ) ( , ). ( )
m n m n z
f x c m n x
(5)In Eq. (5), c m n( , )denotes the wavelet
coefficients. In the DWT, signal is subjected to low-pass and high-pass filters, which decompose the wavelet coefficients into the approximation coefficients and the detail coefficients respectively. Thus, the equivalent of the signal is presented as follow:
( ) ( ) ( )
n n
f x A x
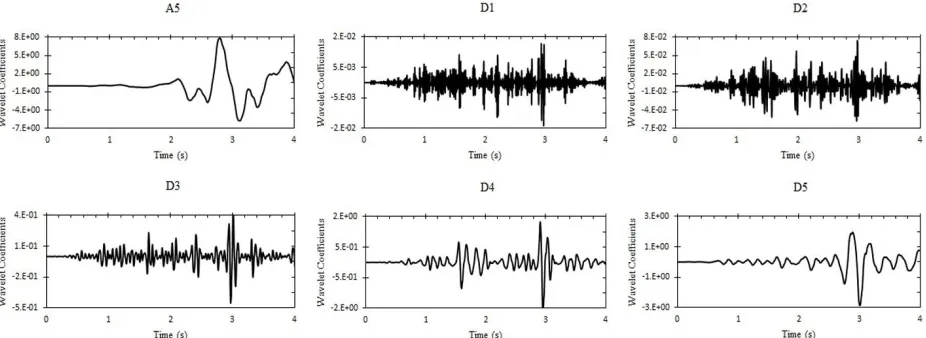
D x (6)In Eq. (6), n is the DWT decomposition level. Pursuant to the above relations, the DWT divides the signal into two parts: the part produced by the passage of signal through the high-pass filter contains high frequency information such as noise and discontinuities and is called the details; and the part produced by the passage of signal through the low-pass filter contains low frequency information and signal identity features and is called the approximations [19].
In this study, structural damage is represented by the spikes appearing in the details of the discrete wavelet analysis following the formation of plastic hinges in the elements. Moreover, the effect of the wavelet transform (1)
*
1
( , ) ( ). (x b)
C a b f x dx
a a
(2) 1( )x (x b)
a a
on damage detection depends on the choice of wavelet function.
3. Effect of Excitation Frequency
Content on Damage Detection
3.1. Damage Model
As presented in Fig. (1), when a structure gets subjected to an earthquake, the relationship between the base shear force and the displacement of the roof’s center of mass becomes nonlinear. If earthquake excitation is strong enough to cause displacements beyond the yield point ( )
y
, the resulting
damage will manifest as major deformation, and the rotation of the elements will be easily detectable in visual inspections. When earthquake excitation is small however, structural behavior will remain below the yield point and in the elastic region. In such cases, there will be no detectable permanent deformation and the structure will remain undamaged. In the cases where structural behavior is on the edge of aforementioned conditions, i.e., when applied load is only slightly beyond the yield point, the structure will sustain small undetectable damages, which will be difficult to detect through visual inspection, especially when the elements are concealed or difficult to access.
In this study, FEMA 356 has been applied to define the structural elements for plastic hinges then the time history analysis is executed on the frame and the construct responses are extracted. Depending the earthquake scale, some elements may develop plastic hinges (damage). The emergence of plastic hinges changes the system frequency, and this causes an
alteration in the frequency of the response signal. As a result of this alteration, there will be some visible disturbances in the wavelet transform results. Thus, the appearance of spikes in the wavelet details reveals that a structural element related to the corresponding floor has experienced a load beyond its yield point and has sustained some damage. The time of these spikes in the wavelet details will indicate the time at which this damage has occurred. The absence of any visible disturbance in the wavelet details suggests the absence of any damage in the structural elements of the corresponding floor, indicating that they have remained in the elastic region.
Fig. 1. Plot of base shear vs. roof story displacement [20,21,22]
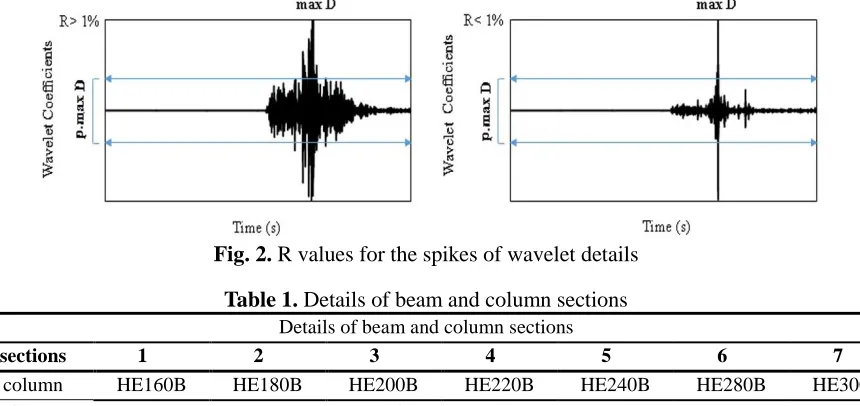
judge whether any damage has occurred in the structure is required. In this method, the changes in wavelet signal are evaluated though the estimation of the percentage of the details signal values that exceed a specific ratio of the maximum absolute value (max D). For this purpose, first, the maximum absolute value (max D) for the details signal must be computed. Consequently, the ratio p, (p.max D, p <1) of this value must be determined, and finally the parameter R must be obtained. This parameter is the number of times (percent) that the spikes of the wavelet details exceed the mentioned ratio of maximum absolute value (p.max D). A small enough R value (R <1%) indicates the presence of significant spikes in the wavelet details, and larger R values (R>% 1) reveal the absence of such spikes and therefore the absence of any damage in the structure. Hatzigeorgiou and Pnevmatikos have proposed the P ratio of 0.1 for this approach which is contemplated to P
to 0.1 in relation to Fig. 2 and calculated the R value for each case accordingly [17].
3.2. Numerical Study
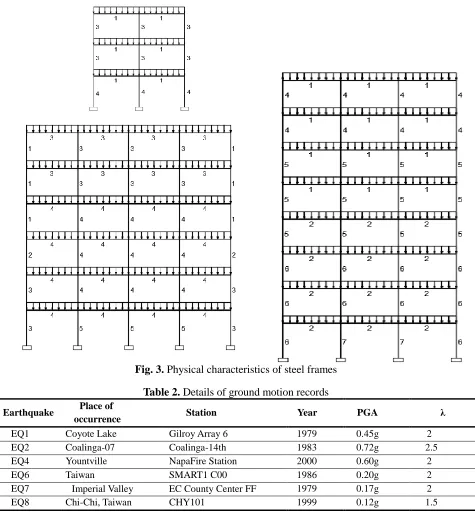
This section is dedicated to the evaluation of the performance of the described method in the structural damage detection. For this purpose, three steel frames examined with physical characteristics depicted in Fig. (3) and cross sectional details listed in Table (1). It was assumed that: all frames are made of S355 steel and have 4-meter spans; all stories have a height of 3 meters; and beams are subjected to dead and live loads of 23.536kN/m and 7.8453 kN/m, respectively. SAP2000 applied to model and analyze these steel frames under ground motion records listed in Table (2). After the nonlinear time history analysis, the acceleration response of the floors was extracted and subjected to discrete wavelet analysis at five decomposition levels in MATLAB. The analyses were performed using the wavelets db4, coif5 and bior6.8.
Fig. 2. R values for the spikes of wavelet details
Table 1. Details of beam and column sections
Details of beam and column sections
7 6
5 4
3 2
1 sections
HE300B HE280B
HE240B HE220B
HE200B HE180B
HE160B column
IPE270 IPE240
IPE220 IPE200
Fig. 3. Physical characteristics of steel frames
Table 2. Details of ground motion records
λ PGA
Year Station
Place of occurrence Earthquake
2 0.45g
1979 Gilroy Array 6
Coyote Lake EQ1
2.5 0.72g
1983 Coalinga-14th
Coalinga-07 EQ2
2 0.60g
2000 NapaFire Station
Yountville EQ4
2 0.20g
1986 SMART1 C00
Taiwan EQ6
2 0.17g
1979 EC County Center FF
Imperial Valley EQ7
1.5 0.12g
1999 CHY101
Chi-Chi, Taiwan EQ8
3.2.1. Damage Detection in 2-Span 3-Story Frame
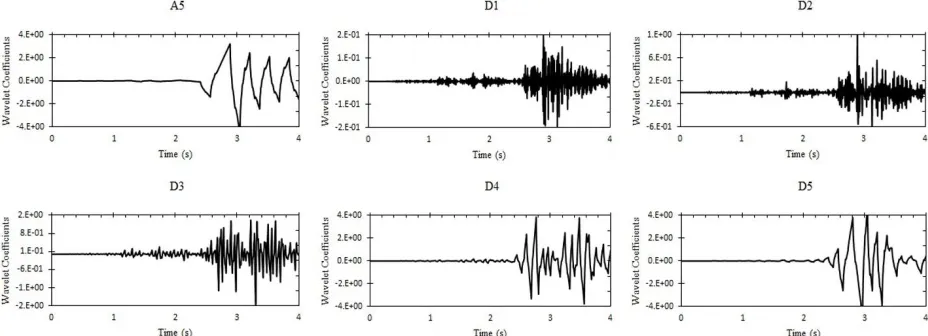
After subjecting the 2-story frame to the Gilroy Array 6 station record of the Coyote Lake earthquake, linear behavior without any plastic hinge observed. The acceleration of
Fig. 4. Plots of wavelet approximation and details at five decomposition levels; the original Coyote Lake record
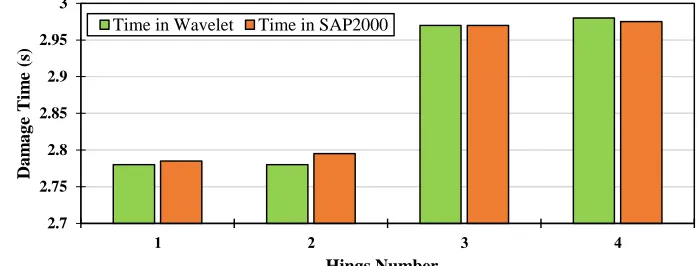
The scale (λ) of the applied ground motion record was consequently increased, and thenagain, the acceleration of the second floor was extracted and subjected to a discrete wavelet analysis to examine the formation of plastic hinges. Under the new condition, four hinges appeared in the frame’s second floor at the times t=2.785, t=2.795, t=2.97 and t=2.975 seconds, in that order. Figure (5) illustrates the hinge formation (HF) times approximated in SAP2000 and MATLAB. The plots of wavelet decomposition at five levels (Fig. 6) also operate the accuracy of the hinge formation times in the first level wavelet decomposition. A similar analysis was performed on the same frame under the SMART1 C00 station record of Taiwan
Fig. 5. Plot of hinge formation time under the Coyote Lake earthquake record
Fig. 6. Plots of wavelet approximation and details at five decomposition levels; the scaled Coyote Lake record
Fig. 7. Plots of wavelet approximation and details at five decomposition levels; the original Taiwan record
2.7 2.75 2.8 2.85 2.9 2.95 3
1 2 3 4
Da
m
a
g
e
Tim
e
(s)
Hings Number
Fig. 8. (. Plots of wavelet approximation and details at five decomposition levels; the scaled Taiwan record
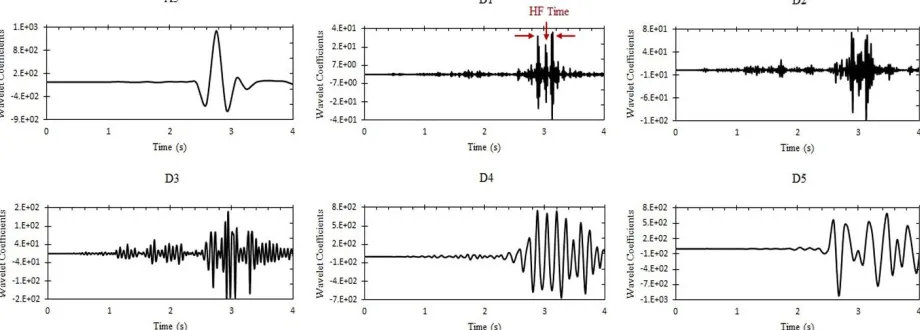
3.2.2. Damage Detection in 3-Span 8-Story Frame
To analyze the 3-span 8-story frame, it was subjected to two records: Coalinga-14th station record of Coalinga-07 earthquake, and CHY101 station record of Chi-Chi-Taiwan earthquake. Under the Coalinga-07
earthquake record, the frame remained in the linear region and reported no plastic hinge formation. The acceleration signal of the fifth floor was extracted and subjected to discrete wavelet analysis at five decomposition levels. The results of this analysis are presented in Fig. (9).
Fig. 9. Plots of wavelet approximation and details at five decomposition levels; the original Coalinga-07 record
After increasing the scale of the earthquake record, the emergence of plastic hinges in the frame observed. After extraction of the acceleration response and discrete wavelet analysis, the spikes in the first-level wavelet details were clearly evident. Six hinges were formed in the beams of the fifth floor. The
acceleration response is portrayed in Fig. (10). The first-level wavelet decomposition presented in Fig. (11) also demonstrates the
accuracy of the times. The R value calculated in this analysis is 1%.
Fig. 10. Plot of hinge formation time under the Coalinga-07 earthquake record
Fig. 11. Plots of wavelet approximation and details at five decomposition levels; the scaled Coalinga-07 record
The same frame was analyzed under the CHY101 station record of Chi-Chi-Taiwan earthquake. The frame entered the non-linear region and the plastic hinges appeared only after scaling the earthquake record. The acceleration response of the second floor was extracted and subjected to discrete wavelet analysis. In this analysis, the first hinge in the beam of the second floor appeared at
t=25.735 seconds, the second and third hinges emerged at t=25.745 seconds, the fourth hinge appeared at t=27.07 seconds, and the last two hinges emerged at t=27.085 seconds. Figure (12) indicates no spike corresponding to the time of hinge formation. The R value computed in this analysis is 31%.
2.8 2.85 2.9 2.95 3 3.05 3.1 3.15 3.2
1 2 3 4 5 6
Da
m
a
g
e
Tim
e
(s)
Hings Number
Fig. 12. Plots of wavelet approximation and details at five decomposition levels; the scaled Chi-Chi, Taiwan record
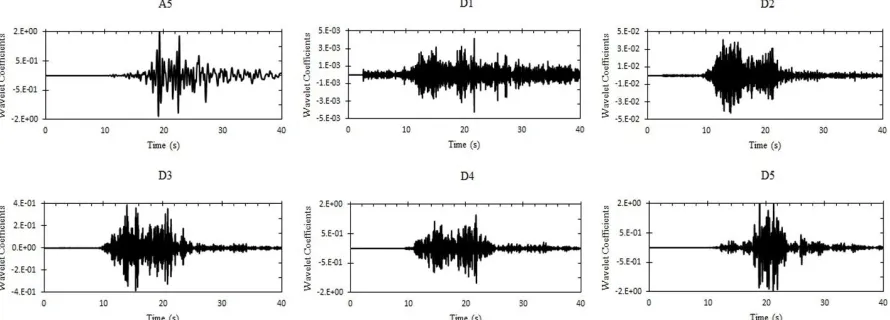
3.2.3. Damage Detection in 4-Span 6-Story Frame
This frame was subjected to two ground motion recodes as well: The NapaFire station record of Yountville earthquake, and the EC County Center FF station record of Imperial Valley earthquake. Under the Yountville earthquake record, as the earthquake scale increased, the frame entered the nonlinear region and eight plastic hinges appeared in the beams of the fifth floor. In this analysis, the first two hinges appeared at t=13.41 seconds, the third hinge at t=13.415 seconds,
the fourth hinge at t=13.425 seconds, the fifth and sixth hinges at t=13.735 seconds, and the last two hinges appeared at t=13.75 seconds. Figure (13) portrayed the hinge formation times acquired from SAP2000 and MATLAB. The repeated hinge formation at intervals of less than 0.01 second causes sharp frequency variations. As shown in Fig. (14), the greatest spike was observed at t=13.75, when the hinge entered the IO region. The R value calculated in this analysis is 0.3%.
Fig. 13. Plot of hinge formation time under the Yountville earthquake record Under the Imperial Valley earthquake record,
when the earthquake scale increased, four plastic hinges appeared in the beams of the second floor. Here, the first hinge appeared at t=6.54 seconds and all three subsequent
hinges emerged at t=6.545 seconds. As presented in Fig. (15), the first level wavelet details corresponding to this analysis reveal no noticeable spike. The R value calculated for this record is 16%.
13.2 13.3 13.4 13.5 13.6 13.7 13.8
1 2 3 4 5 6 7 8
Da
m
a
g
e
Tim
e
(s)
Hings Number
Fig. 14. Plots of wavelet approximation and details at five decomposition levels; the scaled Yountville record
Fig. 15. Plots of wavelet approximation and details at five decomposition levels; the scaled Imperial Valley record
3.3. Frequency Content Parameters
One of the essential steps in the seismic response analysis is the selection of the input ground motion. The primary features of a strong ground motion are intensity, duration, and frequency content. There several frequency content parameters available for such analyses. The dominant period (T0) is
among the parameters most commonly applied for this purpose. This parameter represents the period in which the acceleration response spectrum reaches its maximum value. Another parameter of high importance in this regard is the normalized
dominant spectral period (T0), which give an
average of the periods in the acceleration response spectrum with each period weighted by the natural logarithm of the spectral acceleration at that period. The parameter used in this study is the mean period (Tm). In
2 2 1 .( ) i i i m i i C f T C
(7)for
0.25 20
i
f
Hz
Where
i
C denotes the Fourier amplitudes of
the entire record, and
i
f denotes the
frequencies of discrete Fourier transform, which is between 0.25 and 20 Hz. The Fourier amplitude is defined as the square root of the sum of squares of the real and imaginary parts of the Fourier coefficient.
m T
is acquired in the same way as the mean
square frequency, but with( ) i
f replaced with
1 ( )
i
f [3]. For the above-mentioned ground
motion records, this parameter was calculated to the values presented in Table (3). As it can be observed, in the records
where damage is clearly visible,
m
T is less
than 1 second, but the records with undetectable damage have a
m
T value of
greater than 1 second. Thus, structural damage detection must be performed applying the ground motion records with
m T
<1 second.
Table 3. Tm calculated for different ground motion records
( ) m T s Record ( ) m T s Record 1.168 Taiwan 0.634 Coyote Lake 1.162 Imperial Valley 0.320 Coalinga-07 1.319 Chi chi,Taiwan 0.487 Yountville
5. Effect of Noise on Damage
Detection
In the previous examples, response data were obtained from the software, with full neglect of noise effect. In practice and in experimental tests, the presence of environmental and measurement errors is unavoidable. Thus, In order to perceive the effect of noise or measurement errors on the damage detection process, a noise expressed with Eq. (8) was added to the acceleration response signal, which was then subjected to a discrete wavelet analysis [24-30].
, (1 ( 1,1)
r
ijd i jd random Noise
(8)
In Eq. (8),
r
d represents the magnitude of
noise and Noise
Fig. 16. Plots of wavelet approximation and details at five decomposition levels; the scaled Coyote Lake record with 1% noise
Fig. 17. Plots of wavelet approximation and details at seven decomposition levels; the scaled Coyote Lake record with 3% noise
It is clear that after applying 1% noise and decomposing the signal to the fifth level, damage time cannot be easily detected. Moreover, It is impossible to determine the damage time in the presence of 3% noise after decomposing the signal at higher levels. Thus, this approach is very sensitive to environmental errors, and the presence of such noise will make the structural damage detection extremely difficult.
6. Conclusion
In the present study, the effect of earthquake frequency content on the process of structural damage detection was inspected with the help of the mean period parameter (Tm). It
was found that damage detection is best to be performed applying the records with Tm of
instrument. Furthermore, the choice of mother wavelet function and decomposition levels in discrete wavelet analysis can affect the accuracy and performance of damage detection approach. To investigate the effect of noise or measurement errors on the damage detection process, discrete wavelet analysis was repeated with a noise introduced to the acceleration response data. This analysis revealed that because of the sensitivity of the signal processing method to environmental errors, the presence of noise will make the structural damage detection extremely difficult.
References
[1] Naderpour, H., Sharbatdar, M.K., Khademian, F. (2017). "Damage Detection of Reinforced Concrete Shear Walls Using Mathematical Transformations", JSCE Journal of Civil Engineering, Vol. 3, Issue. 4, pp: 79-96.
[2] Lotfollahi Yaghin , M.A., Kuhdargh, M. (2011). "Investigating the Effect of Continuous Wavelet Transformation on Detecting Crack Specifications", KSCE Journal of Civil Engineering, Vol. 10, Issue. 3, pp: 1-6.
[3] Rathje, E.M., Abrahamson, N.A., Bray, J.D. (1998). "Simplified frequency content estimates of earthquake ground motions", Journal of Geotechnical and Geoenvironmental Engineering, Vol. 124, Issue. 2, pp: 150-159.
[4] Ovanesova, A., Suarez, L. (2004). "Applications of wavelet transforms to damage detection in frame structures", Engineering structures, Vol. 26, Issue. 1, pp: 39-49.
[5] Goggins, J., Broderick, B.M., Basu, B., Elghazouli, A.Y. (2007). "Investigation of the seismic response of braced frames using wavelet analysis", Structural Control and Health Monitoring, Vol. 14, Issue. 4, pp: 627-648.
[6] Khatam, H., Golafshani, A.A., Beheshti-Aval, S., Noori, M. (2007). "Harmonic class loading for damage identification in beams using wavelet analysis", Structural Health Monitoring, Vol. 6, Issue. 1, pp: 67-80. [7] Yan, G., Duan, Z., Ou, J., De Stefano, A.
(2010). "Structural damage detection using residual forces based on wavelet transform", Mechanical Systems and Signal Processing, Vol. 24, Issue. 1, pp: 224-239.
[8] Ghodrati Amiri, G.G., Bagheri, A., Razzaghi, S.S., Asadi, A., "Structural damage detection in plates using wavelet transform," ISBN 978-0-415-56809-82010.
[9] Young Noh, H., Krishnan Nair, K., Lignos, D.G., Kiremidjian, A.S. (2011). "Use of wavelet-based damage-sensitive features for structural damage diagnosis using strong motion data", Journal of Structural Engineering, Vol. 137, Issue. 10, pp: 1215-1228.
[10] Bagheri, A.,Kourehli, S. (2013). "Damage detection of structures under earthquake excitation using discrete wavelet analysis", Asian Journal of civil engineering (BHRC), Vol. 14, Issue. 2, pp: 289-304. [11] Vafaei, M., Adnan, A.b. (2014). "Seismic
damage detection of tall airport traffic control towers using wavelet analysis", Structure and Infrastructure Engineering, Vol. 10, Issue. 1, pp: 106-127.
[12] Ezzodin, A., Naderpour, H., Kheyroddin, A., Ghodrati Amiri, Gh. (2017). "Damage Localization and Quantification of Beams Using Wavelet Transform", Journal of Modeling in Engineering, Vol. 39, Issue. 12, pp: 1-11.
[13] Foladghadam, Y., Ghafouri, H.R. (2015). "Damage Detection in Structures by Wavelet Analaysis using Modal Analysis Data", journal of civil Engineering, Vol. 2/31, Issue. 2/1, pp: 111-121.
analysis", JSCE Journal of Civil Engineering, Vol. 3, Issue. 6, pp: 72-84. [15] Patel, S., Chourasia, A., Panigrahi, S.,
Parashar, J., Parvez, N., Kumar, M. (2016). "Damage Identification of RC Structures Using Wavelet Transformation", Procedia Engineering, Vol. 144, pp: 336-342. [16] Vaidya, T.,Chatterjee, A. (2016). "Wavelet
Analysis of Acceleration Response of Beam Under the Moving Mass for Damage Assessment", Journal of The Institution of Engineers (India): Series C, Vol. 2, Issue. 97, pp: 209-221.
[17] Pnevmatikos, N.G.,Hatzigeorgiou, G.D. (2017). "Damage detection of framed structures subjected to earthquake excitation using discrete wavelet analysis", Bulletin of Earthquake Engineering, Vol. 15, Issue. 1, pp: 227-248.
[18] Bisht, S. (2005). "Methods for structural health monitoring and damage detection of civil and mechanical systems", Master thesis, the Virginia Polytechnic Institute and State University, Blacksburg, Virginia. [19] Al-Khalidy, A.A. (2003). "Health monitoring of dynamic systems using wavelet analysis",
[20] Sivandi-Pour, A., Gerami, M., Kheyroddin, A. (2015). "Determination of modal damping ratios for non-classically damped rehabilitated steel structures", Iranian Journal of Science and Technology. Transactions of Civil Engineering, Vol. 39, Issue. C1, p. 81.
[21] Sivandi-Pour, A., Gerami, M., Kheyroddin, A. (2016). "Uniform damping ratio for non-classically damped hybrid steel concrete structures", International Journal of Civil Engineering, Vol. 14, Issue. 1, pp: 1-11.
[22] Gerami, M., Sharbati, Y., Sivandi-Pour, A. (2013). "Nonlinear seismic vulnerability evaluation of irregular steel buildings with cumulative damage indices", International Journal of Advanced Structural Engineering, Vol. 5, Issue. 1, p. 9.
[23] Schnabel, P.B. (1973). "Effects of local geology and distance from source on
earthquake ground motions", University of California, Berkeley.
[24] Hoseini Vaez, S.R., Arefzade, T. (2017) "Vibration-based damage detection of concrete gravity dam monolith via wavelet transform". Journal of Vibroengineering, Vol. 19, Issue 1, pp. 204‑213.
[25] Naderpour, H., Fakharian, P. (2016). "A synthesis of peak picking method and wavelet packet transform for structural modal identification", KSCE Journal of Civil Engineering, Vol. 20, Issue. 7, pp: 2859-2867.
[26] Kaveh, A., Hoseini Vaez, S.R., Hosseini, P., Fallah, N. (2016). "Detection of damagein truss structures using Simplified Dolphin Echolocation algorithm based on modal data", SMART STRUCTURES AND SYSTEMS. Vol. 18, No. 5, pp. 983-1004. [27] Hoseini Vaez, S.R., Fallah, N. (2017)
"Damage Detection of Thin Plates Using GA-PSO Algorithm Based on Modal Data". Arabian Journal for Science and Engineering, Vol. 42, Issue 3, pp. 1251‑1263.
[28] Hoseini Vaez, S.R., Dehghani, E., Babaei, V. (2017) " Damage Detection in Post-tensioned Slab Using 2D Wavelet Transforms ". Journal of Rehabilitation in civil Engineering, Vol. 42, Issue 3, pp. 1251‑1263.
[29] Abbasi, A., Hoseini Vaez, S.R., Ghodrati Amiri, G. (2017), “Damage Detection of Steel Plate Shear Walls by Wavelet Transform” Journal of Ferdowsi Civil Engineering, Vol.29, No. 2.
![Fig. 1. Plot of base shear vs. roof story displacement [20,21,22]](https://thumb-us.123doks.com/thumbv2/123dok_us/8957656.1867024/5.612.323.541.333.533/fig-plot-base-shear-vs-roof-story-displacement.webp)