D
D
E
E
T
T
E
E
C
C
T
T
I
I
O
O
N
N
O
O
F
F
K
K
-
-
U
U
P
P
P
P
E
E
R
R
O
O
U
U
T
T
L
L
I
I
E
E
R
R
S
S
I
I
N
N
E
E
X
X
P
P
O
O
N
N
E
E
N
N
T
T
I
I
A
A
L
L
S
S
A
A
M
M
P
P
L
L
E
E
S
S
U
U
S
S
I
I
N
N
G
G
M
M
U
U
L
L
T
T
I
I
P
P
L
L
E
E
U
U
P
P
P
P
E
E
R
R
O
O
U
U
T
T
L
L
I
I
E
E
R
R
T
T
E
E
S
S
T
T
S
S
R
Re
em
mi
i
J
Ju
ul
li
iu
us
s
D
Da
ar
re
e
11,
,
O
Ol
lu
um
mi
id
de
e
S
Su
un
nd
da
ay
y
A
Ad
de
es
si
in
na
a
22,
,
O
Ol
lu
ud
do
ol
la
ap
po
o
K
Ke
eh
hi
in
nd
de
e
F
Fa
am
mu
ur
re
ew
wa
a
11,
,O
Ow
wo
os
se
en
ni
i
T
Ti
im
mo
ot
th
hy
y
111
Department of Mathematical Sciences, Kings University, Odeomu, Nigeria
2
Department of Mathematical Sciences, Olabisi Onabanjo University, Nigeria
Corresponding Author: Remi Julius Dare, [email protected]
ABSTRACT: Outlying values have been an issue of concern to researchers and data analysts. The study of multiple outliers is imperative because outlying values may lead to model misspecification, wrong estimation of parameters and incorrect statistical results. This paper proposed Tietjien-Moore test statistics for upper outliers in exponential samples. A simulated study was carried to investigate the strength of the test statistics.
KEYWORDS: Outlier, Exponential distribution, Tietjen-Moore test, Gap test, Simulation
1. INTRODUCTION
Talking about study on outliers [W+02] and [LK12] made distinct contributions stating that, in data analysis, variables are being recorded or sampled without prior investigation into possible outlying values. One of the ways of obtaining a coherent statistical analysis is to carry out statistical investigations on the detection of outlying observations. Although outliers are often considered as an error or noise, they may carry important information. When outliers are not detected, it poses a challenge which results in aberrant data that ultimately lead to model misspecification, biased parameter estimation and wrong results. It is therefore important to identify them prior to modeling to avoid statistical errors.
[BL94] provided a detailed introduction to different ways of describing outliers. An exact definition of an outlier often depends on hidden assumptions regarding the data structure and the applied detection method. Yet, some definitions are regarded general enough to cope with various types of data and methods. [H+92] defines an outlier as an observation that deviates so much from other observations as to arouse suspicion that it was generated by a different mechanism. [BL94] point out that an outlying observation, or outlier, is one that appears to deviate markedly from other members of the sample in which it occurs, similarly, [DG93] defines an outlier as an observation in a dataset which appears to be inconsistent with the remainder of that set of data.
[BL94] submitted that Outlier detection methods have been suggested for numerous applications, such as credit card fraud detection, clinical trials, voting irregularity analysis, data cleansing, network intrusion, severe weather prediction, geographic information systems, athlete performance analysis, and other data-mining tasks. This submission was further established by [H+92], [BL94], [RW95], [FP97], [AR04] and [LK12] proposed Gap family test for testing k-upper outlier, and little works have been done in recent times on k-upper outlier detection. This study proposed Tietjien-Moore statistics for checking k-upper outlier in exponential samples and access the performance of the proposed test with that of the one proposed by [LK12]. Next section is Material and Methods, followed by Simulation Study, then section 4 is the discussion, and paper was concluded in section 5.
2. MATERIALS AND METHODS
2.1 Dixson test Statistic for Upper-Outlier Detection
Dickson type test statistic for k-upper outlier is stated below:
(1)
A large value of the test statistic signifies the presence of k-upper outliers in the sample.
2.2 Zerbet and Nikulin Test for Outlier
Zerbet and Nikulin also proposed a test statistic for identifying outliers as follows:
(2)
2.3 Maximum likelihood ratio test
One of the popular test statistics is also used for testing upper outliers is the maximum likelihood ratio test given by
(3)
If
L
k is greater than specified value, the test indicates the presence of outliers.2.4 Gap-test statistic
The test statistic for k-upper outliers may be defined as:
(4)
A very high value of
Z
k indicates the presence of k upper outliers in the sample. Therefore, the null hypothesis is rejected for , where is the critical value at α level of significance.The exact null distribution
Z
k for is rather complex. However, the critical values of test for are found to be very close to:
(5)
For k-upper outliers, the test statistic may be defined as:
(6)
We use 5% level of significance for while 1% level of significant for respectively.
2.5 Tietjen-Moore test statistics
The following steps are considered for Tietjen-Moore test statistic:
(i) Data sorting from smallest to the largest
(7)
(7) is test statistics for the largest point. Where test statistics for k-smallest point is
(8)
To test outlier in both tails, we compute the absolute residuals and then Ek denote the sorted absolute
residuals.
The test statistics for the case is:
(9)
2.6 Critical values
It is interesting to see that the simulated critical values for Tietjen-Moore test statistic in this paper are obtained using r-software at two levels of significance. Simulated Critical values of Gap-test statistic are obtained from the formula (6) given above without tables.
2.7 Test hypothesis
A discordance test needs to be performed in order to identify outliers. Let be a random sample from an exponential distribution and its corresponding order statistics To perform the discordance test for k-upper outliers we assume a null hypothesis (i)
H
0: all the observations are coming from the exponential distributionagainst an alternative hypothesis (ii)
H
1; thatobservations are from this population but k values are from , population. If we reject the null hypothesis and say that there is k-upper outlier in the given exponential sample (where Ek represents the
simulated value from the given test statistic and E*k(ᾳ) is the critical value of the test statistic).
3. SIMULATION STUDY
The random sample from exponential distribution was simulated, and upper outliers were tested. The exponential distribution is the distribution with probability density function:
, (10)
A discordance test has to be performed in order to investigate the presence of outliers. Let
be a random sample in an exponential distribution
and its corresponding order statistics
misspecification, biased parameter estimation and incorrect results. It is therefore important to identify them prior to modeling and analysis.
Table 1: Descriptive Statistics of exponential simulated sample, at different value of
n
n MEAN STDEV SKEWNESS KURTOSIS
15 1.02949 0.89031 0.81961 -0.81798
16 0.69586 0.52797 0.57929 -1.01206
17 1.10798 1.20354 1.21317 0.51089
18 1.05834 0.80689 0.60443 -0.75001
19 1.33233 1.37831 1.37831 1.378305
20 1.10598 0.93664 1.80601 0.78441
50 0.96628 0.96562 1.80601 3.140291
100 0.77457 0.77480 1.765782 3.19201
200 1.08986 1.134765 2.074985 5.60357
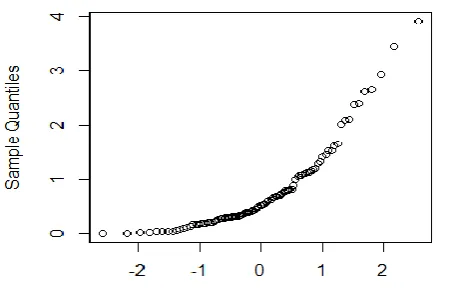
Figure 1: Normal Quantile Quantile plot for n15
Figure 2: Normal Quantile Quantile plot for n20
Figure 3: Normal Quantile Quantile plot for n200
Figure 4: Normal Quantile Quantile plot for n100
Investigation into outlier detection methods have been suggested for a series applications, such as credit card fraud detection, clinical trials, voting irregularity analysis, data cleansing, network intrusion, severe weather prediction, geographic information systems, athlete performance analysis, and other data-mining tasks.
3.1 Detection of k upper outliers using Tietjen-Moore and Gap test statistics
Table 2 shows the approximate critical Values for 5% and 1% test for upper outliers in exponential Sample Using Gap-test and Tietjen-Moore as test Statistics.
Table 2:Tietjen-Moore and Gap-test critical values
n
15 0.6885 0.5587
0.2290 0.3146
0.6792 0.5593
0.2496 0.3339
0.6872 0.5532
0.2640 0.3473 16 0.6508
0.5322
0.2155 0.2971
0.6454 0.5265
0.2351 0.3156
0.6483 0.5404
0.2488 0.3285 17 0.6161
0.5147
0.2035 0.2815
0.6187 0.5088
0.2222 0.2992
0.6139 0.5103
0.2353 0.3116 18 0.5875
0.4910
0.1928 0.2673
0.5848 0.4859
0.2106 0.2844
0.5856 0.4855
0.2231 0.2963 19 0.5663
0.4706
0.1831 0.2546
0.5588 0.4709
0.2002 0.2710
0.5608 0.4633
0.2121 0.2824 20 0.5392
0.4490
0.1743 0.2430
0.5375 0.4443
0.1907 0.2587
0.5385 0.4574
0.2022 0.2698 50 0.2449
0.2160
0.0726 0.1025
0.2439 0.2158
0.0788 0.1096
0.2427 0.2148
0.0839 0.1148 100 0.1319
0.1191
0.0364 0.0521
0.1322 0.1206
0.0398 0.0558
0.1313 0.1208
0.0424 0.0586 200 0.0696
0.0655
0.0305 0.0435
0.0697 0.0655
0.0332 0.0467
0.0796 0.0766
0.0354 0.0490
Table 3 :Tietjen-Moore Statistic for k-upper outlier for exponential samples
n E2, E3, E4,
15 2.8204** 2.0842** 2.4002*
16 0.6154* 0.7964** 15.4177**
17 4.57123** 0.47932 2.0188**
18 1.25438** 0.9856** 1.16307**
19 0.7326** 1.1628** 1.2280**
20 2.3116** 0.8224** 1.1616**
50 0.5378** 0.5015** 0.6694**
100 0.1964** 0.1997** 0.2324**
200 0.1196** 0.0703** 0.09521**
**
indicate that the k-upper outlier is found in both 5% and 1% while * indicate that k-upper outlier is found at 5% only. We compare Table 3 with 4.2 if
we reject the null hypothesis and say that there is k-upper outlier in a given exponential sample.
Table 4: Estimated Gap test Statistics for k-upper outliers for exponential samples
n Z1, Z2, Z3,
15 0.1509 1.8121** 0.1477
16 0.8497** 0.0698 0.1276
17 0.0733 0.0771 0.1118
18 0.0232 0.1081 0.1131
19 0.0169 0.6958** 1.6059**
20 0.5708** 0.8025** 0.9708**
50 0.0884** 0.0643** 0.1312**
100 0.0943** 0.05642** 0.0598**
200 0.0643** 0.0465** 0.0534**
**
indicate that the k-upper outlier is found in both 5% and 1% while * indicate that k-upper outlier is found at 5% only. We compare table 4 with 6 if
we reject the null hypothesis and say that there is k-upper outlier in a given exponential sample.
Table 5: Table for Test Statistics of Tietjen-moore for k-Upper Outlier Criterion
n
15 2.8204** 0.6885 2.0842** 0.6792
0.5593
2.4002* 0.6872
0.5532 0.5587
16 0.6154* 0.6508 0.7964** 0.6454
0.5265
15.4177** 0.6483
0.5404 0.5322
17 4.57123** 0.6161 0.47932 0.6187
0.5088
2.0188** 0.6139
0.5103 0.5147
18 1.25438** 0.5875 0.9856** 0.5848
0.4859
1.16307** 0.5856
0.4855 0.491
19 0.7326** 0.5663 1.1627** 0.5588
0.4709
1.2280** 0.5608
0.4633 0.4706
20 2.3116** 0.5392 0.8224 0.5375
0.4443
1.1616** 0.5385
0.4574 0.449
50 0.5378** 0.2449 0.5015** 0.2439
0.2158
0.6694** 0.2427
0.2148 0.216
100 0.1964** 0.1319 0.1997** 0.1322
0.1206
0.2324** 0.1313
0.1208 0.1191
200 0.1196** 0.0696 0.0703** 0.0697
0.0655
0.0952** 0.0796
0.0766
0.0655
*
First line is 5% and second line is 1%.
From Table 5, it is observed that k-upper outliers were seen in all the sample for and respectively except for =17, and =3 for 5% and 1%, and 5% for =16 and =2
In fairness the test was able to identify outliers as expected; same is not for the test proposed by Gap Family as shown table
Table 6: Table for Test Statistics of Gap test for k-Upper Outliers
Z2 Z3 Z4
15 0.1509 0.2290 0.3146
1.8121** 0.2496
0.3339
0.1477 0.2640 0.3473
16 0.8497** 0.2155
0.2971
0.0698 0.2351
0.3156
0.1276 0.2488 0.3285 17 0.0733 0.2035
0.2815
0.0771 0.2222
0.2992
0.1118 0.2353 0.3116 18 0.0232 0.1928
0.2673
0.1081 0.2106
0.2844
0.1131 0.2231 0.2963 19 0.0169 0.1831
0.2546
0.6958** 0.2002
0.2710
1.6059** 0.2121
0.2824
20 0.5708** 0.1743
0.2430
0.8025** 0.1907
0.2587
0.9708** 0.2022
0.2698
50 0.0884** 0.0726
0.1025
0.0643** 0.0788
0.1096
0.1312** 0.0839
0.1148
100 0.0943** 0.0364
0.0521
0.05642** 0.0398
0.0558
0.0598** 0.0424
0.0586
200 0.0643** 0.0305
0.0435
0.0465** 0.0332
0.0467
0.0534** 0.0354
0.0490
*
First line is 5% and second line is 1%.
From Table 6 k-upper outlier were only observed in 14 cells out of 36 cells, it may be an indication of the ineffectiveness of the test statistics.
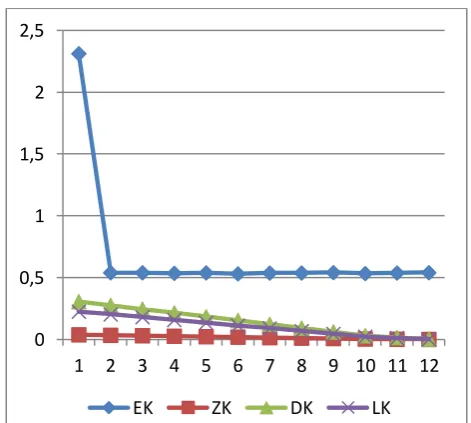
Figure 5: Comparative plots between Maximum likelihood ratio, Tietjen-Moore, Gap family test,
and Dixon-type at 5% level of significance
0 0,5 1 1,5 2 2,5
1 2 3 4 5 6 7 8 9 10 11 12
Figure 6: Plots of the difference between Tietjen-Moore and three other and Dixon-type at 5% level of
significance
Comparison of the three test based on power factor
The difference of and appear to be the same, hence the line of covers that of
.
4. DISCUSSION
Simulation was done replicating 10,000 exponential samples and from which samples of 15-20, 50, 100 and 200 were drawn respectively. Various test statistics were carried out for discordancy tests on the samples.
Table 1 shows the descriptive statistics for the exponential sample; the mean, standard deviation, skewness and the kurtosis respectively. From the descriptive, it is observed that the data is not normally distributed hence, contains outlying values which presence was tested for in the data analysis. Figure 5 shows the line plots comparing maximum likelihood ratio test statistics with Dixon-type and Tietjen-Moore test statistics for values of
and where represents suspected number of upper outlier in the sample.
Table 2 displays critical values for the calculated with a given Gap family formula and that of Tiejen-Moore critical value for 5% and 1% for =15 to 20, 50, 100 and 200 respectively, these critical values are reliable and there will not be a need for table. In all the test statistics null hypothesis that the samples at each value of and would be rejected, comparing the calculated to critical values.The table for ‘gap family test’ and Tietjen-Moore Statistics was presented in chapter four and it was found out that ‘Gap family test’ detected 16 outliers in 9 by 3 matrix while Tietjen-Moore detects the presence of 25 for both 5% and 1% and 1 for only 5% making twenty (26) altogether. However, Tietjen-Moore is found to be more effective in detecting outlier than the test
suggested by Gap family. The Power test also confirms that Tietjen-Moore test is better to detect k-Upper Outlier more so that critical value and Test Statistics can be obtained with statistical Software. Table 2 displays critical values for the given Gap and Tietjen-Moore tests critical values at 5% and 1% for
=15 to 20, 50, 100 and 200 respectively. This was generated using Software by R Core team (2018). In the entire test statistics null hypothesis would be rejected at each value of and comparing the simulated values to critical values. The table for‘gap family test’ and Tietjen-Moore Statistics were presented, it was found out that Gap-test detected 16 occurrences in 9 by 3 matrix while Tietjen-Moore detected 26 occurrences for both 5% and 1%. However, Tietjen-Moore is found to be more effective in detecting outliers than the test suggested by Gap family.
5. CONCLUSION
This study explored the use of gap family test and Tietjen-Moore Statistics to detect the presence of k-upper outliers in exponential samples. On comparing the two tests, Tietjen-Moore Statistics proved to be better test for k-upper outlier relative to the Gap family test proposed by [LK12]. The results obtained in this study agree with that of [AAD16]. Therefore, Tietjen-Moore test statistics is recommended to test k-upper outliers.
REFERENCES
[AR04] Acuna E., Rodriguez C. A. – Meta analysis study of outlier detection methods in classification, Technical paper, Department of Mathematics, University of Puerto Rico at Mayaguez, Retrieved from academic.uprm.edu/ eacuna/paperout.pdf. In proceedings IPSI 2004, Venice, 2004.
[AAD16] Adesina O. S., Ayoola F. J., Dare R. J. – Testing For Multiple Upper Outliers in Distribution Samples: A Study of Foreign Exchange Data. Assumption University-eJournal of Interdisciplinary Research (AU-eJIR), 1 (2), pp. 80-92, 2016.
[BL94] Barnett V., Lewis T. – Outliers in Statistical Data. John Wiley, 1994.
[BS03] Bay S. D., Schwabacher M. – Mining distance-based outliers in near linear time with randomization and a simple pruning rule, In Proc. of the ninth
0 0,05 0,1 0,15 0,2 0,25 0,3 0,35
1 2 3 4 5 6 7 8 9 10 11 12
ACMSIGKDD Conference on Knowledge Discovery and Data Mining,Washington, DC, USA, 2003.
[B+00] Breunig M. M., Kriegel H. P., Ng R. T., Sander J. – Lof: Identifying density based local outliers, In Proc. ACMSIGMOD Conf. 2000, 93–104, 2000.
[Dav79] David H. A. – Robust estimation in the presence of outliers, In Robustness in Statistics, eds. 2000 R. L.Launer and G. N. Wilkinson, Academic Press, New York, 61-74, 1979.
[DG93] Davies L., Gather U. – The identification of multiple outliers, Journal of the American Statistical Association, 88(423), 782-792, 1993.
[Fer61] Ferguson T. S. – On the Rejection of outliers, In Proceedings of the Fourth Berkeley Symposium on Mathematical Statistics and Probability, vol. 1, 253-287, 1961.
[FP97] Fawcett T., Provost F. – Adaptive fraud detection, Data-mining and Knowledge Discovery, 1(3), 291–316, 1997.
[Gru69] Grubbs F. E. - Procedures for detecting outlying observations in Samples, Technometrics, 11,121, 1969.
[Had92] Hadi A. S. – Identifying multiple outliers in multivariate data, Journal of the Royal Statistikical Society. Series B, 54, 761-771, 1992.
[H+92] Hawkins S., He H. X., Williams G. J., Baxter R. A. – Outlier detection using replicator neural networks, In Proceedings of the Fifth International Conference and Data Warehousing and Knowledge Discovery (DaWaK02), Aixen Provence, France, 2002.
[JW92] Johnson R. A., Wichern D. W. –
Applied Multivariate Statistical Analysis. Prentice Hall, 1992.
[LK12] Lalitha S., Kumar N. –Multiple outlier test for upper outliers in an exponential sample. Journal of applied statistics, 39:6 1323-1330, 2012.
[R18] R Core Team – R: A language and environment for statistical computing. R Foundation for Statistical Computing, Vienna, Austria, 2018. https://www.R-project.org
[RW95] Runger G., Willemain T. – Model-based and Model-free Control of Autocorrelated Processes, Journal of Quality Technology, 27 (4), 283-292, 1995.