Quang, H. T. and Castro, R. d. (2017). Impact of supply chain alignment on construction performance: A developed model for Vietnam. International Journal of Construction Supply Chain Management Vol. 7, No. 2 (pp. 68-92). DOI: 10.14424/ijcscm702017-68-92
68
IMPACT OF SUPPLY CHAIN ALIGNMENT ON
CONSTRUCTION PERFORMANCE: A DEVELOPED MODEL
FOR VIETNAM
Huy Truong Quang, Ho Chi Minh City University of Technology, Vietnam & Kyoto University, Japan
tqhuy@hcmut.edu.vn
Rodolfo de Castro, University of Girona, Spain.
ABSTRACT
There are many articles mentioning the advantages and benefits of supply chain alignment none, however, describe how to model such alignment in the supply chain. This paper offers a framework for examining and understanding the impact supply chain alignment has on performance. Based on supply chain mapping approach, a model describing alignment between processes/ flows in the supply chain network is developed. The model is then validated using a dataset of 316 enterprises operating in the Vietnam construction sector. Evidence indicates that the supply chain processes and flows were aligned. According to the results, the proposed supply chain alignment model is able to explain a 59.9% variance in operational performance, 58.9% in customer satisfaction, 34.5% in operating costs and 67.4% in business performance. To successfully align the supply chain network, companies can use the proposed model as a “road-map” to reduce high costs, to avoid the loss of control, management difficulties and/or vulnerability to opportunistic action, all of which may hinder efforts to align the supply chains.
KEYWORDS: Cash Flow, Information Flow, Material Flow, Supply Chain Alignment, Supply
Chain Performance.
INTRODUCTION
Supply Chain (SC) management research started to be of interest in 1990, thanks to the advent of information technology able to manage the data generated between the various stakeholders in a chain (Chandra, 1997; Lummus & Vokurka, 1999). Initially, SC management was used in a limited number of companies and in very specific sectors, but over time it has gradually spread to all sectors.
Quang, H. T. and Castro, R. d. (2017). Impact of supply chain alignment on construction performance: A developed model for Vietnam. International Journal of Construction Supply Chain Management Vol. 7, No. 2 (pp. 68-92). DOI: 10.14424/ijcscm702017-68-92
69 In contrast, lack of SC alignment can cause havoc, the failure of many SC practices and conflicting objectives between marketing, sales, manufacturing and distribution (Beth et al., 2003; Van Hoek & Mitchell, 2006).
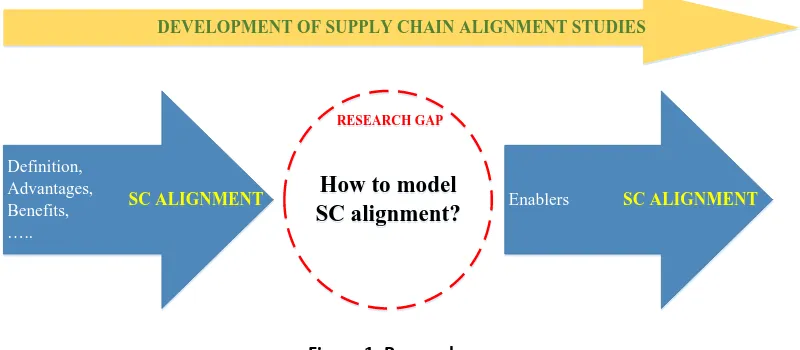
According to Wilding et al. (2012), the current literature on supply chain alignment is both fragmented and largely theoretical in nature. Previous studies mainly described definition, advantages and benefits of SC alignment, however, few of these described how such benefits are obtained. To this end, Wilding et al. (2012) suggested some enablers for supply chain alignment which was later validated by Skipworth, Godsell, Wong, Saghiri and Julien (2015). We can see that between previous studies and Wilding et al. (2012), there is a research gap, which is, “how to model such an alignment in a specific supply chain?” As illustrated in the Figure 1, such model will be “a bridge” for thoroughly understanding the concepts and proposing enablers effectively and efficiently.
Definition, Advantages, Benefits, …..
SC ALIGNMENT
SC ALIGNMENT How to model Enablers SC ALIGNMENTSC ALIGNMENT
SC alignment?
How to model SC alignment?
RESEARCH GAP
RESEARCH GAP
DEVELOPMENT OF SUPPLY CHAIN ALIGNMENT STUDIES
Figure 1: Research gap
Ballou (2007) suggested that a full alignment needs to cover all elements of SC management which are captured in a trilogy of intra-functional, inter-functional and inter-organizational coordination, being:
(i) Intra-functional coordination includes all the activities and processes related to a function (such as logistics, design or manufacturing) that need to be grouped together.
(ii) Inter-functional coordination is how these functions have to be correlated to build product flow.
(iii) Inter-organizational coordination is how these functions and relationships will belong to different organizations in the same industrial sector. This element emphasizes the role of information flow between alignment members of the chain.
Quang, H. T. and Castro, R. d. (2017). Impact of supply chain alignment on construction performance: A developed model for Vietnam. International Journal of Construction Supply Chain Management Vol. 7, No. 2 (pp. 68-92). DOI: 10.14424/ijcscm702017-68-92
70 The remainder of the article is structured as follows: first, previous work is reviewed to provide an insight into existing theory and then the conceptual framework is built step-by-step. These steps model the three flows of SC, enablers and the impact of SC alignment on performance. This section also includes the hypotheses the study puts forward. In methodology, the authors describe the data and the statistical techniques used to test the hypotheses. This is followed by results, discussion and finally conclusions, where theoretical and practical implications are highlighted and further research is proposed.
LITERATURE REVIEW
Supply Chain Alignment and the Knowledge Gap
For a firm, one of the main benefits of SC is the supply chain alignment strategy. Lee (2004) points out that agility, adaptability and alignment are the three strategic business imperatives in the topmost successful supply chains (Figure 2).
Figure 2: Three strategic business imperatives
SC agility focuses more on “service level” rather than “cost” as being the market winner (Christopher & Peck, 2004) and integrates customer sensitivity, organization, processes, networks and information systems. This is seen as a tool which refines information flow into a shorter, more real-time context. The SC adaptability, a more strategic concept, is related to how quickly a company can implement strategies and initiatives based on market changes, customer requirements and new opportunities. SC alignment refers to the strategic collaboration and coordination between SC members to manage intra and inter relationships (Flynn, Huo & Zhao, 2010). A company that aligns its partners’ interests with its own is by redefining the terms of its relationships so that these firms share risks, costs, and rewards equitably. As a result, a well aligned supply chain leads to revenue growth, working capital efficiency, operating cost reduction, better perceived customer value, etc. across the whole supply chain (Wilding et al., 2012).
Quang, H. T. and Castro, R. d. (2017). Impact of supply chain alignment on construction performance: A developed model for Vietnam. International Journal of Construction Supply Chain Management Vol. 7, No. 2 (pp. 68-92). DOI: 10.14424/ijcscm702017-68-92
71 and Power (2009) referred to the high cost, the loss of control, the difficulty of management and the vulnerability to opportunistic actions, as some key challenges that might hinder the alignment efforts in SCs. Whipple and Russell (2007) also confirmed that constraining the alignment of the SC activities to strategic suppliers and customers is more realistic due to the complexities and challenges of achieving integration with all SC partners.
Table 1: SC Alignment Literature Analysis
Authors How to align? Data Methodology Findings
(Hong et al. 2012) Supplier management practices
Survey data from directors and senior managers in purchasing and supply chain functions from 205 manufacturing firms in the USA.
Factor analysis was conducted to test convergent and discriminant validity. Hypotheses testing were done via Structural Equation Modeling (SEM) analysis using SMART Partial Least Square (PLS) software.
The study finds that lean (agile) supplier management practices are positively associated with supply chain integration (flexibility). Further, alignment of lean supplier practices and IS for Efficiency enhances supply chain integration, as assessed by a positive moderating effect of IS for efficiency on the relationship between lean supplier practices and supply chain integration.
El Mokadem (2016) ISO 9000 Survey data Cluster analysis and moderated regression analysis using ordinary least squares were employed to test the study hypotheses.
Advanced ISO 9000 implementation moderates the relation between customer priorities and the prioritization of supplier selection criteria with respect to priorities of cost management, total cost of ownership and product flexibility.
Wilding et al. (2012) Six main constructs for the enablers of alignment: organisational structure, internal relational behaviour, customer relational behaviour, top management support, information sharing and business performance measurement system.
Previous papers on SC alignment
Literature review Six main constructs for the enablers of alignment are identified and defined. While the literature is disparate, across different disciplines there is good support for these enablers. The relationships between supply chain alignment and shareholder and customer value are also argued with the support of the literature. Although each of the enablers is argued to positively affect shareholder and customer value, their interactions with one another are not well supported in the literature, either theoretically or empirically, and therefore this could be an area for further research.
Skipworth et al. (2015)
Six main constructs for the enablers of alignment: organisational structure, internal relational behaviour, customer relational behaviour, top management support, information sharing and business performance measurement system.
A survey of medium-to-large UK manufacturing companies was conducted where the sample comprised 151 randomly selected companies, and the response rate was 56%.
Partial least square regression was used to test the hypothesis.
Two types of supply chain alignment are defined – shareholder and customer – but only customer alignment has a direct positive impact on business performance, while shareholder alignment is its antecedent. Top management support was shown to be an enabler of both shareholder and customer alignment, while organisation structure, information sharing and performance measurement system enabled shareholder alignment, while internal relational behaviour enabled customer alignment.
Quang, H. T. and Castro, R. d. (2017). Impact of supply chain alignment on construction performance: A developed model for Vietnam. International Journal of Construction Supply Chain Management Vol. 7, No. 2 (pp. 68-92). DOI: 10.14424/ijcscm702017-68-92
72 SC. El Mokadem (2016) provided empirical evidence that advanced ISO 9000 implementation aligns customer priorities and supplier selection criteria priorities. Wilding et al. (2012), from our point of view, come closer to this and identified two kinds of supply chain alignments – shareholder alignment and customer alignment – and, based on an extended Systematic Literature Review, suggested some enablers, concretely six constructs, required to achieve SC alignment. Skipworth et al. (2015) continued on from the work of Wilding et al. (2012) and validated the role of these enablers on shareholder and customer alignments, along with the impact of these alignments on business performance
It can further be argued that the theoretical underpinning of collaborative working and practices lies within the field of interpersonal and organisational behaviour and social dynamics. It can thus further be argued that CW is context driven and that the universality of practices is rarely possible owing to the influence of varying socio-cultural environments (Hauck et al., 2004; Pryke, 2004; Sillars & Kangari, 2004; Beach et al., 2005; Fong & Lung, 2007).
These studies provided insights into the SC alignment body; however, a gap exists, as illustrated in the Figure 1. It is noteworthy that an overarching answer for the question, “how to model such an alignment in a specific supply chain?” is still missing in the SC alignment literature. Lee (2004) suggests steps, although not unique, to modelling supply chain alignment. These steps start with information flow so that all the companies involved in the supply chain share information and are on the same page as each other. The strategies are then modelled to align each partner’s roles, along with incentives and/or performance results, to maximize the supply chain’s performance. The authors think that this approach is absolutely right but does it go far enough?
To fully model alignment in the SC characteristics, the adoption of SC management, a broad concept that covers SC alignment, is addressed. While there are many arguments for a single definition, most scholars emphasize that SC management requires long-term strategic and tactical coordination between firms. Such coordination would have to include every single activity related to product flow, as well as managing and sharing the information gathered from final customers and/or along the chain, and the advantages expected from applying these supply chain practices. Hence, modelling SC alignment does not only consider information, but also takes material flow into account. Both flows have to be aligned with the business strategies of the chain’s members, and consequently, this alignment, from an operational point of view, will have an impact on the financial and operational performance as this is the goal of the companies involved (Chandra & Kumar, 2001).
However, it is worth noting that the literature lacks a model which represents any alignment in a supply chain based on SC flows
Conceptual Framework
Quang, H. T. and Castro, R. d. (2017). Impact of supply chain alignment on construction performance: A developed model for Vietnam. International Journal of Construction Supply Chain Management Vol. 7, No. 2 (pp. 68-92). DOI: 10.14424/ijcscm702017-68-92
73 processes will then be created as a result. The current study believes there is an alignment between these two processes. This is our assumption to model SC alignment. Agreed to this, Christopher, Lowson and Peck (2004 p.372) defined alignment as the ability to create “seamless” or “boundaryless” connections, in other words, there are no delays caused by hand-offs or buffers between the different stages in the chain and transactions are likely to be paperless.
These discussions clarify the difference between alignment and integration which jointly shares goals, plans, costs and problems. One, i.e. alignment, is to focus on “seamless processes,” while integration encourages partners to become more entrenched members of the network and instils a sense of belonging to the chain (Bagchi, Ha, Skjoett-Larsen & Soerensen, 2003). A true integration thus paves the way for individual members of the supply chain to behave more like one unified entity sharing ideas, skills and culture alike (Bagchi et al., 2003). With respect to model SC alignment, Gardner and Cooper (2003 p.59) argued that this can be a very complex, even endless, map if it truly includes all customers and suppliers at all tiers. Also they contend that a supply chain alignment map is able to enhance strategic planning within a firm and across firms, as well as across processes and functions.
These processes which build a supply chain, as mentioned above, can be identified within the three main flows in a supply chain, i.e. material, information and cash flows, moving in a cyclic process from suppliers to consumers and vice versa. These three flows have a close relationship in which the effective implementation of material and information flows (aligning them under an SCM paradigm) can enhance performance and cash flow. However, it is worth noting that each process itself has no mutual interaction and so only expresses when the process is implemented. Thus, modelling SC alignment will be schematically depicted throughout SC practices (Tamas, 2000).
Based on the scope of the alignment, this study classifies this concept into the following two categories:
(i) Internal alignment, which expresses the alignment within a company or each flow of the supply chain.
(ii) External alignment, which describes the alignment with customers and suppliers in the chain.
SC alignment is a connection between these two categories, i.e. internal and external alignment. Hence, the effect of alignment is represented twofold in the proposed model i.e. alignment between SC practices in each flow (internal alignment) and alignment between flows (external alignment).
Quang, H. T. and Castro, R. d. (2017). Impact of supply chain alignment on construction performance: A developed model for Vietnam. International Journal of Construction Supply Chain Management Vol. 7, No. 2 (pp. 68-92). DOI: 10.14424/ijcscm702017-68-92
74
Strategic planning management
Human resource management
SC ALIGNMENT
ENABLERS
CASH FLOW
Financial performance
Operational performance Customer satisfaction Product/service
design
Manufacturing/
Operating Logistics
Supplier management
Customer management
MATERIAL FLOW
INFORMATION FLOW
Internal alignment Internal alignment
Internal alignment External alignment
Figure 3: Research Framework
In the next part, internal alignment in each flow of the chain is discussed and external alignment with suppliers and customers presented and then the role of enablers for these alignments will be considered before examining the impact of SC alignment on performance.
Material flow
Material flow involves moving goods along a chain, starting with the suppliers and ending with the final customers. There are three critical processes in this flow: (1) Product and/or service design, (2) Product manufacturing operations and monitoring tools and (3) Product delivery to customers. While these processes can be viewed from many different perspectives, such as cost efficiency, service level or innovation, the authors consider them from an SCM perspective and as such, these processes increase their interrelation and this perspective converts them into SC practices which have a positive effect on the whole flow. To model the Material Flow model, three constructs representing the three processes of the flow are proposed: Product/Service Design, Process Management and Logistics. Figure 4 describes the alignment between these three practices and then the hypotheses are discussed afterwards.
Design H1a Manufacturing H1c Logistics H1b
Figure 4: Material Flow Alignment
Quang, H. T. and Castro, R. d. (2017). Impact of supply chain alignment on construction performance: A developed model for Vietnam. International Journal of Construction Supply Chain Management Vol. 7, No. 2 (pp. 68-92). DOI: 10.14424/ijcscm702017-68-92
75 H1a,b: The product/service design process has an alignment with the manufacturing/ operating and logistics processes.
Process management practice refers to using statistical tools, automatic processes, preventive equipment maintenance etc. to monitor production variability (Forker, Mendez & Hershauer, 1997; Saraph, Benson & Schroeder, 1989). It ensures that processes operate smoothly. Hence, required products are finished when they are due, delays in logistics are reduced and meeting quoted or anticipated delivery dates or providing desired quantities on a consistent basis is possible. Thus, the following hypothesis is proposed:
H1c: The manufacturing/ operating process has an alignment with the logistics process.
Information flow
This flow is a key component of today's supply chain as it brings trading partners together (Gopalakrishnan, 2001). There are some key processes in this flow: Determining and satisfying customer demand, communicating with suppliers, selection of suppliers, integrating with customers of and suppliers to a firm's activities. Hence two practices: Customer Management (CM) and Supplier Management (SM) covering the implementation of these processes are proposed. Figure 5 represents the Information Flow Alignment.
Supplier management Customer management
Figure 5: Information Flow Alignment
Customer management refers to determining and satisfying customers’ needs and wants so that companies better understand customer expectations and market opportunities (Tan, 2001). As a result, firms are able to select appropriate suppliers, set up communication channels and integrate suppliers into a firm’s activities to maximize customer value (Lado, Paulraj & Chen, 2011).
H2a: The customer management process has an alignment with the supplier management process
SC alignment
This section describes the alignment between material and information flows i.e. external alignment. Hülsmann and Windt (2007) indicated that practices of information flow improve the efficiency of material flow. For instance, understanding customer demands is helpful for companies to effectively and efficiently transform these demands into design and logistic activities. Furthermore, as attributes of products/services are transmitted to all employees, errors are minimized and innovations in these activities increase (Zehir & Sadikoglu, 2010).
H2b,c: The customer management process has an alignment with the product/service design and logistics processes.
Quang, H. T. and Castro, R. d. (2017). Impact of supply chain alignment on construction performance: A developed model for Vietnam. International Journal of Construction Supply Chain Management Vol. 7, No. 2 (pp. 68-92). DOI: 10.14424/ijcscm702017-68-92
76 standards and quality requirements. High-quality inputs provided at the right time with the required quantity will help firms to avoid downtime incidents, to reduce variance in processes and the rate of damaged materials. Moreover, effective SM can cut down on inventory at the waste and safety inventory level (Park & Hartley, 2002).
H2d: The supplier management process has an alignment with the manufacturing/ operating process.
Enablers: human resources and strategy
Tamas (2000) conducting a survey of 80 supply chain executives found that only 13% managers questioned believed that their firms’ SC practices were actually fully aligned with their business unit strategies. In reality, the ability to create “seamless” or “boundary-less” connections in a supply chain is hard to achieve (Christopher & Peck, 2004). Many SC experts agreed that internal alignment is still an unresolved issue and can be more difficult than building external alliances (Beth et al., 2003; Van Hoek & Mitchell, 2006). This strongly emphasizes the importance of supply chain alignment enablers, e.g. Strategic Planning Management and Human Resource Management (Skipworth et al., 2015).
Human resources are considered the most important resource in any firm. They are also a key factor as to whether the company is successful or not. Even when a company has good technology and equipment, all its activities require human interaction. Human resource management is primarily concerned with training and empowering employees within organizations (McAfee, Glassman & Honeycutt, 2002; Powell, 1995). To this end, employees have the knowledge and skills to do their own jobs effectively and this strengthens the efficacy of all activities (Carter, Smeltzer & Narasimhan, 2000).
H3a,b,c,d,e,f: Human resource management positively impacts on customer and supplier management, product/service design, manufacturing/operating and logistics processes. Strategies and plans can serve as a foundation for, as well as a guide to, different company functions on what needs to occur and be accomplished to meet firm goals (Rodrigues, Stank, & Lynch, 2004). Accordingly, Strategic Planning Management refers to ensure all the activities of a firm are directed towards common supply chain goals. All the members in the chain, regardless of their appointed task, must share the same vision (Bechtel & Jayaram, 1997b). A properly developed strategy/ plan is a signal to employees as to what a company believes is important and furthermore, is an alignment of organizational departments and operations to the intent of achieving company’s goals (Baier, Hartmann & Moser, 2008), leading to efficiencies throughout the company and improve overall organizational effectiveness (Chan, Huff, Barclay & Copeland, 1997; Venkatraman & Prescott, 1990).
Quang, H. T. and Castro, R. d. (2017). Impact of supply chain alignment on construction performance: A developed model for Vietnam. International Journal of Construction Supply Chain Management Vol. 7, No. 2 (pp. 68-92). DOI: 10.14424/ijcscm702017-68-92
77 H4a,b,c,d,e,f: Strategic Planning Management positively impacts on human resource management, customer and supplier management, product/service design, manufacturing /operating and logistics processes.
Cash flow
This flow relates to the performance of alignment. Measuring performance can be carried out from diverse perspectives, but the most common are financial indicators. According to Quang et al. (2016), these measures tend to be historical and do not demonstrate the current situation of the business environment nor do they reveal prospects of future performance. In this work, as in the approach from Wilding et al. (2012), performance will be evaluated not only based on financial indicators, but on shareholder and customer expectations of SC alignment as well.
Shareholder expectations require processes to be consistent with business strategy, e.g. increase in efficiency of inventory, production, inspection, delivery, innovation, quality management, employees’ productivity, etc. All these expected results from SC strategy are associated with operational processes; therefore to evaluate shareholder expectations, the concept of operational performance is proposed.
Customer expectations mean that organizations must determine strategies and act to create customer value, which is then measured in terms of customer perceived benefits gained from a product/service compared to the cost of purchase. To this end, customer satisfaction is suggested. The relationship between these outputs is depicted in Figure 6.
Operational Performance
Customer Satisfaction
Financial Performance
H5a H5c
H5b
Figure 6: Performance Flow Framework
High operational performance means a company is able to produce quality products/ services and reduce waste, which in turn ensures a high-quality product/service at a low price can be offered. As a result, customers are more satisfied and market share and sales revenue are increased (Ou, Liu, Hung & Yen, 2010).
H5a,b: Operational performance positively impacts on customer satisfaction and financial performance.
If customers are satisfied with the products/services of a company, they are less likely to switch to competitors. Moreover, they tend to be less price sensitive or even willing to pay a higher price. Likewise, a satisfied customer will introduce other potential customers, which results in increasing financial performance (Kaynak & Hartley, 2008).
Quang, H. T. and Castro, R. d. (2017). Impact of supply chain alignment on construction performance: A developed model for Vietnam. International Journal of Construction Supply Chain Management Vol. 7, No. 2 (pp. 68-92). DOI: 10.14424/ijcscm702017-68-92
78 Table 2: Measurement Scales of Constructs
Research concepts
Measuring items Sources
Customer Management
Determining customers’ needs and wants. Employee understanding of products or services. Use of information from customers in designing products and services. Commitment to customer satisfaction.
(Lado et al., 2011; Tan, 2001)
Supplier Management
Reliance on a few suppliers. Supplier selection based on quality. Use of certified suppliers. Reliance on supplier process control. Communication with suppliers concerning quality considerations. Supplier conformity to required quality attributes. Specification clarity for suppliers. Decrease in amount of inspection required for incoming quality.
(Park & Hartley, 2002)
Product Service Design
Use of modular design for component parts. Use of standard components. Products simplification. New product/service design review. Product/service specifications clarity.
(Amy, 2003; Barbara B. Flynn
et al., 1995; Kannan & Tan,
2005; Tan, 2001)
Process Management
Use of fool-proof process design. Use of statistical techniques. Use of automatic processes. Auto-control inspection. Use of preventive equipment maintenance. Work or process instruction clarity. Identifying where problems lie.
(Forker et al., 1997; Saraph
et al., 1989)
Logistics Selection of premises’ location. Response to anticipated delivery dates. Response to desired quantities. Modification of order size. Response to delivery times for specific customers.
(Leuschner et al., 2014)
Human Resource Management
Employee development objectives based on strategic objectives. Effectiveness of employee problem/grievance resolution program. Measurement of employee satisfaction. Work environment. Task diversification. Empowerment. Promoting employee motivation. Training programs. Employee involvement in determining training needs.
(Carter et al., 2000; McAfee
et al., 2002; Powell, 1995)
Strategic Planning Management
Identify strategic opportunities. Communicate business unit’s strategy to employees. Understanding business unit’s strategic plans. Deployment of strategic plans. Consideration of quality management in the company strategic plan. Consideration of CS in the company’s strategic plan.
(Bechtel & Jayaram, 1997b; Ralston et al., 2015; Sufian & Monideepa, 2013)
Customer Satisfaction
Response to customer standards. Customer evaluation of firm’s performance. Continuity of use of firm’s product/service. Recommending firm’s product/service to others.
(Bozarth et al., 2009; Taylor and Baker, 1994)
Financial Performance
Material acquisition costs. Non-quality costs. Warehousing costs. Manufacturing unit costs. Cost of carrying inventory. Logistics costs. Transportation costs. Sales revenue. Market share. Return on investment. Return on sale.
(Beamon, 1999)
Operational Performance
Delivery of inputs on time. Material inventories. Quality inputs. Incoming materials/components/products inspection. Setup time. Lead-time. Inventory levels. Rate of defect products. Level of utilization at plant. Product/service quality. Rate of new product development. Level of absenteeism. Employees’ productivity.
(Beamon, 1999)
The impact of SC alignment on performance
As discussed previously, this research aims to model the SC alignment by aligning material and information flows both within and among enterprises with the support of human resource and strategy. In this approach, material flow contains the key activities that directly affect the performance of the chain. Thus, to consider the impact of SC alignment on performance, the authors concentrate on developing the relationship between practices belonging to material flow and performance. The other activities will have indirect effects on performance through processes in the material flow.
Quang, H. T. and Castro, R. d. (2017). Impact of supply chain alignment on construction performance: A developed model for Vietnam. International Journal of Construction Supply Chain Management Vol. 7, No. 2 (pp. 68-92). DOI: 10.14424/ijcscm702017-68-92
79 Furthermore, the use of preventive equipment maintenance makes manufacturing process smoothly by improving reliability of equipment and restricting disruption in production (Ho, Duffy & Shih, 1999).
H6a: Manufacturing/operating process positively impacts on operational performance. One of the concepts of logistic implementation refers to selecting a facility located close to suppliers and customers as well as modifying order size, as this ensures that distribution activities are faster and more effective. As a consequence, inputs come at the due time, operational efficiency is increased and customer satisfaction is greater (Leuschner, Carter, Goldsby & Rogers, 2014).
H6b,c: Logistics process positively impacts on operational performance and customer satisfaction.
METHODOLOGY
Development of Measurement Instrument
The scales of constructs were designed based on an extensive literature review (Table 2). A structural interview using a Q-sort method of three academics and eleven managers, all of whom are highly experienced in this area, was conducted. These discussions were recorded and analysed before modifying the questionnaire and adding some new variables, resulting in the official questionnaire being established. To extract the different attitudes of respondents, a five-point Likert scale was employed, where 1 indicates “strongly disagree,” and 5 “strongly agree.”
Sample Description
Data used throughout this research belong to a large-scale survey supported by a project of the European Commission that aims at fostering mutual enrichment and better understanding between the EU and the ASEAN region. Target respondents were managers of firms operating in the construction industry in Vietnam. The official questionnaire was sent to over 4,000 enterprises via their e-mail addresses. Consequently, a total of 316 valid answers were received. The sample description is presented in Table 3.
Quang, H. T. and Castro, R. d. (2017). Impact of supply chain alignment on construction performance: A developed model for Vietnam. International Journal of Construction Supply Chain Management Vol. 7, No. 2 (pp. 68-92). DOI: 10.14424/ijcscm702017-68-92
80 Table 3: Sample Description
Company profile % Company profile % Respondent profile %
State enterprises 14.9 Less than 10 23.1 President .6
Private 32.9 10 - 49 36.1 Vice president 1.3
Collective name 1.6 50 - 249 22.5 Director 2.2
Private Limited Co. 22.2 More than 250 18.4 Manager 81.3
Joint stock Co. 16.5 Architectural planning 3.8 Coordinator 1.9
Joint venture 2.2 Topographical -
Geological Surveying 3.8 Others 12.7
100% foreign capital 5.4 Material Trading 6.3 R&D 5.7
Other 4.4 Civil construction design 8.9 Warehouse 5.4
< 0.5 billion VND 11.4 Construction quality
inspection 4.7 Purchasing 1.3 0.5 - 1 billion VND 13.3 Construction executive 67.7 Manufacture 25.9
1 - 5 billion VND 20.3 Interior decoration 4.7 Quality 9.8
5 - 10 billion VND 18.4 < 5 years 16.8 Sales 10.8
10 - 50 billion VND 13.3 5 - 10 years 39.2 Logistics 1.6
50 - 200 billion VND 7.9 10 - 20 years 20.6 Project
management 19.0
200 - 500 billion VND 5.7 20 - 30 years 11.1 Supply chain
management 3.8 > 500 billion VND 9.8 30 - 40 years 6.3 Others 16.8
40 - 50 years 6.0
Model Validation
The process of data analysis starts with Exploratory Factor Analysis (EFA), which is conducted to uncover the underlying structure of observed variables. Extraction method used in EFA is the Principal Component – rotation method of Varimax. The breakpoint is at Eigenvalue ≥ 1 for all constructs in theoretical model and the total of variance explained is greater than 50% (Gerbing & Anderson, 1988). Moreover, the correlation coefficient between items and factors, known as factor loadings, needs to be greater than 0.4 in a certain factor and the difference between factor loadings of each item in different factors is exceeding 0.3 to achieve convergent validity and discriminant validity, respectively (Hair, Anderson, Tatham & Black, 1995).
Quang, H. T. and Castro, R. d. (2017). Impact of supply chain alignment on construction performance: A developed model for Vietnam. International Journal of Construction Supply Chain Management Vol. 7, No. 2 (pp. 68-92). DOI: 10.14424/ijcscm702017-68-92
81 al., 1995). Subsequently, Confirmatory Factor Analysis (CFA) tests the developed constructs to confirm convergent validity, unidimensionality, discriminant validity and criterion-related validity. This analysis allows us to validate theoretical concepts of measuring scales as well as the relationship between two concepts without bias due to measurement errors (Steenkamp & van Trijp, 1991). The measuring scales are confirmed convergent if Standardize Regression Weight of observed items is above 0.5 and ideally greater than twice standard error and R2 > 0.3 (Gerbing & Anderson, 1988).
Steenkamp and van Trijp (1991) stated that the constructs are unidimensional if the corresponding measurement models are overall fit. A well-fitting model will have p>.05 and Chi-square/df <3.0. However, Chi-square has a disadvantage that it relies on sample size (Hair et al., 1995). The greater sample size is, the higher Chi-square is, resulting in reducing goodness of model fit (Hair et al., 1995). It means that Chi-square is not capable of reflect “real” goodness of model fit since large sample size. Hence, some other goodness of fit indicators are used in parallel with Chi-square, e.g. CFI (Comparative Fit Index) and RMSEA (Root Mean Square Error Approximation). If a research model has CFI from 0.90 to 1 and RMSEA < 0.08, this model is well-fitting to the data (Gerbing & Anderson, 1988).
Two components of a certain construct or two constructs get discriminant validity since the Chi-square difference has a statistical significance (Steenkamp & van Trijp, 1991). Accordingly, two models for each pair will be compared. The first model is to allow free correlation between the two constructs, and the other is to fix the correlation between the two constructs at 1.0. In case, the Chi-square differences among research concepts are significant at P < 0.05, they are discriminant (Hair et al., 1995). Finally, Criterion-related validity that measures the extent to which a measure is related to an outcome, will be tested Pearson’s correlation coefficient. These three steps are conducted repeatedly until the constructs are valid, reliable and unidimensional. The test results from the EFA, Cronbach’s alpha and CFA are presented in tables 4 and 5.
Finally, Structural Equation Modeling (SEM) analysis that involves the simultaneous evaluation of multiple variables and their relationships, was applied to validate the theoretical model. The most important strength of SEM is that the relationships among numerous latent constructs can be addressed in a way that reduces the error in the model (Hair et al., 1995). This feature enables assessment and ultimately elimination of variables characterized by weak measurement (Hair et al., 1995). Moreover Hair, Gabriel and Patel (2014) stated that the concept and theory development require the ability to operationalize hypothesized latent constructs and associated indicators, which is only possible with SEM.
Quang, H. T. and Castro, R. d. (2017). Impact of supply chain alignment on construction performance: A developed model for Vietnam. International Journal of Construction Supply Chain Management Vol. 7, No. 2 (pp. 68-92). DOI: 10.14424/ijcscm702017-68-92
82
RESULTS
After deleting some measurement items that had factor loadings < 0.4, item – total correlation < 0.35, all constructs had Eigenvalue > 1, variance extracted > 50% and Cronbach’s Alpha > 0.6. This confirms that all research concepts are valid and reliable. However, the concepts of financial performance and operational performance were separated into specific constructs. In particular, there are two new concepts, namely (1) operating cost and (2) business performance that are established from the original concept – financial performance. Operational performance was split into three new constructs: (1) supplier performance, (2) process efficiency and (3) operating results. Hence, the Performance Flow Framework was revised, as illustrated in Figure 7.
Operational Performance
Customer Satisfaction H5a
Operational Performance
Customer Satisfaction H5b1
H5d
H5c2
Supplier Performance
Process Efficiency
Operating Results
Figure 7: Revised Performance Flow Framework
In this revised model, the hypotheses aligning H5b and H5c were deleted and five new hypotheses added as follows:
H5b1,2: Operational performance positively impacts on operating cost and business performance.
H5c1,2: Customer satisfaction positively impacts on operating cost and business performance.
H5d: Operating cost positively impacts on business performance.
Quang, H. T. and Castro, R. d. (2017). Impact of supply chain alignment on construction performance: A developed model for Vietnam. International Journal of Construction Supply Chain Management Vol. 7, No. 2 (pp. 68-92). DOI: 10.14424/ijcscm702017-68-92
83 Table 4: Goodness of Fit for Measurement Models
CM SM PSD PM LOG HRM SPM CS OC BP SP PE OR Threshold values χ2/df 1.32 2.378 1.496 1.699 0.792 0.44 2.179 1.474 0.324 1.897 0.133 2.114 2.636 <3.0
CFI 0.998 0.992 0.998 0.99 1 1 0.989 0.999 1 0.998 1 0.996 0.99 >0.9
RMSEA 0.032 0.066 0.04 0.047 0 0 0.061 0.039 0 0.053 0 0.059 0.072 <0.08
Table 5 describes the test results of discriminant validity. Seventy-eight pairs from thirteen research concepts are compared using two models for each pair. The first model is to allow free correlation between the two constructs, and the second is to fix the correlation between the two constructs at 1.0. The research results indicated that all the differences among research concepts were significant at P < 0.001. Thus, it can be concluded that all research concepts are discriminant.
Table 5: Chi-Square Difference between Research Concepts
BP CM CS HRM LOG PE OR OC PM PSD SPM SM SP BP 1
CM 60.55 1
CS 59.773 95.856 1 HRM 46.147 60.478 62.589 1 LOG 78.011 99.674 93.398 62.66 1
PE 49.838 82.193 83.573 64.87 98.741 1 OR 36.311 72.622 79.297 54.077 99.572 65.123 1 OC 51.266 81.834 87.407 65.8 53.063 57.359 71.576 1 PM 66.119 88.302 96.041 59.936 73.875 106.044 90.372 96.863 1 PSD 62.53 64.856 106.685 55.179 92.274 95.335 74.176 90.341 80.728 1 SPM 52.354 62.539 80.951 45.63 86.92 85.057 71.575 72.359 80.782 61.67 1 SM 43.821 43.629 67.908 46.392 68.66 80.501 60.432 78.31 70.321 52.881 49.595 1 SP 48.461 89.308 84.016 59.317 99.286 39.599 67.165 63.316 94.291 95.727 88.08 88.08 1 All chi-square differences were significant at the 0.001 level
The SEM result is presented in Figure 8. The goodness of fit of the model is Chi-square/df = 1.510, CFI = 0.916, RMSEA = 0.040 indicating that the proposed research model does fit the data well. In terms of research hypotheses, except those pertaining to the dashed line on the figure, the remaining hypotheses are supported by the dataset. In addition, the coefficients of R2 for performance indicators are quite high, 59.9% for OP, 58.9% for CS, 34.5% for operating cost and business performance is 67.4%.
DISCUSSION OF FINDINGS
Quang, H. T. and Castro, R. d. (2017). Impact of supply chain alignment on construction performance: A developed model for Vietnam. International Journal of Construction Supply Chain Management Vol. 7, No. 2 (pp. 68-92). DOI: 10.14424/ijcscm702017-68-92
84 The centre of the model is processes of material flow and which include the main activities of a firm. In this flow, the process of product/service design, when well implemented, is able to increase the effectiveness of operations processes and logistic activities. Moreover, smooth operations can change 73.7% performance of logistics activities, implying an internal alignment between processes on material flow or of a firm (Van Hoek & Mitchell, 2006).
Product/Service Design Manufacturing/
Operating Logistics
*0.131 ***0.737
*-0.195
Operational
Performance Customer Satisfaction
Operating Cost
***0.319
***0.54
***0.503 Customer Management
Supplier Management Human Resource
Management
Strategic Planning Management
***0.644
Supplier Performance
Process Efficiency
Operating Results
0.767
Chi-square/df = 1.510 CFI = .916
RMSEA = .040
Business Performance H5c2
H5d
.599 .589
.345 .674
Notes: *p<0.1; **p<0.05; ***p<0.01
ENABLERS
SUPPLY CHAIN ALIGNMENT
CASH FLOW
Figure 8: Validated Model
Quang, H. T. and Castro, R. d. (2017). Impact of supply chain alignment on construction performance: A developed model for Vietnam. International Journal of Construction Supply Chain Management Vol. 7, No. 2 (pp. 68-92). DOI: 10.14424/ijcscm702017-68-92
85 The alignment is also expanded to cash flow. The significant effects of Operational Performance on Customer Satisfaction, Operating Cost and Business Performance indicated that firms focused on shareholders’ values can bring more benefits in terms of satisfying customers, reducing operating costs and increasing business performance.
For the successful alignment of these flows, same as Skipworth et al. (2015) who proved the role of enablers in regard to the alignment of the supply chain, e.g. top management support was shown to be an enabler of both shareholder and customer alignment, while organisation structure, information sharing and performance measurement system enabled shareholder alignment, while internal relational behaviour enabled customer alignment. In this study, strategic planning management and human resource management known as infrastructure practices, are able to create a supportive environment for the alignment of the SC processes. While Strategic Planning Management assures SC processes are directed towards common SC goals, members share the same vision; the practice of Human Resource Management helps employees to have knowledge and skill to operate processes smoothly. The interaction between enablers is also “a highlight” of this study as Wilding et al. (2012) suggested that: although each of the enablers is argued to positively affect shareholder and customer value, their interactions with one another are not well supported in the literature, either theoretically or empirically, and therefore this could be an area for further research.
Empirical evidence from Vietnamese construction enterprises showed that the proposed SC alignment can explain 59.9% Operational Performance, 58.9% Customer Satisfaction, 34.5% Operating Cost and 67.4% Business Performance, respectively. These results confirm findings of Skipworth et al. (2015), that customer alignment has a direct positive impact on business performance, while shareholder alignment is its antecedent.
Hence, it is capable of confirming that SC alignment can explain most of the variance in performance. The rates found in this study are remarkably significant because performance is also affected by numerous external factors, (e.g. politics, economics, risks, etc.,) which have not been examined in this paper. In other words, in the same political and economic conditions and with the same risk factors etc., those firms better able to align processes/flows in the chain will gain more benefits.
In this study, conversely, there are some relationships insignificant. This does not mean that there is no alignment between the pairings of these processes. The alignment, in this case, can be indirect throughout relationships/ alignments with other processes. For instance, the relationship between strategic planning management and the manufacturing/ operating process is not supported in this work. However, strategic planning management does impact on the product/service design process, thereby increasing the effectiveness of the manufacturing/ operating process.
Another interesting result relates to cash flow where there is no impact from customer satisfaction on operating cost or on business performance, nor is the relationship between operating cost and business performance significant. These results imply that customer satisfaction, operating cost and business performance are three independent objectives of a firm. This is an important implication in understanding companies’ mission statements.
Quang, H. T. and Castro, R. d. (2017). Impact of supply chain alignment on construction performance: A developed model for Vietnam. International Journal of Construction Supply Chain Management Vol. 7, No. 2 (pp. 68-92). DOI: 10.14424/ijcscm702017-68-92
86 actions, might hinder alignment efforts in supply chains (Singh & Power, 2009). Gardner and Cooper (2003) suggested that “the way to do something is dependent on the way it is designed.” Therefore, in the effort to overcome this challenge, the proposed conceptual model could be used as a “roadmap” for aligning SC, starting from the left side.
A company aligns its partners’ interests with its own by redefining the terms of its relationships so that the firms share risks, costs, and rewards equitably (Wilding et al., 2012). This requires good strategies in the entire SC network as this means that all employees in the firm and those firms along the chain work towards common goals (Bechtel & Jayaram, 1997a). The roles and responsibilities of each partner are clearly defined so that there is no scope for conflict (Sufian & Monideepa, 2013). In doing so, information flow plays an important role as it brings trading partners together (Hong et al., 2012). The company should pay careful attention to understanding customer expectations and market opportunities, communicate well with a limited number of certified suppliers and integrate partners into the firm’s activities (Hülsmann & Windt, 2007).
In our roadmap, moreover, material flow is the main area where the key activities of the firm are contained. In line with aligning processes of this flow, it is imperative, as the first step to achieving this objective, to increase the efficiency of the design process in advance. Using modular design for component parts and standard components, ensuring simplification and clarity of product/service are implicated to fulfilling this purpose (Amy, 2003; Barbara B. Flynn et al., 1995; Kannan & Tan, 2005; Tan, 2001). Subsequently, statistical techniques, automatic processes, and preventive equipment maintenance should be applied to identify problems in manufacturing/operating processes (Forker et al., 1997; Saraph et al., 1989). Finally, decisions of location, delivery dates, and order size need to be considered carefully (Leuschner et al., 2014). The results of implementing these three main processes will directly affect performance, increasing the alignment between material and cash flow.
CONCLUSION
There are many articles describing the benefits and advantages of alignment in an SC environment, but none explain how this alignment is to be achieved, what the processes are that have to be aligned and what the connections between flows are. This study developed a framework to better understand supply chain alignment. The resulting framework was based on a review of the literature and links within and between flows. It is consistent and has been statistically validated by empirical data from the Vietnam construction sector. According to the research results, the model can explain a 59.9% variance in Operational Performance, 58.9% in Customer Satisfaction, 34.5% in Operating Cost and 67.4% in Business Performance. The findings from this study add a new step to the knowledge of SC benefits and could be used as “a road-map” to obtain them.
As mentioned above, SC alignment is a widespread concept that cannot be covered in only one or a few studies. Thus, to pave the way for a more comprehensive view, future research could use the proposed model and test it in other contexts. It is worth noting that there are some relationships that are not supported in these empirical studies, so comparing results from different contexts to consolidate the relationships established here is imperative.
Quang, H. T. and Castro, R. d. (2017). Impact of supply chain alignment on construction performance: A developed model for Vietnam. International Journal of Construction Supply Chain Management Vol. 7, No. 2 (pp. 68-92). DOI: 10.14424/ijcscm702017-68-92
87 into a single model would provide a thorough view of SCM. For instance, further work could test the relationship among these three concepts or compare their role in improving firm/SC performance.
Finally, in the scope of this research, external factors such as political policies, economics, risks, have not been integrated into the model. Thus further research could examine the role that these external factors have in SC alignment. Such discussions signal the new directions that future work could take.
ACKNOWLEDGEMENT
This project has been funded with support from the European Commission. This publication reflects the views only of the author, and the Commission cannot be held responsible for any use which may be made of the information contained therein.
REFERENCES
Amy, Z. Z. (2003). Global sourcing: process and design for efficient management. Supply Chain Management: An International Journal, 8(4), 367-379.
https://doi.org/10.1108/13598540310490125
Anderson, E. W., Fornell, C. & Lehmann, D. R. (1994). Customer satisfaction, market share, and profitability: Findings from Sweden. The Journal of Marketing, 58(3), 53-66.
https://doi.org/10.2307/1252310
Anderson, J. C., Rungtusanatham, M., Schroeder, R. G. & Devaraj, S. (1995). A path analytic model of a theory of quality management underlying the Deming management method: Preliminary empirical findings. Decision Sciences, 26(5), 637-658.
https://doi.org/10.1111/j.1540-5915.1995.tb01444.x
Bagchi, P. K., Ha, B.-C., Skjoett-Larsen, T. & Soerensen, L. B. (2003). Organizational integration in supply chains. Paper presented at the Proceedings of the 15th Annual Conference for Nordic Researchers in Logistics, Nofoma 2003, 12-13 June, Oulu, Finland.
Bagozzi, R. P. & Yi, Y. (2012). Specification, evaluation, and interpretation of structural equation models. Journal of the Academy of Marketing Science, 40(1), 8-34.
https://doi.org/10.1007/s11747-011-0278-x
Baier, C., Hartmann, E. & Moser, R. (2008). Strategic alignment and purchasing efficacy: An exploratory analysis of their impact on financial performance. Journal of Supply Chain Management, 44(4), 36-52. https://doi.org/10.1111/j.1745-493X.2008.00071.x
Ballou, R. H. (2007). The evolution and future of logistics and supply chain management. European Business Review, 19(4), 332-348. https://doi.org/10.1108/09555340710760152
Beamon, B. M. (1999). Measuring supply chain performance. International Journal of Operations & Production Management, 19(3), 275-292. https://doi.org/10.1108/01443579910249714
Bechtel, C. & Jayaram, J. (1997a). Supply Chain Management: A strategic perspective. International Journal of Logistics Management, 8(1), 15-34. https://doi.org/10.1108/09574099710805565
Bechtel, C. & Jayaram, J. (1997b). Supply chain management: A strategic perspective. The
Quang, H. T. and Castro, R. d. (2017). Impact of supply chain alignment on construction performance: A developed model for Vietnam. International Journal of Construction Supply Chain Management Vol. 7, No. 2 (pp. 68-92). DOI: 10.14424/ijcscm702017-68-92
88 https://doi.org/10.1108/09574099710805565
Beth, S., Burt, D. N., Copacino, W., Gopal, C., Lee, H. L., Lynch, R. P. & Morris, S. (2003). Supply chain challenges. Building relationships. Harvard Business Review, 81(7), 64-73, 117.
Byrne, B. M. (1998). Structural Equation Modeling with LISREL, PRELIS, and SIMPLIS: Basis Concepts, Application and Programming. Lawrence Erlbaum Associates Inc. Publishers, Mahwah, NJ.
Carter, J. R., Smeltzer, L. R. & Narasimhan, R. (2000). Human resource management within purchasing management: Its relationship to total quality management success. Journal of Supply Chain Management, 36(1), 52-62.
https://doi.org/10.1111/j.1745-493X.2000.tb00077.x
Chan, Y. E., Huff, S. L., Barclay, D. W. & Copeland, D. G. (1997). Business strategic orientation, information systems strategic orientation, and strategic alignment. Information Systems Research, 8(2), 125-150. https://doi.org/10.1287/isre.8.2.125
Chandra, C. (1997). A formal system analysis methodology for a cooperative supply chain. Paper presented at the Proceedings of the Second Annual International Conference on Industrial Engineering Applications and Practice.
Chandra, C. & Kumar, S. (2001). Enterprise architectural framework for supply-chain integration.
Industrial Management & Data Systems, 101(6), 290-304. https://doi.org/10.1108/EUM0000000005578
Christopher, M., Lowson, R. & Peck, H. (2004). Creating agile supply chains in the fashion industry.
International Journal of Retail & Distribution Management, 32(8), 367-376. https://doi.org/10.1108/09590550410546188
Christopher, M, & Peck, H. (2004). Building the resilient supply chain. The International Journal of Logistics Management, 15(2), 1-14. https://doi.org/10.1108/09574090410700275
Croxton, K. L., Garcia-Dastugue, S. J., Lambert, D. M. & Rogers, D. S. (2001). The supply chain management processes. The International Journal of Logistics Management, 12(2), 13-36.
https://doi.org/10.1108/09574090110806271
Eckstein, D., Goellner, M., Blome, C. & Henke, M. (2015). The performance impact of supply chain agility and supply chain adaptability: The moderating effect of product complexity.
International Journal of Production Research, 53(10), 3028-3046. https://doi.org/10.1080/00207543.2014.970707
El Mokadem, M. (2016). ISO 9000 moderation role over supply chain alignment in manufacturing context. Journal of Manufacturing Technology Management, 27(3), 338-363.
https://doi.org/10.1108/JMTM-03-2015-0015
Flynn, B. B., Huo, B. & Zhao, X. (2010). The impact of supply chain integration on performance: A contingency and configuration approach. Journal of Operations Management, 28(1), 58-71. https://doi.org/10.1016/j.jom.2009.06.001
Flynn, B. B., Schroeder, R. G. & Sakakibara, S. (1995). The Impact of Quality Management Practices on Performance and Competitive Advantage. Decision Sciences, 26(5), 659-691.
Quang, H. T. and Castro, R. d. (2017). Impact of supply chain alignment on construction performance: A developed model for Vietnam. International Journal of Construction Supply Chain Management Vol. 7, No. 2 (pp. 68-92). DOI: 10.14424/ijcscm702017-68-92
89 Forker, L. B. (1997). Factors affecting supplier quality performance. Journal of Operations
Management, 15(4), 243-269. https://doi.org/10.1016/S0272-6963(97)00001-6
Forker, L. B., Mendez, D. & Hershauer, J. C. (1997). Total quality management in the supply chain: What is its impact on performance? International Journal of Production Research, 35(6), 1681-1702. https://doi.org/10.1080/002075497195209
Forza, C. & Filippini, R. (1998). TQM impact on quality conformance and customer satisfaction: A causal model. International Journal of Production Economics, 55(1), 1-20.
https://doi.org/10.1016/S0925-5273(98)00007-3
Gardner, J. T. & Cooper, M. C. (2003). Strategic supply chain mapping approaches. Journal of business logistics, 24(2), 37-64. https://doi.org/10.1002/j.2158-1592.2003.tb00045.x
Gerbing, D. W. & Anderson, J. C. (1988). An updated paradigm for scale development incorporating unidimensionality and its assessment. Journal of marketing research, 25(2), 186–192. https://doi.org/10.2307/3172650
Gopalakrishnan, P. (2001). Purchasing and materials management: Tata McGraw-Hill Education.
Hair, J. F., Anderson, R. E., Tatham, R. L. & Black, W. C. (1995). Multivariate data analysis with readings (4th ed.). Prentice Hall: New Jersey.
Hair, J. F., Black, W. C. & Babin, B. J. (2010). RE Anderson Multivariate data analysis: A global perspective: New Jersey, Pearson Prentice Hall,).
Hair, J. F., Gabriel, M. & Patel, V. (2014). AMOS covariance-based structural equation modeling (CB-SEM): Guidelines on its application as a marketing research tool.
Hammer, M. (1990). Reengineering work: don't automate, obliterate. Harvard business review, 68(4), 104-112.
Ho, D. C. K., Duffy, V. G. & Shih, H. M. (1999). An empirical analysis of effective TQM
implementation in the Hong Kong electronics manufacturing industry. Human Factors and Ergonomics in Manufacturing & Service Industries, 9(1), 1-25.
https://doi.org/10.1002/(SICI)1520-6564(199924)9:1<1::AID-HFM1>3.0.CO;2-L
Hong, P., Dobrzykowski, D., Won Park, Y., Qrunfleh, S., Tarafdar, M. & Ragu-Nathan, T. (2012). Examining alignment between supplier management practices and information systems strategy. Benchmarking: An International Journal, 19(4/5), 604-617.
Hülsmann, M. & Windt, K. (2007). Understanding autonomous cooperation and control in logistics: the impact of autonomy on management, information, communication and material flow: Springer Science & Business Media. https://doi.org/10.1007/978-3-540-47450-0
Kannan, V. R. & Tan, K. C. (2005). Just in time, total quality management, and supply chain management: understanding their linkages and impact on business performance. Omega, 33(2), 153-162. https://doi.org/10.1016/j.omega.2004.03.012
Kaynak, H. (2003). The relationship between total quality management practices and their effects on firm performance. Journal of Operations Management, 21(4), 405-435.
https://doi.org/10.1016/S0272-6963(03)00004-4
Kaynak, H. & Hartley, J. L. (2008). A replication and extension of quality management into the supply chain. Journal of Operations Management, 26(4), 468-489.
Quang, H. T. and Castro, R. d. (2017). Impact of supply chain alignment on construction performance: A developed model for Vietnam. International Journal of Construction Supply Chain Management Vol. 7, No. 2 (pp. 68-92). DOI: 10.14424/ijcscm702017-68-92
90 Lado, A. A., Paulraj, A. & Chen, I. J. (2011). Customer focus, supply-chain relational capabilities and
performance: evidence from US manufacturing industries. The International Journal of Logistics Management, 22(2), 202-221. https://doi.org/10.1108/09574091111156550
Lee, H. L. (2004). The triple-A supply chain. Harvard business review, 82(10), 102-113.
Leuschner, R., Carter, C. R., Goldsby, T. J. & Rogers, Z. S. (2014). Third‐Party Logistics: A Meta‐Analytic Review and Investigation of its Impact on Performance. Journal of Supply Chain Management, 50(1), 21-43. https://doi.org/10.1111/jscm.12046
Lummus, R. R. & Vokurka, R. J. (1999). Defining supply chain management: a historical perspective and practical guidelines. Industrial Management & Data Systems, 99(1), 11-17.
https://doi.org/10.1108/02635579910243851
McAfee, R. B., Glassman, M. & Honeycutt, E. D. (2002). The effects of culture and human resource management policies on supply chain management strategy. Journal of Business Logistics, 23(1), 1-18. https://doi.org/10.1002/j.2158-1592.2002.tb00013.x
Ou, C. S., Liu, F. C., Hung, Y. C. & Yen, D. C. (2010). A structural model of supply chain management on firm performance. International Journal of Operations & Production Management, 30(5), 526-545. https://doi.org/10.1108/01443571011039614
Park, S. & Hartley, J. L. (2002). Exploring the effect of supplier management on performance in the Korean automotive supply chain. Journal of Supply Chain Management, 38(1), 46-53. https://doi.org/10.1111/j.1745-493X.2002.tb00129.x
Powell, T. C. (1995). Total quality management as competitive advantage: A review and empirical study. Strategic Management Journal, 16(1), 15-37. https://doi.org/10.1002/smj.4250160105
Qrunfleh, S., Tarafdar, M. & Ragu-Nathan, T. (2012). Examining alignment between supplier management practices and information systems strategy. Benchmarking: An International Journal, 19(4/5), 604-617. https://doi.org/10.1108/14635771211258034
Quang, H. T., Sampaio, P., Carvalho, M. S., Fernandes, A. C., An, D. T. B. & Vilhenac, E. (2016). An extensive structural model of supply chain quality management and firm performance.
International Journal of Quality & Reliability Management, 33(4), 444-464. https://doi.org/10.1108/IJQRM-11-2014-0188
Ralston, P. M., Blackhurst, J., Cantor, D. E. & Crum, M. R. (2015). A structure–conduct–performance perspective of how strategic supply chain integration affects firm performance. Journal of Supply Chain Management, 51(2), 47-64. https://doi.org/10.1111/jscm.12064
Rodrigues, A. M., Stank, T. P. & Lynch, D. F. (2004). Linking strategy, structure, process, and performance in integrated logistics. Journal of business logistics, 25(2), 65-94.
https://doi.org/10.1002/j.2158-1592.2004.tb00182.x