BIBECHANA
A Multidisciplinary Journal of Science, Technology and Mathematics
ISSN 2091-0762 (Print), 2382-5340 (0nline)
Journal homepage: http://nepjol.info/index.php/BIBECHANA
Publisher: Research Council of Science and Technology, Biratnagar, Nepal
A study of far infrared loop at -5
oGalactic latitude around pulsar
J1627-5547
A.K. Jha, B. Aryal
Central Department of Physics, Tribhuvan University, Nepal. Email: [email protected]
Article history: Received 14 October, 2017; Accepted 22 November, 2017 DOI: http://dx.doi.org/10.3126/bibechana.v15i0.18443
This work is licensed under the Creative Commons CC BY-NC License. https://creativecommons.org/licenses/by-nc/4.0/
Abstract
We present physical properties of the core region of infrared loop G329-05 which is found to be located within 1o from the pulsar PSR J1627-5547. The loop has 3-fold reduced flux density than its
surroundings. In the 100 micron infrared map, a new cavity-like isolated far infrared dust structure of core region (size ~0.750 x 0.230 ) is found at R.A. (J2000)= 16h 27m 19.9s & Dec. (J2000) = -56035’14”.
This loop is believed to be formed because of high pressure events occurred in the past. The dust color temperature of the core region is found to lie in the range 25.26 ± 0.09 K to 27.91 ± 0.09 K, whereas the value of dust color temperature increased to 36.72 ± 0.18 K for the outer region. The dust color temperature and dust mass distribution maps showed that the low temperature region has greater density as expected. The dust mass of the core region of the loop is found to be 1.67 x 1027 kg i.e. about 0.00835
Mʘ. The core region of the loop is found to be edge-on (i ˃780) whereas the larger structure is faced-on
(i =00). Possible explanation of results will be presented.
Keywords: ISM; Far infrared loops; Dust color temperature and Dust mass; inclination angle.
1. Introduction
initial mass. We intend to find the physical properties of infrared loop (Kiss et al., 2004 & Koenyves et al., 2007; KK loop here after) near to ATNF pulsar.
In the present work, we intend to find an isolated far infrared cavity nearby pulsar and KK-loop and study its physical properties (dust color temperatures, dust mass, inclination angle, etc). Finally we are interested to understand its formation and evolution. The role of the pulsar in the structure formation will be discussed.
2. Region of Interest
By performing systematic search using the catalogue reported by Kiss et al. [4] and Koenyves et al.[5], we have selected a new cavity-like region close to far infrared cavity GIRL G329-05 for the study. Following are the selection criteria of the loop:
a) The core region of the loop should have flux minima at 100µm IRAS maps, b) the major diameter should be greater than 0.50,
c) should be located within 10 of ATNF pulsar,
d) should lie in the Galactic plane (-200 ˂b˂200), and
e) no diffuse optical emission
The loop is centered at R.A. (J2000) = 16h 27m 19.9s & Dec. (J2000) = -56035’14” prominent cavity is
seen in both bands 60µm and 100µm. The pixel size of the image is 0.80 x 0.80 as shown in fig 1.
Fig. 1: 0.80 x 0.80 IRAS image of our region of interest at 100 micron (a) and 60 micron (b) JPEG
images of G329-05 KK-loop having cavity. The ‘x’ sign in the North-East corner represents the position of pulsar J1627-5547. (Source: Sky view virtual observatory, 2017)
3. Methods
3.1 Dust Color temperature Estimation:
We adopt the method developed by Schnee [7] to calculate the dust color temperature from the IRAS 60μm and 100μm flux densities. For dust color temperature estimation we use the expression as 𝑇𝑑= −96
1
𝑙𝑛{𝑅× 0.6(3+𝛽)} (1)
where R is given
R = F(60 𝜇m)
F(100 𝜇m) (2)
F (60 micron) and F (100 micron) are the flux densities at 60 𝜇m and 100 𝜇m, respectively. In this way we can use equation (1) for the determination of the dust grain temperature (Dupac et al. 2003).
3.1 Dust Mass Estimation
The dust masses are estimated from the IR flux densities. The resulting dust mass depends on the physical and chemical properties of the dust grains, the adopted dust temperature Td and the distance
D to the object [9].
𝑀𝑑𝑢𝑠𝑡 =
4 3
𝑎𝜌 𝑄𝜈[
𝑆𝜈𝐷2
𝐵(𝜈,𝑇)] (3)
Where, 𝑎 = Weighted grain size = 0.1 μm
𝜌 = Grain density= 3000 Kg m−3
𝑄𝜈= grain emissivity = 0 .0010 for 100μm and 0.0046 for 60μm respectively [10].
𝑆𝜈= total flux density of the region whose mass is to be determined
𝑆𝜈 = 𝑓 × 5.288 × 10⁻⁹ MJy/Sr 𝐷 = distance of the structure
𝐵(𝜈, 𝑇) = Planck’s function given by,
𝐵(𝜈, 𝑇) =2ℎ𝜈𝑐23[ 1
𝑒ℎ𝜈𝑘𝑇−1
] (4)
where,
ℎ = Planck’s constant, 𝑐 = velocity of light, 𝜈 = frequency at which the emission is observed &
𝑇 = the average temperatures of the region. Using these values the equation (3) takes the form:
𝑀𝑑𝑢𝑠𝑡= 0.4 [
𝑆𝜈𝐷2
𝐵(𝜈,𝑇)] (5)
We use the equation (5) for the calculation of the dust mass. It is clear from the expression (4) that the value of Planck function 𝐵(𝜈, 𝑇) for longer wavelength is higher than that of the shorter wavelength. Consequently, the range of 𝐵(𝜈, 𝑇) for fixed temperature (says ∆T) goes narrower if wavelength of the images increases [11].
Inclination angle is the angle between the line of sight and normal to the plane of the structure. The inclination angle i of the structure can be determined by the method [12] given by equation (6) below
𝑐𝑜𝑠2𝑖 =[(𝑏 𝑎⁄ )
2 −(𝑞∗)2]
1−(𝑞∗)2 (6)
where 𝑏⁄𝑎 is the axial ratio and q* is the intrinsic flatness. Holmberg used the value of q* to be 0.23 for oblate spheroid.
4. Results and Discussion
Here we present physical properties of a look-like structure that we found at -50 galactic latitude in the
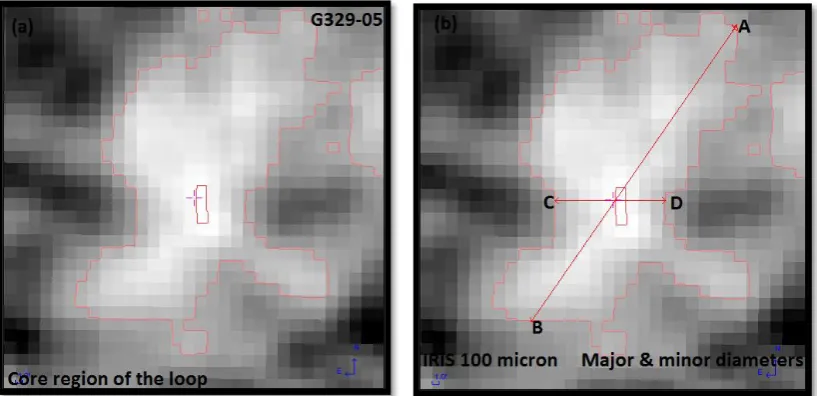
far infrared IRAS maps. Figure (2) shows image of the cavity. In the image, the dark and bright color represents the minimum and maximum values of flux densities, respectively.
IRAS 100µm fits image for RA/Dec(J2000) = 16h27m19.9s /-56035’14” is shown in figure (2), here fig
Fig. 2: Dust structures of the at 100 micron. (a) The contour levels are drawn. The appropriate isocontour is found at 27.92 MJy/sr corresponding to level 82. (b) The lines AB & CD represent the major and minor diameters passing through minimum flux density (flux-minima).
4.1 Dust Color Temperature, Dust Mass and Inclination angle
We calculated dust color temperature of all pixels of the loop. For the calculation of dust color temperature, we adopt the method developed [7] and [8]. The region with minimum and maximum temperature is found to lie in the range of 25.26 ± 0.09 K at R.A. (J2000) = 16h30m17.77s & Dec
(J2000) = -56o 03’51.10” to 27.91 ± 0.09 K at R.A. (J2000) = 16h 31m 12.48s & Dec (J2000) = -56o 29’
19”. An offset of about 2 K suggest that the core of the loop is stable. The average dust temperature calculated using the slope of F(100) and F(60) plot (Figure 3b), is found to be 25.85 K. The minimum temperature region is found to be elongated along East-West direction (Figure 3c). The distribution of dust color temperature fits well with Gaussian (Fig.3e) with Gaussian centre 25.70 K. The value of Td
of the larger structure is found to be 36.72 K. Therefore the cavity is cold (low density) enough at the core region than that of the outer region. An offset of 16 K temperature suggest that the cavity is dynamically active. The dust mass contours (Figure 3d) seems to follow the expected trend: higher density at low temperature region (Fig.3 c, d)
The distribution of Td (Dust color temperature) is well fitted by a Gaussian plot (Figure 3e). The value
of ΔTd of the core region is small which indicates that the dust is mostly in thermal equilibrium
whereas, in outer region the temperature offset is 16K which suggests that the cavity is not in thermal equilibrium.
We used [12] method, equation (6), to calculate the inclination angle of the core and whole loop. The inclination angle of the core and whole loop are found to be 780 and 00 respectively. It means the core
region is edge-on where as outer region of this loop is completely faced-on. The size of the large structure of the KK- loop is 1.40x1.40 [5] where as of the core region is found to be 0.750 x 0.230.
Therefore, the size of the core region of this loop is only about 9 % of the whole loop.
Using the distance of the loop to be 200 pc [13], the dust mass of the cavity is found to be 1.67 x 1027Kg i.e. about 0.00835 M
ʘ by using equation (5). The outflow nature in the core region along
major diameter (north-south direction) has been observed. This is probably due to wind of pulsar J1627-5547 which is situated at a distance of 0.790 from the KK-loop G329-05. Besides this, we
Age and Dispersion measure of the nearby pulsar J1627-5547 is found to be 7.57 x 10⁶ years and
1666.2 cm-3 pc respectively (ATNF pulsar catalogue).
Fig.3 (a): IRAS 100µm far infrared images of the core region of KK-loop G329-05 centered at R.A. (J2000) = 16h27m19.9s, Dec. (J2000) = -560 35’14”.The flux contours are shown which represents
dust color temperature (e) and dust mass (f). The solid curve represents Gaussian fits. The Gaussian parameters are given.
5. Conclusions
We present physical properties of G329-05 dusty loops at far infrared (60 µm and 100 µm) IRAS maps located around ATNF pulsar within 10 radius. The dust color temperature, dust mass, inclination
angle and the size of the core region of the KK- loop are studied and are compared with its larger structures [4, 5] in IRAS maps. We conclude our results as follow:
a) Dust color temperature and dust mass distributions show a very good agreement with Gaussian. However the outer region show relatively higher temperature with an offset of about 16 K than that of its core region, suggesting the loop is dynamically unstable.
b) The inclination angle of the core region is found to be 780, suggesting edge-on appearance. At the
outer region, the inclination angle is found to be 00, i.e. faced-on.
c) The dust mass of the core region is estimated to be 1.67 x 1027 kg, i.e. about 0.00835M ʘ at a
distance 200 pc.
Acknowledgement
We acknowledge our collaborator R. Weinberg, Innsbruck University, Innsbruck, Austria for critical suggestions, University Grant Commission, Nepal to assist financial support for Ph.D. SIMBAD database, Sky view virtual Observatory, ATNF pulsar catalog, IRAS surveys and GIRL catalog. One of the authors (AKJ) acknowledges Central Department of Physics, Tribhuvan University, Nepal for all kinds of support for his Ph.D. work.
References
[1] P.W.J.L. Brand, W.J Zealey, Cloud Structure in the galactic plane-A Cosmic bubble bath, Astronomy & Astrophysics 38 (1975) 363.
[2] Tenorio – Tagle, Bodenheimer, Supernova Explosions inside pre-existing wind driven cavities, spherically symmetric models, Springer & Verlag, Newyork & Berlin (1988) 77-87.
[3] H. Meyerdierks, A. Heithausen, M. Grashoff, The North Celestial Pole Loop, Astronomy & Astrophysics 245 (1991) 247-256.
[4] Cs. Kiss, A. Mor, L.V. Tth, Far-infrared loops in the 2nd Galactic Quadrant, Astronomy & Astrophysics 418 (2004) 131. doi.org/10.1051/0004-6361:20034530.
[5] V. Koenyves, Cs. Kiss, A. Mor, Z.T. Kiss, L.V.Tth, ,Catalogue of far-infrared loops in the Galaxy, Astronomy & Astrophysics 463 (2007) 1227. doi.org/10.1051/0004-6361:20065438.
[6] B. Aryal, C. Rajbahak, R. Weinberger, , A giant dusty bipolar structure around the planetary nebula NGC 1514, Monthly Notices Royal Astron. Soc. 402 (2010) 1307.
doi.org/10.1111/j.1365-2966.2009.15966.x.
[7] S. L. Schnee, , N.A. Ridge, A.A. Goodman, G.L. Jason, , A Complete Look at The Use of IRAS Emission Maps to Estimate Extinction and Dust Temperature. Astrophysical Journal 634 (2005) 442-450.
[8] X. Dupac, J.P. Bernard, N. Boudet, M. Giard, J.M. Lamarre, C. Mny, F. Pajot, , I. Ristorcelli, G. Serra, B. Stepnik, J.P. Torre, ,Inverse Temperature Dependence of the dust sub millimeter spectral index, Astronomy & Astrophysics 404 (2003) L11-L15.
doi.org/10.1051/0004-6361:20030575.
[9] R. H. Hildebrand, The Determination of Cloud Masses and Dust Characteristics from Sub millimeter Thermal Emission, Q. Journal of Royal Astronomical Society 24 (1983) 267-282.
[11] C. A. Beichman, G. Neugebauer, H. J. Habing, P. E. Clegg, T. J Chester, Infrared Astronomical Satellite (IRAS) Catalogues and Atlases I: Explanatory Supplement. US Government Printing Office, Washington (1988).
[12] E. Holmberg, On the Apparent Diameters and the Orientation in Space of Extragalactic Nebulae, Medd. Lund Astron. Obs. Ser. VI, (1946) 117.