RZPRINTED PROMfilhgtEa Cdr Eckardt, P.
Eco -Ph E. (ed.) 1965 - Pike
ysiology; UNESCO Arid Zone Research XAV
SOIL-WATER MOVEMENT IN VAPOUR
AND LIQUID PHASES
by
S. A. TAYLOR and J. W. CARY'
Utah State University, Logan, Utah (United States of America)
INTRODUCTION
One of the well-known characteristics of arid region soils is that the temperature undergoes wide fluctua-tions throughout the day and throughout the season. These temperature variations induce thermal gradients and temperature differences between locations in the surface soil. Although the existence of these effects is well known, their effect on the processes that occur the soil is not so well known. One of the problems at has been of considerable interest in recent years is the influence of temperature differences upon the movement of water in the soil. Early investigators of this problem discovered that there was a net water flux from warm to cold in soil materials subjected to a thermal difference, but they became involved in a controversy as to whether the movement was in the vapour or liquid phase. Some studies supported the concept of flow in the vapour phase, and others sup-ported the concept of flow in the liquid phase. A net flux of vapour from warm to cold and liquid from cold to warm was demonstrated in an enclosed and sealed system of porous material, water, and air by Krischer and Rohnalter (1940). This was later con-firmed for soil material, using a different technique, by Gurr, Marshall and Hutton (1952), but they obtained a vapour diffusion coefficient that was very much great-er than expected on the basis of simple laws of diffu-sion. Similar studies in sealed s ystems, using still different techniques, were reported by Taylor and Cavazza (1954), who found that the apparent vapour diffusion coefficient was ten times larger than expected on the basis of simple diffusion laws. Subsequently,. there have been repeated observations of this effect, and several attempts to explain the phenomena based on various anal yses of simultaneous movement of water and heat (Philip and Dc Vries. 1957; De Vries, 1958; Derjaguin and Melnikova, 1958).
The movement of water and heat in cotton bales as successfully explained by Henry (1939) on a theor y
that included a coupled diffusion coefficient that resulted in a higher diffusion of one material and a lower rate for the other. It appears that a similar concept was never seriously applied to the soil problem until Taylor and Cary (1960) demonstrated a coupled flow of water and heat through a saturated soil sample. Such coupling was later demonstrated by Cary (1961) to occur for both the liquid and vapour flow through unsaturated soil materials.
The method and experimental basis for separating the liquid from the vapour flow reported here is based on a concept originally suggested and used by Cary (1961). Since methodology is the primary interest of this symposium, the procedure for measuring and separating the liquid and vapour flow of water in soil material that is subjected to a temperature differ-ence under conditions of constant pressure and matric potential is considered in considerable detail.
THEORETICAL BASIS
A column of soil containing water will transmit both water and heat when it is subjected to a temperature difference across its two ends. If the soil is unsaturated, the water flux, Jtc, may be divided into a vapour flux, J!,, and a liquid flux, J4,,
J„= + J;r ( 1 )
If the soil is saturated, the entire flow is in the liquid phase and Jr = 0. If there is a vapour gap, the flow across it must be in the gaseous phase, and = 0. The heat can be transmitted by three processes; the heat carried by the flowing vapour, J,, that carried 1. At the time of this writing, Professor Taylor is on leave from Utah State University studying thermodynamics of irreversible processes at the Usti-versitii Libre de Bruxelles (Belgium) under a National Science Foundation Senior Post Doctoral Fellowship. The junior author is • research soil scien-tist. Southwest SWCRD, Agricultural Research Service, USDA. The paper is published with the approval of the director, Utah Agricultural Experi-:nem. Station, as journal paper No. 240.
,s+ .r.runronmentat jactorsiracteurs au milieu ambluni
by the flowing liquid, and that which moves by ordinary thermal conduction of soil constituents independent of any fluid flow,
The heat flux that is attributable to water that evaporates from the warm side of a soil sample, moves through it as a vapour, and condenses on the cool side is given by the equation
= Seh TJ: (2)
where 8,11 is the latent heat of vaporization per unit
volume of liquid water at the temperature of the warm side; C, is the heat capacity per unit volume of liquid water evaporating at T, and condensing at
T2 ; and S T is the temperature difference between the warm and cool sides. The flux, J, , is here measured as .the volume of liquid water that is evaporated from a unit cross-sectional area in unit time; when steady state conditions preVail, this is equal to the rate of condensation at the cool side. The heat flux carried by the liquid water is given by
C, ST 4. (3)
The heat flux attributable to thermal conduction of the soil constituents is given by
J = — S T
where L; is the mean phenomenological heat conduction coefficient for the soil constituents. The net flux of heat is expressed by the sum of the above equations J, = 8,hJ: C,8T + — • —87'.T• (5) If we knew the value of L,', it would be possible to calculate J, from the simultaneous measurement of J, and J„ under a known temperature difference. The ordinary Fourier heat conductivity coefficient, K, is related to L,' by the relation (Groot, 1959)
, KT2
L, = (6)
where M is the length of the soil sample.' However, the heat conductivity coefficient that must be used in equation (6) should be independent of any flowing water, and this may not be easily obtained. If the value used for L; is too large, it will result in a liquid flow that is too small, and vice versa. Limits may be set on its value, however, as follows:
Consider that J: = 0, and all water flow occurs in the liquid phase; then J.' = ,T,„. Then equation (5) gives Ja — C, 8T J,,, = —L,' (ST IT') which is the largest value that
-L:
(8 T In can have. The smallest value is found when all of the water transfer is in the vapour phase and .1,', = 0. Then, J, — (8,h4- C,
ST) —L; (ST /T2). Combining these statements we have
8 T
J, — C,8TJ„ — 4 - - J. (SA + T). (7) T2
160
The limits are more narrow if this is done under condi-tions where J and J„, are small.
There is much information that can be determined without knowing or determining the value of J; (or L;).
If stead y state measurements of heat and water fluxes are made simultaneously at constant 8T/T 2, but at different values of 7', then equation (5) may be applied first to the higher temperature and then to the • lower temperature and the difference taken to give,
assuming L; remains constant,
= Sc h A + C„ 8T (8)
where AL, is the difference in net water flux. Equation (8) has only one unknown value, A,/,;; hence, it may be calculated directly. The increase in liquid phase flux may be obtained by applying equation (1 .) under the same conditions as above to give
A J,,, = A J: + A (9)
We can thus calculate the relative increase in vapour and liquid fluxes without knowing the absolute magni-tude of any of the fluxes.
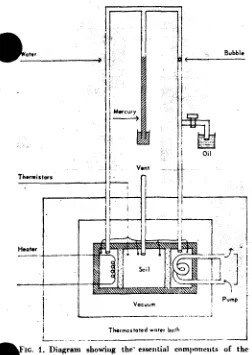
The experimental apparatus was identical with that described by Cary (1961). It consisted of two water chambers that communicate through a soil column as diagrammed in Figure 1. The chambers were held at different temperatures by means of a small electric beater in one chamber and a cooling coil in the other. The water flow through the soil was measured by noting the progress of a mineral oil bubble through an external glass tube of small diameter that connected the two chambers and prevented a pressure difference from developing. In order to hold the matric potential of the soil water constant, porous ceramic plates were placed at each end of the soil column, and a mercury manometer was connected to the bulk water system. The suction on this bulk water was then controlled during any observations. This device assured that the potential of the soil water would be constant, since any effect of changing energy as a result of the temperature difference would be counteracted by a water content difference, thus keeping the total potential, as controlled by the hanging mercury coltimn, constant throughout the system. In order to measure the heat transfer, the entire apparatus was immersed in a vacuum, placed in a water bath, and calibrated as a calorimeter. The heat loss was found by measuring the steady state warm reservoir temperature as a function of electrical energy input while the sample chamber
I, The entire analysis reported here has been done on the basis of the length of the sample of 'soil, but conductisity is usually expressed on the basis of a un i t temperature gradient ; hence, the length of the sample must be intro-doerd if use is to be made of values determined independently.
S. A. Taylor and J. W. Cary Soil-water movement in vapour and liquid phases
was evacuated and the porous plate sealed of to prevent water flow. At a constant cool side temperature a plot of energy input against warm reservoir tempera-ture produced a heat loss calibration curve. Then, with the sample in place, the appropriate heat loss was subtracted from the electrical energy input to give the energy flow which was converted to flux by the application of the appropriate geometrical and time factors. The vent was used to assure constant atmospheric pressure within the soil sample. In practice, the vent was covered with a thin walled rubber pocket (toy balloon) to prevent vapour loss and still permit pressure equilibrium with the atmosphere.
It is experimentally difficult to maintain any pre-determined temperature difference because of the nature of the apparatus; consequently, the general procedure was to place a soil sample in a given condi-tion of packing, water content, and matric potential
in the apparatus; then let a steady state thermal
gradient develop across it. The heat and water flow and temperature distribution were then measured.
Thermostated water both i—
flow 1. Diagram showing the' essential components of the xperimental apparatus used in measuring the simultaneous flow of water and heat through a soil core retained between two porous plates.
3 4 6 7
10-5 Lair'
FIG. 2. The flux of heat J. as a function of the thermal driving force T ITs. The solid lines are approximate curves drawn through the points to smooth the data. The dotted line represents the thermal conductivity of the soil materials independent of any heat conducted by fluid flow.
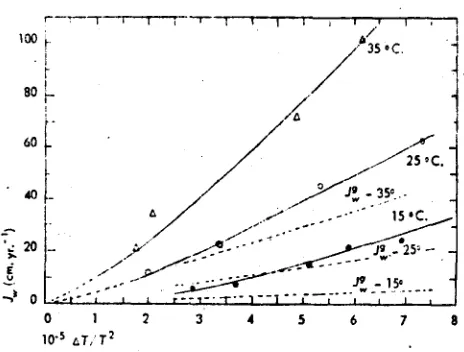
Measurements were made at cool side temperatures of 150, 25°, and 35°C., and at a number of different thermal differences so that curves could be plotted.
ANALYSIS
Water flow measurements were converted to flux of water with dimensions of cm. 3 cm.-2 (of cross sec-tion) vr.- 1 . Measurements were made in terms of liquid water even though part of the flow was in the vapour phase. The year as a unit of time was used in order to have practical and understandable figures and avoid large negative exponents. Heat flow measurements were converted to heat flux in units of millijoules cm.- 2 sec.- 1 . Heat and water fluxes were then plotted as
functions of AT /T 2 as shown in Figures 2 and 3. The
solid curves were drawn as reasonable estimates of probable relation that fit the data. As a first approxi-mation, the curves are either estimated or, if the number of measurements is sufficient, fitted by a least squares analysis of the data. The data for water fluxes are notably more consistent than those for heat fluxes indicating that the accuracy of the method is limited by the accuracy of the heat flux data.
- AT
ID,degrees 15" and 35" 15. Hull 25 . 25 . and 35,
-r
100
80
60
40 _
5. 20
0
I i -T- 111I,I•
A 35 . C.
Jg
a`
Environmental factors1Facteurs du milieu ambiant
TABLE 1. The percentage of the increase in total water flow that moved as vapour across a sample of Millville silt loam soil at a bulk density of 1.39 g.. ern!' and -19 joules/kg. water potential (190 mb. :,nction on the water reservoir)
Temperature turves used ("C.)
3 42 40 39
5 44 48 41
6 43 46 40
(Average 43 ± 3)
at 35°C. is 2,410 joules cm.-3. If we include the
dimen-sional factor to convert J„,' from cm. vr.-1 to cm.
sec.-1, then 8,h = 7.65 x 10⁻⁵. The value of CO 7'
is very close to 1 cal. em.-30C.-1 which gives 18.8 joules
cm.-3 for a 4.5°C. difference 1 which, when combined
with the dimensional factor, becomes 5.98 x 10
-7
.If these data are applied to equations (8) and (9), we get = 27.4 and AL' = 35.1 cm. yr.-1. Thus
the vapour transfer is about 44 per cent, and the liquid transfer is about 56 per cent of the total increase in water that moves across the soil core. If we solve the same equation for the same two temperatures but at AT/7'2 = 3 X 10⁻⁵, we find C2,8 T = 3.58 x
10-and using the appropriate values from Figures 2 10-and 3 we find A,1f, = 13.9 and Af„' 19.3 ens. yr.-1. Thus
42 per cent of the increase in water transferred across the sample was in the vapour phase, and the balance in the liquid phase. A third analysis at A7',72
6 x 10⁻⁵, with 8q, = 7.18 x 10⁻⁷, yields A',
32.8 and AJ„' 43.6 cm. yr.-'. This corresponds to 43 per cent in the vapour and 57 per cent in the liquid phase. In order to check on the validity of the calcu-lations, and in order to improve the accuracy of the estimates, the same calculations were repeated using both additional sets of differences found by using the 150 and 250C. curves and the 250 and 35°C curves.
The results of all of these calculations for this sample are contained in Table 1.
The variation in the data is such that one can detect no difference in measurements either as a result of the temperature differences chosen or the curves used. The fact that the differences for the 15° and 25° curves appear to be higher and those for the 25° and 35° curves lower may be the result of a slight displacement upward of the 25° curve when it was plotted.
ESTIMATION OF SOIL HEAT FLUX The estimation of the heat flux through the soil (equa tion 4) is made by applying the inequality (equation 7) to the 15°C. curve of Figures 2 and 3 at values of -AT/7'2 = 2.5 X 10⁻⁵ to give the limits of 1.86 x 10⁻³
162
0 1 2 3 4 8
10- 5 GT/1' 2
FIG. 3. The water flux J
u
, as a function of the thermal drivingforce AT /7
.2
The solid lines are approximate curves drawn through the points to smooth the data; the dotted lines repre-sent the vapour phase transfer as calculated from the heat flux curves of Figure 2.< -L;
ATIT2
2.1 X 10⁻³. It is highly improbablethat in this situation the water flow will occur entirely in either the liquid or vapour phases; so we should choose an intermediate value. Since the proportion of the increase in water flow that is attributable to the vapour phase does not seem to depend upon either AT or reference 7', the most logical assumption is that the proportion of the transfer that occurs in the vapour phase is the same as the proportion of the increased transfer that occurs in the vapour phase (43 per cent) which leads to
= -L;
ATIP =
2.0 X 10⁻³, and we have confidence (calculated from theabove inequality) that the relation of this value will produce an error in liquid water flux less than --;-1.35 cm. /yr. It is noted that the measurement of is
determined almost entirely by the heat flux measure-ment,
J a.
and is influenced very little by the total water flow since Cv8T.Ii„ is so small in comparisonto 8,h; consequently, any error in estimating L; will show up only in the liquid flux estimate. Therefore, the limits of error described above are considered to be acceptable. The curve for .1; is plotted as the dotted line in Figure 2. The appropriate value of L; is thus found to be 80 joule-degrees /cm.2 sec. Substitution
of this number into equation (5) leads to the, curves that are plotted by the dotted lines in Figure 3. These lines are straight because they were calculated from the
J,
values obtained from the straight lines in Figure 2 thus emphasizing that the accuracy of the method is limited by the precision with whichJa
can be measured. The difference between the dotted curves and the solid curves (Fig. 2) at the same temperature is the water flux that occurs in the liquid phase.•
25°C.
15 • C.
1. The average value of I T when AT/T . is 5 x 10- . ; it varies from 4.2 at 288° to 4.8 at 308°K. but equation (5) is so insensitive to it that the average value it completely adequate
• S. A. Taylor and J. tL . Lary Soil-water morement in vapour and uquta pnases
DISCUSSION
The anal ysis reported above applies to only one soil column at a given bulk density and soil matrie poten-tial, and is intended to illustrate the procedure. Other measurements of conductivity have been made on this same soil at different bulk densities and water potentials. Some of these results (Cary, 1961) indicate that the proportion of the water that is transmitted in the liquid phase in response to a thermal difference increases with the water content of the sample until, in saturated soil, there is no vapour transfer remaining (Taylor and Cary, 1960). It also appears that, as the soil dries out, the proportion of the total water trans-mission that occurs in the vapour phase increases to a maximum that is reached when the amount trans-mitted in the liquid phase becomes negligibly small in comparison.
In sealed systems, such as those described by Gurr, Marshall and Hutton (1952) and Ta ylor and Cavazza (1954), the net steady state water flux in response to a
thermal difference has been equated to the net steady state liquid water flux in response to the induced
water potential difference. This procedure can readily be shown to be valid by extending the methods of Taylor and Cary (1960) to unsaturated soils in which case the difference in water potential, A ,..;), replaces the pressure difference in the resulting equations. However, as we have shown here, there are two components of water flow in the direction of heat flow; one is the
vapour flow and the other is the liquid flow. (There
are also two components in the direction of the induced water potential difference, but that does not concern us at this time.) The liquid phase transfer in response to thermal gradients when no counter water potential is allowed to develop, as reported herein, is certainly not small with respect to the vapour transfer. As pointed out above, the liquid phase transfer accounts for all or nearly all of the thermally induced water transfer in soils that are saturated or nearly saturated. It is true that in sealed unsaturated systems the water potential difference will build up in opposition to the thermally induced transfer until the liquid transfer in response to it will exceed the thermally induced liquid phase transfer, and the net liquid phase flux will be from cold to warm. In fact, the water potential difference will build up until it induces a
transfer that is equal and opposite to the combined thermally induced liquid and vapour transfer. Thus, those in the past, who have attributed all of the
trans-1'4. r from warm to cold to vapour flow, have been in
error by an amount that is the same magnitude as the thermally induced liquid phase flux at constant water
potential. if this erroneous procedure is applied to increasingly wetter soils, the apparent vapour flux
that is required to explain the results increases until it becomes obviously absurd in saturated soils where it would have to become large beyond all reason in order to explain the results that are so easily explained by the inclusion of the thermally induced liquid phase
flux (Taylor and Cary, 1960).
Whether or not the magnitude of the liquid phase flux is adequate to explain the experimentally observed results for any particular sample of unsaturated soil can onl y be determined by observations on that•par-ticular sample under the conditions for which meas-urements were made. Since thermally induced liquid phase transfer is known to be the primary force that opposes flow in response to pressure differences in sealed saturated soil systems, and since its relative importance has been shown herein to be large in unsaturated soil and to vary with the water content, it seems logical that it should be included in any correct analysis of thermally induced flow in soil
systems. It seems probable that thermally induced liquid phase transfer can completely explain the anomalous vapour transfer previously reported, and go even further in simplifying earlier theoretical analyses (Philip and De Vries, 1957; De Vries, 1958) of water flow in unsaturated soils that are subjected
to temperature differences.
A method has recently been proposed (Taylor, 1962) for including the influence of temperature in the flow
equation for water through soil and plant materials. The water flow that results from temperature differ-ences may he divided into vapour and liquid phases by use of the methods proposed herein. In order to do this it is necessary to determine the vapour and liquid
flow that occurs across a given soil in response to unit
temperature gradient as a function of the water poten-tial. Once this is done, the influence of temperature on water flow can be determined by simultaneous mea-surements of water potential and temperature and their gradients.
RESUME
Les mout:ements des eaux du sol en phase vapeur at phase liquide (S. A. Taylor)
L'une des caracteristiques des regions arides est que les sols y sont soumis a de Brands ecarts de temperature,
qui produisent des gradients thermiques de divers genres et d'ampleur variable dans les couches super-ficielles du sol.
Environmental factors/Facteurs du milieu ambiant
rences ou a des gradients de temperature. Les inediocres resultat.s qu'ont donnas les essais de mesure du flux (Feat] travers ces sols s'explique principalement par deux facteurs dont on ne peut tenir convenablement compte dans les equations qui decrivent ce phenomene. Le pre-mier de ces facteurs est que trots coeflicients represen t en t ce flux : le coefficient isothermique pour Tecoulement d'eau, le coefficient isohydrique s (coefficient. de constance d'eau) pour recoulement de chaleur, et le coefficient d'interaction du transfert d'eau et du transfert de chaleur. Les analyses anterieures, fondees sur les lois classiques de la diffusion, ne tiennent compte que des deux premiers de ces coefficients. Le second facteur est que . le transfert en phase liquide pent se stuajouter au transfert en phase vapeur le long (run gradient
thermique sous I'effet du coefficient d'interaction. On a elabore uric t heorie lineaire simple fondee sur la t hermodynantique des processus irreversibles, qui permet tra de dist inguer le transfert de liquide et le transfert de vapeur et d'incorporer les coefficients &interaction. Grace it cette theorie, on pent evaluer Fortin' de grandeur (en regime permanent) du transfert (lean tant it retat liquide qu'a retat de vapeur travers des sols homogenes maintenus a un potentiel hvdrique constant et soumis a tine difference de tem-perature reguliere. L'analyse permet aussi de calculer la ,( chaleur de transfert qui indiquera elle-meme !Influence relative (run gradient (ou d'une difference) de temperature pour une difference ou un gradient de pression (ou de succion).
DISCUSSION
S. DE PARCEVAUX. Dans vos deux exposés, vous avez surtout
developpe vos calculs salon les principes de la therniodyna-mique classique des systemes reversibles en faisant abstrac-tion du facteur temps. Cela est tris valable dans le cas de mesures a l'etat statique.
En realite dans les conditions naturelles, nous sommes toujours loin des conditions de la reversibilite; it faut alors faire intervenir le potentiel efficace ), qui est finalement le moteur des deplacements de l'eau a travers le sol vers la plante.
(Cf. M. HALLAIRE. C. R. Academie des sciences, 12 mars 1962.)
S. A. TAYLOR. In the basic paper which I have presented the
only force causing flow is the temperature difference. This is because the experimental apparatus was carefully designed to keep the constant temperature soil water potential zero. Thus the water potential does not influence the flow. In fact the method was developed as an outgrowth of applying thermodynamics of irreversible processes to the system and is not based upon equilibrium thermodynamics. except that any analysis using thermodynamics of irreversible processes is based on the assumption that the instantaneous condition of water at a point in a system is given by Gibb's expression for entropy as developed for equilibrium thermodynamics. The validity of this assumption and its limitations has been established by Prigogine and Defay (see references in my article, "Measuring soil-water potential"). It can be shown that the instantaneous driving force on water, at constant temperature, is in fact the difference in water potential divided by the temperature. I regret that I am not familiar with the very recent communication of Dr. Ilallaire to which Mr. de Parcevaux refers.
.I• CALEMBERT. Is the Gardner method based on Darcy's
law accurate enough for an ecologist to measure the coefficient of diffusion?
164
S. A. TAYLOR. It can be readily shown that Darcy's law is
valid in saturated soil under isothermal systems providing the composition and bulk density remain constant. In unsa-turated soils the validity of the law becomes increasingly questionable.
Gardner's method of measuring water conductivity in unsaturated soil by outflow from a pressure membrane apparatus consists of a series of approximations. It gives results that are useful but the results may not be exact. There are many factors that influence water flow in natural conditions that cannot be controlled or measured. I would think that the Gardner approximation for measuring diffu-sivity or water conductivity would be as good as many other estimates that ecologists are now making.
P. JARVIS. I have always understood that the term "field capacity" is correctly applied only to a situation in undis-turbed soil in the field. I have always found it difficult to know what term to use for similar conditions in soil in labo-ratory experiments. Since Dr. Taylor used this term in con-. nexion with the soil in his experiments, I should like to ask him if he thinks it is of any value or meaning in such a context. In the literature the term is frequently and, I would have thought, almost always incorrectly, used in connexion with laboratory experiments.
S. A. TAYLOR. The term "field capacity" has no mathematical or precise meaning. It is used only loosely to indicate a range of moisture contents that develop in field soil from one to two days after irrigation or a soaking rainfall. The amount of water retained by a soil that is subjected to a pressure difference of about 0.33 bar (water potential of —33 joules /kg.) usually falls within the range of moisture contents that are usually connected with field capacity.
S. A. Taylor and .1. W . Cary .Soil-tenter movement in vapour and liquid phases
S. A. TAILOR. A saturated soil is one in which all of the poi,.
is filled with water and there is no air prescot in the system. Soil in this condition contains more water than it does after part of the water has drained away.
IL J. BoLCHET. Pour illustrer la question de 111011 eolli•gue
de Pareevaux, je pri•eiserai que M. liallaire a pu montrer one circulation Wean a contre-gradient de potentiel. Ce rimItat en apparenee paradox al s'explique par la notion de potentiel elliratec, qui ajoute au potentiel classique evalue en therm,-d ynatnique reversible un ternie qui tient eompte therm,-de l'irre-versibilite et fait intervenir la vitesse de dessechement. Or, dates les conditions naturelles, les variations de revapotrans-piration potentielle laissent supposer que la notion de ' toter,-tiel efficace va modifier considerablement la circulation de l'eau qu'e ron pourrait &claire de la simple consideration do potentiel capillaire classique.
S. A. TAYLOR. des, when speaking of flow we must consider
all of the forces and all of the fluxes (see Taylor and Cary, 1960). If there is a flow of heat, electricity or any other form
of matter in a direction opposite to the water potential, the water may be made to move in a direction opposite , to its-own potential gradient (Taylor. 1962). Such phenomena are %sell known and eon/limply considered in the basic literature
ou thermodynamies of irreversible processes (Groot, 1959).
COWAN. Could Dr. Taylor comment on the significance of soil thermal conductivity as measured by a probe of the type'nsed by 1). A. de 'Vries. and its relation to the phenome-nological constant, K. employed in his discussion of soil water movement?
S. A. TAY 1.0“. As I recall, the method in question is based upon the rates of heating and subsequent cooling of a probe to which heat is supplied. This method would be influenced by water flow anti would therefore yield a conductivity that depends partially on water flow, whereas the term 14, is independent of water Ilow and depends only upon the conduc-tivity of the dry soil independent of any fluid transfer. The thermal conductivity, K. with which it is related must also be independent of any fluid flow.
BIBLIOGRAPHY BIBLIOGRAPHIE
CARY, J. W. 1961. The interaction of heat and water flow in soils. Ann. Arbor.. Mich., University Microfilms Inc. (Ph.D. thesis, Utah State University, Logan, Utah.)
DERJAGU1N, B. V.: MELNIKOYA, M. K. 1958. Mechanisms of
moisture equilibrium and migration in soils. In: Dater conductivity in soils, P. 43-54. An internal symposium. (Highway research board special report, no. 40.)
GROOT. S. R. 1959. Thermodynamics of irreversible processes. 3rd printing. Amsterdam, North-Holland Publishing Co.
p.
GERR, C. G.; MARSHALL, T. J.; HUTTON, T. J. 1952. Move-ment of water in soil due to a temperature gradient. Soil Sri., vol. 74, p. 335-345.
HANKS, R: J. 1958. Water vapor transfer in dry sod. Proc. Soil Sci. Soc. Amer., vol. 22, p. 372-374.
HENRY, P. S. H. 1939. Diffusion in absorbing media. Proc. roy. Soc., ser. A, vol. 171, p. 215.
KR1sCHER, 0.; ROHNALTER, H. 1940. Wiirmeleitung and Dampdiffusion in feuchten Guten. Verein deutscher Inge-nieure. Forschungsheft, Berlin, vol. 402, no. 11, p. 1-18.
J. R.; VRIEs. I). A. Ile. 1957. Moisture movement in porous materials under temperature gradients. Trans. Amer. geophys. fin., vol. 38, p. 222-232.
SPANNER, I). C. 1954. The active transport of water under temperature gradients. In: . Symposium. Society for Expe-rimental Biology. vol. 8, p. 76-93.
TAYLOR, S. A. 1962. The influence of temperature upon transfer of water in soil systems. Meded. Landblloogesch.,
Ghent, Belgium, vol. 27, no. 2.
CARY, J. W. 1960. Analysis of the simultaneous flow of water and heat or electricity with the thermodynamics of irreversible processes. Transactions of the eighth Inter-national Congress of Soil Science, Madison, Wis., vol. 1, p. 80-90.
CAvAzzA, 'L. 1954. 'The movement of soil moisture in respimse to temperature gradients. Proc. Soil Sri. Soc.
1 noes, vol. 18, p. 351-358.
VRIEs, It A. de. 1958. Simultaneous transfer of heat and moisture in porous media. Trans. Amer. geophys. tin., vol., 39. p. 909-916.