789
Copyright © 2011-15. Vandana Publications. All Rights Reserved.
Volume-5, Issue-3, June-2015
International Journal of Engineering and Management Research
Page Number: 789-796
Multi-Objective Optimization of Turning Process Parameters for
EN353 Material using Taguchi based Grey Relational Analysis
Rahul P. Saindane1, Prof. K. S. Wasankar2
1,2
Department of Mechanical Engineering, Government College of Engineering, Aurangabad, Maharashtra, INDIA
ABSTRACT
This paper outlines an experimental study to optimize cutting parameters during Turning of EN353 case hardened steel under finishing conditions in order to get the minimum surface roughness and maximum material removal rate. L9 orthogonal array based Taguchi optimization technique is used to optimize the effect of various cutting parameter for surface roughness and Material Removal Rate (MRR) of EN 353 work material in turning operation. An orthogonal array, signal to noise (S/N) ratio and analysis of variance (ANOVA) are to be employed to analyze the effects and contributions of depth of cut, feed rate and cutting speed on the response variables. Attempt was further made to simultaneously optimize the machining parameters using Grey relational analysis.The feed rate is the most significant factor for maximize material removal rate and minimize surface roughness. The surface roughness was measured using surface roughness tester (Mitutoyo surftest-SJ210). Material removal rate was calculated using cutting velocity, depth of cut and feed rate.
Keywords— EN353, CNC Lathe, Surface Roughness, MRR, Taguchi, Design of Experiments, Grey Relational Analysis
I.
Introduction
Turning is one of the important machining operations, widely used in most of the manufacturing industries due to its capability of producing complex geometric surfaces with reasonable accuracy and surface finish. In order to build up a bridge between quality and productivity and to achieve the same in an economic way, the present study highlights optimization of CNC turning process parameters to provide better surface finish and high material removal rate (MRR).
In turning operation, it is important to select cutting parameters so achieved. Selection of desired cutting parameters by operator’s experience or using handbook does not ensure that the selected cutting parameters are optimal for a particular machine and environment. The effect of cutting parameters is reflected on surface roughness, surface texture and dimensional deviations of
the product. Surface roughness, which is used to determine and to evaluate the quality of a product, is one of the major quality attributes of a turning product. Surface roughness is a measure of quality of a product which factor greatly influences manufacturing cost. It describes the geometry of the machined surfaces and combined with the surface texture. The surface finish of the machined surface has been identified as quality attribute whereas MRR has been treated as performance index directly related to productivity [5].
Taguchi techniques and statistical analysis are used to optimize machining processes. Taguchi uses experimental design for minimizing variation around a target value and for designing the processes to be robust to environmental conditions and to component variations. Analysis of variance (ANOVA) is use to analyze experimental data for influence of it on output characteristics. This paper presents work using the Taguchi based Grey relational analysis for optimizing a finishing turning process. The objective of the experiment is to optimize cutting parameters so as to get the lowest value of surface roughness and maximum value for material removal rate by the machine during all the machining process.
790
Copyright © 2011-15. Vandana Publications. All Rights Reserved.
coated carbide cutting tools by orthogonal array andanalysis of variance. Thus, Taguchi methodology can be effectively used to optimize process parameters for single performance characteristic only.
However, the optimizations of multiple performance characteristics find more applications. Many authors [7-10] have proposed different methods for solving multiple performance characteristic problems. Mahamani et al.[7] studied tool wear, surface roughness and cutting force in the turning of Al-6061-6% TiB2 in-situ metal matrix composite using GRA. Ramanujam et al. [13] also used desirability function analysis for optimizing multiple performance characteristics namely surface roughness and power consumption in turning Al-15%SiCp metal matrix composites. R. K. Suresh et al. [3] Multi Response Optimization in Turning of AISI 8620 Alloy Steel with CVD Tool Using Desirability Factor Analysis and Grey relational analysis- a comparative study had been done to optimize parameters. The optimal turning parameters are determined by composite desirability index and grey relational grade. Analysis of variance (ANOVA) is used to determine the influence of parameters which significantly affect the responses. Also applied analysis of variance (ANOVA) to study the performance characteristics of machining process parameters such as cutting speed, feed, depth of cut with consideration of multiple responses, i.e. material removal rate, surface finish, tool wear. Taguchi method integrated with grey relation theory for solving multi-objective optimization problem has been proposed by Farhad Kolahan [22] et al.
1.1 Taguchi Method
The Taguchi method is a well-known technique that provides a systematic and efficient methodology for process optimization and this is a powerful tool for the design of high quality systems. Taguchi approach to design of experiments in easy to adopt and apply for users with limited knowledge of statistics, hence gained wide popularity in the engineering and scientific community. This is an engineering methodology for obtaining product and process condition, which are minimally sensitive to the various causes of variation, and which produce high-quality products with low development and manufacturing costs. Traditional experimental design methods are very complicated and difficult to use. Additionally, these methods require a large number of experiments when the number of process parameters increases. In order to minimize the number of tests required, Taguchi experimental design method, a powerful tool for designing high-quality system, was developed by Taguchi. This method uses a design of orthogonal arrays to study the entire parameter space with small number of experiments only. Taguchi recommends analyzing the mean response for each run in the inner array, and he also suggests to analyze variation using an appropriately chosen signal-to-noise ratio (S/N). [5] There are 3 Signal-to-Noise ratios of common interest for optimization of static problems: (a) Smaller-the-better: - S/N (ƞ) = -10logi2} i=1, 2, 3...r (b) Larger-the-better: - S/N (ƞ) = -10logi2} i=1, 2, 3 ...r (c) Nominal-the-best: - S/N (ƞ) = 10log {R2/S2}
Where, Ri is value of surface roughness for the ith trial in r number of tests.
Regardless of category of the performance characteristics, the higher S/N ratio corresponds to a better performance. Therefore, the optimal level of the process parameters is the level with the highest S/N value. The statistical analysis of the data is performed by analysis of variance (ANOVA) to study the contribution of the various factors and interactions and to explore the effects of each process on the observed values.
II.
EXPERIMENTAL SETUP
2.1 Work Piece
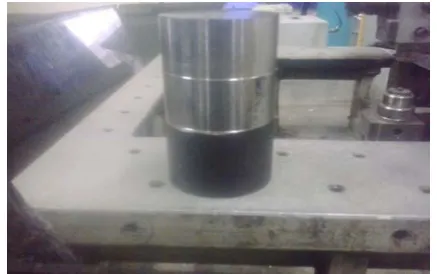
Image 1: EN353 Case Hardened Material
The work piece material is EN353 steel in the form of round bars of 60 mm diameter and length of 100 mm axial cutting length.
The composition of material is
Typical chemical composition of EN 353 Steel
C Mn Cr Si Mo Ni
0.18% 0.93% 1.11% 0.26% 0.11% 1.34%
Table 1: Composition of EN353
EN353 is widely used for Machining components in various industries. This material has significant application in automotive industry. Typical applications of this material are crown wheel, crown pinion, bevel pinion, bevel wheel, timing gears, king pin, pinion shaft, differential turnion etc. The gears especially crown wheel and pinion are one of the most stress prone parts of a vehicle, which are made of EN353 steel. The work piece of EN353 was firstly hardened followed by oil quenching at a temperature of 850°C to achieve a hardness of 60 HRC throughout. A rough turning pass was conducted initially to eliminate the run out of the work piece, after that diameter obtained for experimentation is approximately 60mm.
791
Copyright © 2011-15. Vandana Publications. All Rights Reserved.
Image 2: BXC50 T-CBN ToolCBN insert 2-QP-CNGA120408 BXC50 manufactured by Tungaloy tools. It is suitable for light interrupted to heavy interrupted turning of hardened steels and other hard materials with hardness of 54 to 65 HRC. It features medium grain sized CBN sintered with a special ceramic binder. It is T-CBN grade with special PVD coating layer.
2.3 Machine:
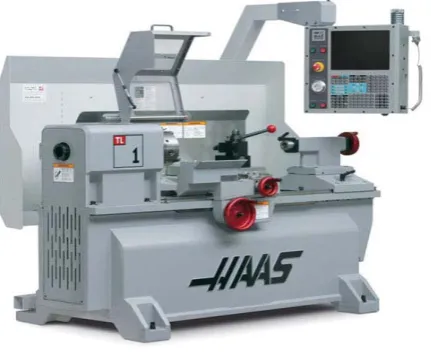
A high speed precision CNC Lathe (HASS - MAKE) having Maximum turning diameter 406mm, Height of centers over carriage 60 mm Maximum turning length: 762mm, Headstock A2-5 / CAMLOCK D1-3’’ Spindle speed 2,000 rev/min, AC motor drive: Power consumption 9kW, Transverse stroke X-axis 209mm, AC motor drive: intermittent torque 4 to 14 Nm Longitudinal stroke, Z-axis 762mm, Number of fixed tool stations/rotating tool stations. Weight of CNC Lathe 1860kg Power Requirement: 9KVA, 1-Phase:240V@40A, 3-Phase: 208V
Image 3: CNC Lathe Machine
2.4 Experimental observations and details
In this study, three machining parameters were selected as control factors, and each parameter was designed to have three levels, denoted 1, 2, and 3 (Table 2). The experimental design was according to an L’9 array based on Taguchi method. The use of Taguchi orthogonal array reduces the number of experiments. A set of
experiments designed using the Taguchi method was conducted to investigate the relation between the process parameters and response factor. Minitab 14 software is used for optimization and graphical analysis of obtained data.
The selection of cutting parameters and orthogonal needed an important consideration in experimental research work. The cutting parameters selected by OVAT analysis are:
792
Copyright © 2011-15. Vandana Publications. All Rights Reserved.
By performing OVAT analysis and from graph itis found that cutting speed, feed rate, depth of cut are influencing parameters on Surface Finish. According to OVAT analysis following input parameters namely cutting speed, feed rate and depth of cut are selected by keeping other process parameters constant at minimum level which is less influencing on surface finish [15]. On the basis of surface finish, the selected levels of input parameters which are as follows.
Table 3: Selection of Levels from OVAT Analysis
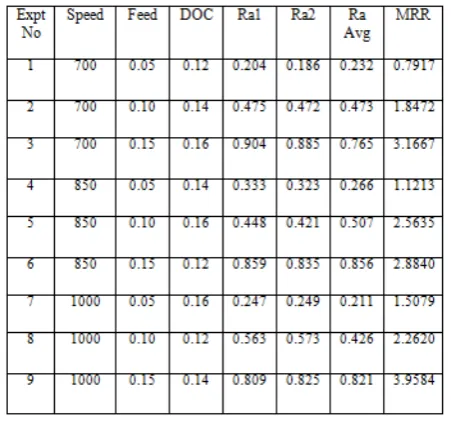
The Material Removal Rate calculations and experimental results of the surface roughness for turning of EN353 with different turning parameters are shown in Table 3.
Table 5: Response Table for Signal to Noise Ratios for Surface Roughness
Table 6: Response Table for Signal to Noise Ratios for Material Removal Rate
Parameters Units Level 1 Level 2 Level 3
Speed (V) rpm 700 850 1000
Feed (F) mm/rev 0.05 0.10 0.15
DOC (D) mm 0.12 0.14 0.16
Level Speed Feed Depth of Cut
1 7.173 12.569 7.151
2 6.251 6.605 6.573
3 7.546 1.797 7.247
Delta (max - min)
1.296 10.772 0.674
Rank 2 1 3
Level Speed Feed Depth of Cut
1 4.4379 0.8444 4.7537
2 6.1237 6.8656 6.0917
3 7.5359 10.3875 7.2521
Delta (max - min)
3.0980 9.5431 2.4984
793
Copyright © 2011-15. Vandana Publications. All Rights Reserved.
III.
GREY RELATIONAL ANALYSIS
GRA is a new analysis method, which has been proposed in the Grey system theory and it is founded by Professor Deng Julong from Huazhong University of Science and Technology, People’s Republic of China. GRA is based on geometrical mathematics, which compliance with the principles of normality, symmetry, entirety, and proximity. GRA is suitable for solving complicated interrelationships between multiple factors and variables and has been successfully applied on cluster analysis, robot path planning, project selection, prediction analysis, performance evaluation, and factor effect evaluation and multiple criteria decision [17]. Detailed explanation about GRA method is presented in the following section.
A. Taguchi based Grey relation analysis:
Regardless of the category of the performance characteristics, the higher S/N ratio corresponds to a better performance. Therefore, the optimal level of the process parameters is the level with the highest S/N value. The statistical analysis of the data is performed by analysis of variance (ANOVA) to study the contribution of the various factors and interactions and to explore the effects of each process on the observed values. The use of Taguchi method with grey relational analysis to optimize the turning process with multiple performance characteristics includes the following steps [6]:
1. Identify the performance characteristics and cutting parameters to be evaluated.
2. Determine the number of levels for the process parameters.
3. Select the appropriate orthogonal array and assign the cutting parameters to the orthogonal array.
4. Conduct the experiments based on the arrangement of the orthogonal array.
5. Normalize the experiment results of surface roughness and metal removal rate.
6. Perform the grey relational generating and calculate the grey relational coefficient.
7. Calculate the grey relational grade by averaging the grey relational coefficient.
8. Analyze the experimental results using the grey relational grade and statistical ANOVA. 9. Select the optimal levels of cutting parameters. B. Data Pre-processing:
In grey relational analysis, the data pre-processing is the first step performed to normalize the random grey data with different measurement units to transform them to dimensionless parameters. Thus, data pre-processing converts the original sequences to a set of comparable sequences. Experimental data i.e. measured features of quality characteristics of the product are first normalized ranging from zero to one. This process is known as grey relational generation [6].
In grey relational generation, the normalized data corresponding to lower-the-better (LB) criterion can be expressed as:
For higher-the-better (HB) criterion, the normalized data can be expressed as:
Where,
and are the normalized data and observed
data, respectively, for experiment using response. The smallest and largest values of in the response are and , respectively.
After pre-processing the data, the grey relation coefficient (GRC) for the response characteristics in the experiment can be expressed as following:
Where,
• = denotes reference sequence.
• = denotes the comparability sequence
• [0, 1] is the distinguishing factor; 0.5 is widely accepted.
• = difference in absolute
value between and
• =
=
smallest value of .
• =
= largest value of .
After calculating GRC, the grey relational grade (GRG) is obtained as:
Here is the Grey Relational Grade, n is the number of responses, m is the number of run and w is the weight factor. We can control the amount of influence of a response in deciding the optimum machining parameters varying the value of w keeping in mind that it should be equal to 1.
794
Copyright © 2011-15. Vandana Publications. All Rights Reserved.
and the given sequence . The Reference Sequencerepresents the best process sequence. Therefore, a higher GRG means that the corresponding parameter combination is closer to the optimal. The mean response for the GRG and the main effect plot of the GRG are very important because the optimal process condition can be evaluated from this plot [11].
From the graphs, it can be said that finest combination values for maximizing the multiple performance characteristics or grey relational grade (GRG) were cutting speed of 1000 rpm, feed rate of 0.05 mm/rev
and depth of cut of 0.14 mm. The response table for the S/N ratios of grey relational grade is shown in Table. 8. ANOVA output of the multiple performance characteristics was given in Table. 10. From the analysis of Table 10, it is concluded that feed rate followed by cutting speed and depth of cut are significantly affecting the grey relational grade.
S = 0.0263331 R-Sq = 98.11% R-Sq(adj) = 92.43%
Table 10: ANOVA for grey relational grade
IV.
CONFORMATION EXPERIMENTS
795
Copyright © 2011-15. Vandana Publications. All Rights Reserved.
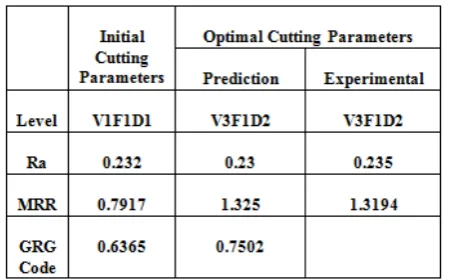
Where, is the total mean from Table 9, isthe mean S/N ratio at optimal level, n is the number of main design parameters that affect the quality characteristics [11]. The purpose of this confirmation experiment is to verify the improvement in the quality characteristics. Based on the above equation, the grey relational grade (GRG) is predicted for the optimal combination of parameters (V3-F1-D2) and its value is 0.7502. Last confirmation test was conducted using the optimum combination of parameters (V3-F1-D2). Table No. 11. Shows the comparison of predicted multiple performance characteristics (GRG) with the actual one.
Applying this relation, predicted values of GRG, MRR and Ra at the optimum conditions are calculated as: 1. 𝛾𝛾 (GRG) = 0.7502
2. 𝛾𝛾 (MRR) = 1.325 mm³/sec 3.𝛾𝛾 (Ra) = 0.23 μm
The robustness of this parameter optimization is verified experimentally. This requires the confirmation run at the predicted optimum conditions. The experiment is conducted twice at the predicted optimum conditions. Verifications:
1. Verification for Material Removal Rate (MRR): The calculated value of MRR at the optimum condition (V3-F1-D2) is 1.3194 mm³/ sec. The error in the predicted optimum value (1.325) and the calculated value (1.3194) is only 1.72%.
2. Verification for Surface Roughness (Ra):
The calculated value of Surface Roughness at the optimum condition (V3-F1-D2) is 0.235 μm. The error in the predicted optimum value (0.23) and the calculated value (0.235) is only 2.13%.
Improvement of Grey Relational Grade: 0.7502 - 0.6365 = 0.1137
Table 11: Comparison of Actual and Predicted Values and Improvement
Hence, so good agreement between the actual and the predicted results is observed. Since the percentage error is less than 5%, it confirms excellent reproducibility of the results. The results show that using the optimal parameter
setting (V3-F1-D2) a higher material removal rate is achieved with lower surface roughness.
V.
CONCLUSIONS
The present work has successfully demonstrated the application of Taguchi based grey relational analysis for multi response optimization of process parameters in Turning of EN353 Case Hardened Steel.
The surface roughness (Ra) and material removal rate (MRR) were measured under different cutting conditions for diverse combinations of machining parameters. The final conclusions arrived, at the end of this work are as follows:
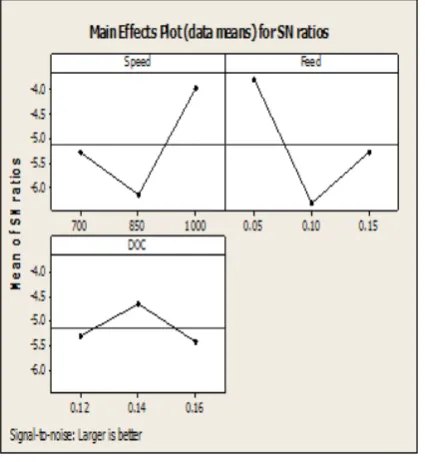
1. The increase in cutting speed produces better surface finish (i.e., surface roughness reduces). The surface roughness decreases from level one to level two and subsequently increases to level three with depth of cut, whereas with increase in feed rate the surface roughness increases throughout.
2. From this analysis, it is revealed that feed rate, depth of cut are prominent factors which affect the turning of EN353 case hardened steel. The feed rate (C= 53.18%) is the most influencing factor in determining the multiple performance characteristics or grey relational grade (GRG) followed by cutting speed (C =39.94%) and depth of cut (C = 4.97%).
3. The best multiple performance characteristics was
obtained with CBN insert when turning EN353 case hardened steel with the higher cutting speed of 1000 rpm, lower feed rate of 0.05 mm/rev and medium depth of cut of 0.14 mm with the estimated multiple performance characteristics (GRG) of 0.7502 & the experimental value of GRG for this combination of parameters is 0.7498.
4. The percentage of error between the predicted and experimental values of the multiple performance characteristics during the confirmation experiments is within 2.13 %.
5. The value of multiple performance characteristics
obtained from confirmation experiment is within the 95% confidence interval of the predicted optimum condition.
Hence it is concluded that feed rate has significant effect on surface roughness.
REFERENCES
[1] P. Jayaraman, L. Mahesh Kumar “Multi-Response Optimization Of Machining Parameters Of Turning Aa6063 T6 Aluminium Alloy Using Grey Relational Analysis In Taguchi Method”, 12th Global Congress On Manufacturing And Management, Gcmm 2014. Procedia Engineering 97 ( 2014 ) 197 – 204
796
Copyright © 2011-15. Vandana Publications. All Rights Reserved.
[3] R.K.Suresh., P.Venkataramaiah., G. Krishnaiah “MultiResponse Optimization in Turning Of Aisi 8620 Alloy Steel with Cvd Tool Using DFA And GRA- A Comparitive Study”, Journal of Production Engineering, Vol 17
[4] Farhad Kolahan, Reza Golmezerji and Masoud Azadi Moghaddam, “Multi Objective Optimization of Turning Process using Grey Relational Analysis and Simulated Annealing Algorithm” Trans Tech Publications, Switzerland, Applied Mechanics and Materials Vols. 110-116 (2012) pp 2926-2932.
[5] Jitendra Thakkar , Mitesh I. Patel, “Optimization of Process Parameters for Surface Roughness and Material Removal Rate for SS 410 Material during Turning Operation” Int. Journal of Engineering Research and Applications www.ijera.com ISSN : 2248-9622, Vol. 4, Issue 2( Version 1), February 2014, pp.235-242
[6] Nikhil Aggarwal and Sushil Kumar Sharma, “Optimization of Machining Parameters in End Milling of AISI H11 Steel Alloy by Taguchi based Grey Relational Analysis” International Journal of Current Engineering and Technology E-ISSN 2277 – 4106, P-ISSN 2347 - 5161 ©2014 INPRESSCO
[7] A.Mahamani, V.Anandakrishnan, “Multi-Response Optimization of Turning Parameters of Al-6061–Tib2 In-Situ Metal Matrix Composite Using Grey-Taguchi Method” International eJournals, International eJournal of Mathematics and Engineering 25 (2010) 246 – 255
[8] G. Sridhara, G. Venkateswarlu, “Multi Objective Optimisation of Turning Process Parameters on EN 8 Steel using Grey Relational Analysis”, I.J. Engineering and Manufacturing, 2014, 4, 14-25
[9] V Vignesh Kumar, K Raja, P Marimuthuc and K Chandrasekaran, “Multi Response Optimization on AISI 410 and EN 19 Steel in Turning Operation using Grey Relational Analysis ”, Int. Journal of Mechanical Engineering and Robotics Research, ISSN 2278 – 0149 Vol. 3, No. 2, April 2014
[10] P. Madhava Reddy, P. Vijaya Bhaskara Reddy, Y. Ashok Kumar Reddy and N. Naresh “Optimization of Machining Parameter for Turning of EN 16 Steel using Grey Based Taguchi method”, ARPN Journal of Engineering and Applied Sciences, , ISSN 1819-6608 VOL. 9, NO. 3, MARCH 2014
[11] Yigit Kazancoglu, Ugur Esme, Melih Bayramoglu, “Multi-Objective Optimization of the Cutting Forces in Turning Operations Using the Grey-Based Taguchi
Method” UDK 621.9.025.5:669.14 ISSN 1580-2949, Original scientific article, MTAEC9, 45(2)105(2011) [12] Junxue Ren, Jinhua Zhou and Jianwei Wei, “Optimization of Cutter Geometric Parameters in End Milling of Titanium Alloy Using the Grey-Taguchi Method” Hindawi Publishing Corporation, Advances in Mechanical Engineering, Article ID 721093
[13] Radhakrishnan Ramanujam, Nambi Muthukrishnan and Ramasamy Raju, “Optimization of Cutting Parameters for Turning Al- SiC(10p) MMC Using ANOVA and Grey Relational Analysis” International Journal of Precision Engineering and Manufacturing Vol. 12, No. 4, Pp. 651-656 August 2011 / 651
[14] A. Al-Refaie, L. Al-Durgham, and N. Bata, “Optimal Parameter Design by Regression Technique and Grey Relational Analysis” Proceedings of the World Congress on Engineering 2010 Vol III WCE 2010, June 30 - July 2, 2010, London, U.K.
[15] M. S. Harne, Manish M. Dandge, “OVAT Analysis for Surface Finish in CNC Turning” International Journal of Innovative Technology and Exploring Engineering (IJITEE) ISSN: 2278-3075, Volume-4 Issue-3, August 2014
[16] B. Satyanarayana, G. Ranga Janardhana, D. Hanumantharao, “Optimized high speed turning on Inconel 718 by using Taguchi based Grey Relational Analysis method”, International Journal of Engineering and Material Science, Vol. 20, August 2013, pp.269-275
[17] K.C Chang and M-F, Yeh, Grey-relational analysis based approach for data clustering, IEEE Proc,_Vis. Image Signal Process., Vol.152,No,2, April 2005, pp165-172. [18] Ilhan Asilturk, Harun Akkus, “Determining the effect of cutting parameters on surface roughness in hard turning using the Taguchi method”, Measurement 44 (2011) 1697– 1704