The Journal of Social Sciences Research
ISSN(e): 2411-9458, ISSN(p): 2413-6670
Vol. 5, Issue. 12, pp: 1714-1722, 2019
URL: https://arpgweb.com/journal/journal/7 DOI: https://doi.org/10.32861/jssr.512.1714.1722
Academic Research Publishing Group
Original Research Open Access
Consumers’ Perception on Food Safety, Labels and Purchasing Decisions in
Mafikeng
L. E. Molefe
Department of Agricultural Economics and Extension, North-West University, Mmabatho 2735, South Africa
A. S. Oyekale
*Department of Agricultural Economics and Extension, North-West University, Mmabatho 2735, South Africa
Abstract
Food safety is an important issue in the whole processes of food utilization and appropriate labelling is very fundamental in guiding consumers‟ decisions. This research was carried out to determine perception of consumers on usefulness of food labels, analyse the factors influencing their perception and determine the factors influencing utilization food labels in their food purchasing decisions. The respondents were randomly sampled and interviewed with structured questionnaire. Data were analyzed with Principal Component Analysis (PCA), Ordinary Least Square (OLS) regression and Probit regression model. Majority of the respondents (56%) were older than 23 years and female (65%). Also, many of the respondents were checking for labels on vegetable oil (54%), eggs (48%), milk (56%) and bread (70%). Majority of the respondents were interested in the expiry dates of vegetable oil (66%), eggs (83%), milk (85%) and bread (86%). Time constraint (32%) and uncertainty about the accuracy of the information (33%) were highlighted as constraints to food label utilization. Perception of importance of food labels was influenced significantly (p<0.01) by label desirability for bread and income. Also, utilization of food labels during food purchases was influenced by being married and household income. It was concluded that consumers were aware of food labels and some efforts were being put into utilization of those labels in their food purchase decisions. .Efforts to promote food safety through utilization of labels should be directed at poor households and those consumers that have not married.
Keywords: Food safety; Food labels; Food utilization; Mafikeng.
CC BY: Creative Commons Attribution License 4.0
1. Introduction
Consumers‟ choice of a commodity is directly related to acceptability of the price tag and evaluation of its quality, judging from different attributes it possesses (Rodríguez et al., 2008). The quality aspect is directly evaluated from the contents of the labels, which most of the times contain information about expiry date, nutrient composition and allergy warnings. Ability to access such quality-driven information on food labels is of paramount importance to the ultimate choice made by a consumer between two products that may possess attributes that meet some similar food demand objectives. Therefore, food labels are of tremendous importance to consumers in obtaining sufficient information on the composition of ingredients that the commodity is made from. Such information is of considerable nutritional and health benefits to consumers and they ultimately define the pathway for consumers‟ evaluation of products based the fundamental slogan of getting “value for money”
According to Hoque et al. (2018), consumers are becoming more knowledgeable on the safety of different food
products they consume given some emerging health problems that have been linked to the type of food and their chemical composition. Furthermore, food labelling promotes public health by facilitating a well-balanced diet and enhancing wellbeing of consumers through direct meeting of desired needs. The information provided is essential in helping consumers in making some informed decisions given their consumption preferences, taste and various other socio-cultural and nutritional considerations.
Traditional theory of demand emphasizes the role of income and price in consumers‟ demand decision. The consumers‟ food demand is determined by several socioeconomic and demographic factors. Furthermore, some basic attributes of the product such as taste and information obtained from the label are also important. Jacobs et al. (2011), reported that ability to read would influence consumers‟ ability to properly utilize label information.
One of the major challenges to food utilization in South Africa is inadequate consumers‟ education on the right type of food to consume in order to maximize health benefits from food intakes. Such education would facilitate consumers‟ consciousness on food labels in order to maximize utility from available array of different food products. Specifically, inability of consumers to understand the usefulness of food labels is very critical problem that warrants empirical investigations. This is because food labels contain significant information on the characteristics of a particular food such as shelf life, country of origin, ingredients composition and storage requirements (Cheftel, 2005). Food labels are often not making the expected impacts because consumers do not base their purchasing decisions on their contents. In some instances, therefore, consumers may buy expired food products or those for which the nutritional composition is at variance with their health requirements.
In the North West Province of South Africa, there is dearth of research on the relevance of food labels to consumers‟ purchasing decisions. Some similar studies that have been conducted in other countries gave some
indications that only few people are reading and using food label information in their purchasing decision (Mahgoub
et al., 2007; Samson, 2012). The information on food labels can help consumers to avoid consumption of food ingredients that they are allergic to. It can also help them to avoid consuming some food constituents such as fats, cholesterol and sodium excessively.
Therefore, proper understanding of information on food labels would facilitate consumers‟ health consciousness that aligns food intakes with some various diseases of eating lifestyles such as cancer, cardiovascular diseases and diabetes. The purpose of this study is to evaluate perception of consumers on the importance of food labels and analyse the influence of food labels on consumers‟ decision to purchase some food products. This study seeks to answer the following research questions: What are the attitudes of consumers towards safety information on food labels? Do consumers‟ socioeconomic and health-related factors influence their perception of the importance of food labels? Do consumers‟ socioeconomic characteristics influence their decision to utilize food labels in their purchasing decisions?
2. Materials and Methods
2.1. The Study Area
The study was conducted in Mafikeng Local Municipality which is located at Ngaka Modiri Molema district of the North West Province. The area is well known for its focus on the production of livestock and crops. The area was divided into 28 wards consisting of 102 villages and suburbs. Mafikeng is on latitude -25.8560° and its longitude is 25.6403° (Moobi and Oladele, 2012).
2.2. Sampling Procedure and Sample Size
Sampling is the process of selecting some part of a population to observe so that one may estimate some statistics about the whole population (Thompson, 2012). For this study, 100 respondents were interviewed with structured questionnaire through simple random sampling. The respondents were selected among students and working class residents in Mafikeng. Primary data were collected using a well-structured questionnaire containing both open and close ended questions. Face-to-face interview was used to interview the respondents. The people that were interviewed were randomly selected from the communities where students reside including Dibate, Unit 2 , Unit 5, Unit 7, Unit 1 and Motlhabeng. Data from questionnaires were coded and analyzed using STATA 12 computer software.
2.3. Methods of Data Analysis
2.3.1. Principal Component Analysis
Composite indicator of perception was computed with Principal Component Analysis (PCA). PCA is an excellent data aggregation method because it is able to extract every unique trend within the variables and combine them in a newly defined variable thereby reducing any tendency of multicollinearity (Lafi and Kaneene, 1992; Smith, 2002). After invoking the pca command in STATA 13, we were able to compute perception indicator by invoking the predict command.
In this study, the indicators were extracted from the section of the questionnaires where consumers were asked to rank the perception of benefits derived from food labels. The questionnaire probed into consumers‟ views on how food label information is important to them and how products with labels are of high quality. Consumers expressed their views on how useful the information concerning nutritional value on products is, how essential food labelling is in making appropriate purchasing decisions, how food labelling helps consumers facilitate their balanced diet planning and the respondents view that health effects are properly highlighted in food labels were the indicators used for PCA analysis. An index was generated after running the pca command in STATA, using predict command..
2.3.2. Ordinary Least Square Regression (OLS)
factor (VIF). Low value of computed VIF implies multicollinearity was not a major problem. The estimated equation is as stated below:
∑
Where are the estimated parameters. is the food labelling importance perception index and is the
stochastic error term. The explanatory variables are in Table 1.
Table-1. Description of explanatory variables of OLS Regression model
Description Expected Sign
Label desirability for bread Yes = 1 0 otherwise +
Age Age of the consumers (years) +
Gender Male = 1, 0 otherwise +/-
Tertiary Tertiary education =1 otherwise=0 +
Married Marital status (Married =1, single=0) +/-
Employed Employed= 1 Students or retired= 0 +/-
Health status Good health = 1, 0 otherwise +/-
Nutrition knowledge Has knowledge of nutrition = 1, 0 others +
Household size Number of household members +/-
Number of workers Number of working members in the household +/-
Income Income of residents (in Rand) +
Shopping How many times do consumers go shopping +/-
2.3.3. Probit Regression
Probit regression model was carried out to analyze the factor influencing consumers‟ utilization of food labels and food safety before purchasing. A yes response was coded as 1 and no was coded as 0. The objective seeks to estimate the probability that a consumer with a particular attributes will fall into one of the specific categories. The estimated model is as defined below:
∑
where Ẏi represented the dependent variable which is utilization of food labels for purchase decision (Yes = 1, 0
otherwise), and are the estimated parameters and ci is the stochastic error term. X‟s represent the included
independent variables which are as defined in Table 1.
3. Results and Discussions
3.1. Demographic Characteristics of Respondents
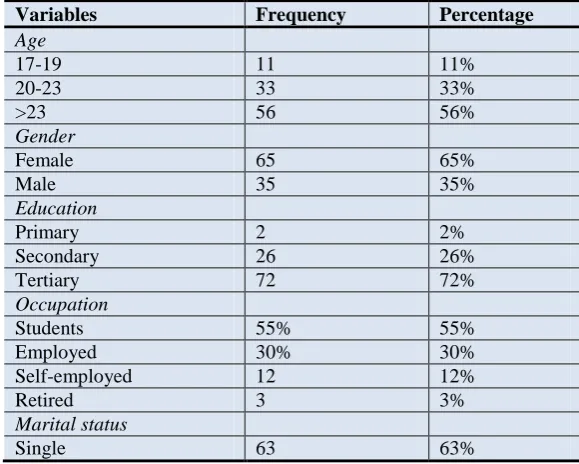
The results in Table 2 show that 11% of the respondents were between the ages of 17-19, 33% were between
20-22 and 56% were less than 23 years. According to a few studies that have been undertaken, age of respondents has little influence on consumers decision to purchase processed food but as they grow older and due to their health
status, they may start to be vert careful of what they consume due to their health status. Werle et al. (2013), stated
that as consumers grow older, their motivation to purchase labelled products gets stronger.
Table-2. Demographic Characteristics of the Respondents
Variables Frequency Percentage
Age
17-19 11 11%
20-23 33 33%
>23 56 56%
Gender
Female 65 65%
Male 35 35%
Education
Primary 2 2%
Secondary 26 26%
Tertiary 72 72%
Occupation
Students 55% 55%
Employed 30% 30%
Self-employed 12 12%
Retired 3 3%
Marital status
Married 26 26%
Separated 11
Household Size
<4 21 21%
4<6 56 56%
6<8 20 20%
>=8 3 3%
Table 2 further shows that 35% of the respondents were males and 65% of the respondents were females.
Women are more concerned with the quality of food consumed compared to males and they are also food purchase decision-makers in households. They have direct contacts with food products that are sold in market whether labelled or not. Furthermore, previous research studies show that majority of households that are dominated by female members consider food labels before purchasing because females are more conscious of what that eat than males (Shine et al., 1997).
The Table also shows that 2% of the respondents had primary education as the highest form of education. These are followed by 26% of the respondents with secondary education and 72% with tertiary education. Education has greater and positive influence on the purchasing decision of consumers. The majority of the respondents were students with 55%, followed by 30% that were employed, 12% were self-employed and 3% were retired. The Table shows that 63% of the respondents were single, 11% were separated and 26% were married. The Table shows that majority of the respondents (56%) had 4to 5 household members.
3.2. Shopping Frequency and Label Reading Habits
Table 3 shows that 39% of the respondents buy food once in a month, 36% do shopping twice, while 25% only
do shopping three or four times per month. Shopping frequency could be positively related to income and the number of members per household (Bawa and Ghosh, 1999). This implies that a household with many members is likely to buy food more often than one with fewer members.
Table-3. Shopping Frequency and Consumers‟ Label Reading Habits for Selected Food Items
Shopping frequency Frequency Percentage
Once 39 39
Twice 36 36
Three-Four times 25 25
Total 100 100
Label Reading on Vegetable Oil
Always 54 54
Sometimes 29 29
Never 17 17
Label Reading on Eggs
Always 48 26
Sometimes 35 35
Never 17 17
Label Reading on Milk and Its Products
Always 56 56
Sometimes 32 32
Never 12 12
Label Reading on Bread
Always 70 44
Sometimes 14 14
Never 16 16
Total 100 100
Table 3 also shows how respondents are involved in reading food labels on vegetable oil. This is based on how
often they consider food labels when they come in contact with new food products. Reading of labels is vital to help them make informed decisions. The results show that majority (56%) of the respondents always check the labels on vegetable oil before they buy, 29% of the respondents always considers the labels sometimes and 17% of the respondents do not read the labels at all. The respondents check the food labels when they are buying food products for the first time, probably to check for any allergy-causing substances and expiry dates. The results also show that 48% of the respondents always check the labels on eggs before they buy, 35% of the respondents consider the labels sometimes and 17% of the respondents do not read the labels at all. For eggs, respondents probably need to check for the grade and expiry dates of the products they are about to buy.
respondents always checks the labels on bread before they buy, 26% often checks the label, 14% of the respondents checks the labels sometimes and 16% of the respondents does not read the labels at all. The respondents check the food labels when they are buying bread and check expiry dates.
3.3. Desirable Information on Food Labels
Table-4. Desirable Food Label Information on Vegetable Oil, Eggs, Milk and Bread
Information list Vegetable oil Egg Milk Bread
% Yes % Yes % Yes % Yes
List of ingredients 41 8 77 59
Net content 45 9 83 23
Name of manufacturer 48 50 85 23
Country origin 55 58 18 30
Storage information 49 52 73 42
Manufacture date 65 74 76 87
Expiry date 66 83 85 86
Storage information 57 72 66 59
Nutrition information 47 71 34 29
Instruction for use 52 32 22 51
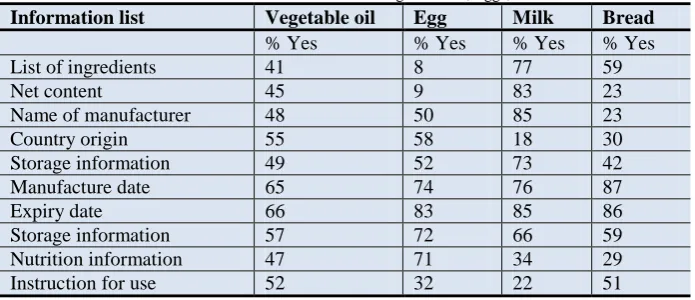
Table 4 shows that 41% of the respondents always considers list of ingredients when buying vegetable oil while
45% of the consumers considers net weights. The names of the manufacturers are considered by 52% of the
respondents and 55% desires to know the country of origin. Vegetable oil storage informationis desirable to 49% of
the respondents while 65% considers the manufacture date. Expiry date is important to 66% of the respondents. Consumers often avoid consumption of expired and spoiled food which may cause major health implications if consumed. In addition, 57% desires to know storage information on vegetable oil and 47% would like to know the nutritional information of oil.
The Table also shows that 8% of the respondents checks the list of ingredients when purchasing eggs and 9% of the respondents considers the net weight. Also, 50% of the respondents considers the name of the manufacturers, while 58% desires to know the country of origin of the eggs. Eggs storage information is desired to know by 52% of the respondents while 74% of the respondents considers the date of manufacturing. The study also reveals that 83% of the respondents viewed expiry date as an important factor when buying eggs, to avoid consuming expired food. Furthermore, 72% desires to know the storage information, and 71% of the respondents desires to know about the nutritional information on eggs and 32% sometimes checks the instruction of use on the product.
The results further show that 77% of the respondents always checks the list of ingredients on the labels when buying milk and 83% considers the net weight. The 85% of the respondents considers the name of manufacturers while 18% desires to know the country of origin where the milk was produced. Milk storage information is desired to be known by 73% of the respondents while 76% of the respondents considers the manufacture date. The study further indicated that 85% of the respondents viewed expiry date as an important factor when buying milk, to avoid consuming expired food. Furthermore, 66% desires to know the storage information, the 34% of the respondent‟s desires to know about the nutrition information eggs and 22% of the respondents sometimes checks the instruction of use on the labels.
The results also revealed that 59% of the respondents always consider list of ingredients when buying vegetable oil while 23% of the consumers consider net weights. The names of the manufacturers are considered by 23% of the respondents and 30% desires to know the country of origin. Bread storage information is desirable to 42% of the respondents while 87% considers the manufacture date. Expiry date is vital to 86% of the respondents. Consumers often avoid to consume expired and spoiled food which may cause major health problems. In addition, 59% desire to know storage information on bread and 29% would like to nutritional information of oil.
3.4. Labelling Information
Table 5 shows that 43% of the respondents are highly informed about food labels and they consider it before
purchasing. Most of the consumers read labels because they want to attain and maintain a healthy lifestyle that is free from food poisoning and other complications that can be caused by consumption of spoiled food. This is in line with a study conducted in the Republic of Ireland (Borgmeier and Westenhoefer, 2009). The influence of labels is highly related with how knowledgeable and informed an individual is regarding food labels and their benefits. Forty two percent of the respondents are moderately informed while 13% are not well informed about food labelling. Two percent of the respondents indicated that they never even bother to go through the labels and this may be due to lack of time when shopping, being familiar with the products they buy and lack of understanding of food labels.
Table-5. Consumers‟ perceptions on usefulness of food label information
Frequency Percentage
Highly informed 43 43
Moderately informed 42 42
Low 13 13
Never 2 2
3.5. Difficulties Encountered when Reading Labels
Table 6 shows the difficulties that respondents experience when reading food label. The results indicate that
33% percent of the respondents reported that they were not sure about the information presented one food labels, 32% reported that they lack time to read the labels and others feel that its time consuming and 21% of the respondents noted that the words and scientific language used on the labels are very difficult for them to understand. The results presented in Table 6 indicate that the majority (77%) feels that the manufacturers should highlight health issues on the labels and believes that a few adjustments can be made to improve the labelling protocol while the minority (23%) believes that the information provided on the labels are already enough . The respondents believes and suggested that alterations be made on contrast between text and background, standardised presentation of information, making labels stand out more, text size, making information easier to understand, simplify everything in the most possible way. Previous research studies show that in 2003, 50% of consumers felt that labels had the correct
amount of information and 51% believed the information on labels was clear (McCarthy et al., 2007).
Table-6. Difficulties encountered when reading food labels and highlighted deficiencies
Difficulties Frequency Percentage
Uncertainty about the accuracy of the information 33 33
Lack of time 32 32
Terminology used 21 21
More health implications of products needed 77 77
Information is sufficient 23 23
3.6. Determinants of Food Labels’ Perceived Importance
Perception index of the importance of food labels was computed using Principal Component Analysis (PCA).
The preliminary results of the principle component analysis are represented in Table 7. The results showed that the
first four components explained 76.27% of the values of the components. In order to generate the final perception indices, predict command was invoked in STATA 13 after the pca command. The graphical distribution of the values of food labels‟ importance perception indices is represented in figure 1.
Table-7. Principal Component Analysis Results for Computing Perception Indices
Component Eigenvalue Difference Proportion Cumulative
Comp1 1.33946 .0877603 0.2232 0.2232
Comp2 1.2517 .244844 0.2086 0.4319
Comp3 1.00685 .0286359 0.1678 0.5997
Comp4 .978216 .159557 0.1630 0.7627
Comp5 .818658 .213535 0.1364 0.8991
Comp6 .605124 0.1009 1.0000
Figure-1. Kernel density distribution of food label importance perception indices
Ordinary Least Square regression was carried out with the level of households‟ perception of the importance of food label being the dependent variable. The average VIF was 1.53. Therefore, there was no presence of multicollinearity among the explanatory variables. Test for heteroscedasticity was also performed using hettest command in STATA 13. The result was statistically insignificant (P>0.05). This implies that heteroscedasticity was
0
.1
.2
.3
.4
D
en
si
ty
-3 -2 -1 0 1 2
Scores for component 1
not a problem. The determinants of perception indices are presented in Table 8. The F-statistics of the Likelihood Ratio Chi Square is 2.38, which is statistically significant at 5%. This means that the estimated parameters for the included independent variables are not jointly equal to zero.
The parameter of label desirability for bread was found to be statistically significant (P<0.01). This implies that respondents that desired comprehensive label on bread (list of ingredients, expiry date, manufacture date etc.) had higher perception of the importance of food labels. Bread as a staple food for many South African households comes in different forms. Some recent health challenges in the country also mandate some consumers to be keen on the nutrient composition and other vital information on the bread they consume. This is expected and follows the previous submissions from some previous studies (Harper et al., 2007; Prinsloo et al., 2012), Roberto et al. (2009) highlighted the usefulness of food labels for commodities that households frequently consume.
Similarly, income level shows statistical significance (p<0.01). This result implies that as income increases by R1.00, food label importance perception index of the respondents increased by 0.4413. This result is expected because as households‟ income increases, it is expected that their perception of the importance of food labels would increase. Similar submission had been made by Pérez-Escamilla and Haldeman (2002). Ollberding et al. (2010), also found that self-reported use of nutritional labels decreased with lower income while healthier consumption was associated with label usage. In many instance, poor households would have no choice than to buy what they could afford, even if the nutritional composition is not going to of any benefit to their health. The result in this study is emphasizing the plight that poverty might subject households to via inability to take keen cognizance of the contents of food as described on food labels.
Table-7. Determinants of food labels importance perception indices
Variables Coefficient Standard error T-statistics Probability level
Label desirability for bread .2267979 .739484 3.07 0.003
Age .0086765 .01434 0.61 0.547
Gender .0190361 .2568123 -0.52 0.941
Tertiary -.1262073 .2446813 0.15 0.607
Married .0474851 .3140976 0.71 0.880
Employed .2188519 .3091248 -0.56 0.481
Health status good -.276095 .4937119 -0.94 0.577
Nutri. Knowledge -.2287447 .2430761 -0.94 0.349
Household size -0407807 .1190895 -0.34 0.733
Number of workers .4413216 .2010151 -0.23 0.818
Income .4413216 .1339724 3.29 0.001
Shopping -.0775254 .1345424 -0.58 0.566
Constant -.3509367 .8098736 -0.43 0.666
Number of observations 100
Prob>F 0.0105
3.7. Probit Regression Results of Use of Labels for Purchase Decision
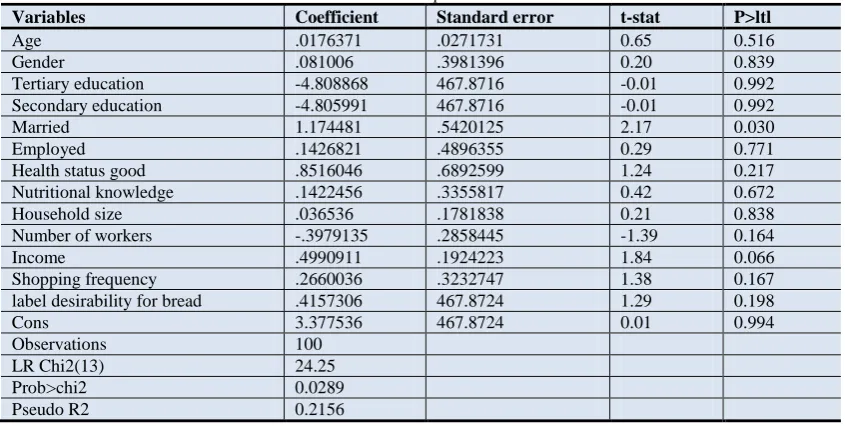
The determinants of households‟ decision to use labels for purchase decision are presented in Table 8. The model produced good fit for the data judging from statistical significance of the Likelihood Ratio Chi Square (p<0.01). This also implies that the estimated parameters are not jointly equal to zero. Income and being married parameters were statically significant (p<0.10). The results show that married people were using labels in their purchase decision when compared with those not married. This may have resulted from underlying need to safeguard children from some allergic contents in food. Also, as income increased, the use of labels also increased. This is also expected and reflects some previous findings by Ollberding et al. (2010).
Table-8. Factors that influence consumer‟ purchase decision based on food labels
Variables Coefficient Standard error t-stat P>ltl
Age .0176371 .0271731 0.65 0.516
Gender .081006 .3981396 0.20 0.839
Tertiary education -4.808868 467.8716 -0.01 0.992
Secondary education -4.805991 467.8716 -0.01 0.992
Married 1.174481 .5420125 2.17 0.030
Employed .1426821 .4896355 0.29 0.771
Health status good .8516046 .6892599 1.24 0.217
Nutritional knowledge .1422456 .3355817 0.42 0.672
Household size .036536 .1781838 0.21 0.838
Number of workers -.3979135 .2858445 -1.39 0.164
Income .4990911 .1924223 1.84 0.066
Shopping frequency .2660036 .3232747 1.38 0.167
label desirability for bread .4157306 467.8724 1.29 0.198
Cons 3.377536 467.8724 0.01 0.994
Observations 100
LR Chi2(13) 24.25
Prob>chi2 0.0289
4. Conclusion and Recommendations
This study evaluates consumers‟ perception on food safety, labelling and purchasing decision. The results revealed that the majority of the consumers were considering the contents on food labels before purchasing vegetable oil, milk, eggs and bread. The important variables from the study was bread and perception index. Some policies issues arising from the study are hereby discussed. First, the Department of Health and food packaging companies should design, formulate and implement special public education programmes with the aim of informing consumers on the importance and significance of food labelling information and how best they can use it to make informed, healthy, beneficial and purchasing choices of food. Government and food labelling policy makers must try and to at least help consumers understand the labelling information on the products by using simple words or terminologies and help consumers understand at least basic and advanced nutritional aspects of food and thus consider nutritional information as important information to consult before deciding to purchase or consume a food product. Policy makers should try to eliminate reported difficulties that are encountered by consumers in reading and using the information presented on food labels and ensure that food labels are presented in such a way that can help and benefit consumers to make informed choices when purchasing food products. Food policy makers should develop a guide that will help consumers read and understand food labels properly. Based on the research findings of the study, it is therefore recommended that all major constraints and hindrances of consumers to the reading of labels revealed in the study should be addressede.
References
Bawa, K. and Ghosh, A. (1999). A model of household grocery shopping behavior. Marketing Letters, 10(2):
149-60.
Borgmeier, I. and Westenhoefer, J. (2009). Impact of different food label formats on healthiness evaluation and food
choice of consumers: a randomized-controlled study. BMC Public Health, 9(1): 1-12.
Cheftel, J. C. (2005). Food and nutrition labelling in the European Union. Food Chemistry, 93(3): 531-50.
Dimara, E. and Skuras, D. (2005). Consumer demand for informative labelling of quality food and drink products: a
European Union case study. Journal of Consumer Marketing, 22(2): 90-100.
Harper, L., Souta, P., Ince, J. and Mckenzie, J. (2007). Food labelling consumer research: What consumers want? A
literature Review. Food standards Agency.
Hoque, M. Z., Alam, M. N. and Nahid, K. A. (2018). Health consciousness and its effect on perceived knowledge,
and belief in the purchase intent of liquid milk: Consumer insights from an emerging market. Foods, 7(9):
150.
Jacobs, S. A., de Beer, H. and Larney, M. (2011). Adult consumers‟ understanding and use of information on food
labels: a study among consumers living in the Potchefstroom and Klerksdorp regions, South Africa. Public
Health Nutrition, 14(3): 510-22.
Krauss, R. M., Eckel, R. H., Howard, B., Appel, L. J., Daniels, S. R., Deckelbaum, R. J., Erdman, J. W., Kris-Etherton, P., Goldberg, I. J. and Kotchen, T. A. (2000). AHA dietary guidelines revision 2000: A statement for healthcare professionals from the nutrition committee of the american heart association. Circulation,
102(8): 2284-99.
Lafi, S. Q. and Kaneene, J. B. (1992). An explanation of the use of principal-components analysis to detect and correct for multicollinearity. Preventive Veterinary Medicine, 13(4): 261-75.
Mahgoub, S., Lesoli, P. and Gobotswang, K. (2007). Awareness and use of nutrition information on food packages
among consumers in Maseru (Lesotho). African Journal of Food, Agriculture Nutrition and Development,
7(6): Available: https://www.ajol.info/index.php/ajfand/article/view/136196
McCarthy, M., Brennan, M., Kelly, A., Ritson, C., De Boer, M. and Thompson, N. (2007). Who is at risk and what do they know? Segmenting a population on their food safety knowledge. Food Quality and Preference,
18(2): 205-17.
Moobi, M. N. and Oladele, O. L. (2012). Factors influencing small-scale farmers‟ participation in informal financial
market in Mafikeng Municipality. Food, Agriculture and Environment, 10(2): 1133-37.
Ollberding, N. J., Wolf, R. L. and Contento, I. (2010). Food label use and its relation to dietary intake among US
adults. Journal of the American Dietetic Association, 110(2010): 1233-37.
Pérez-Escamilla, R. and Haldeman, L. (2002). Food label use modifies association of income with dietary quality. J.
Nutr., 132(4): 768-72.
Prinsloo, N., Van der Merwe, D., Bosman, M. and Eramus, A. C. (2012). Acritical review of the significance of food
labelling during consumer decision making. Journal of Family Ecology and Consumer Sciences/Tydskrif vir
Gesinsekologie en Verbruikerswetenskappe: 40. Available:
https://www.researchgate.net/publication/291005727_A_critical_review_of_the_significance_of_food_labe lling_during_consumer_decision_making
Roberto, C. A., Schwartz, M. B. and Brownell, K. D. (2009). Rationale and evidence for menu labeling legislation.
American Journal of Preventive Medicine, 37(6): 546–51.
Rodríguez, E., Lacaze, V. and Lupín, B., 2008. "Contingent valuation of consumers‟ willingness-to-pay for organic
food in argentina." In 12th Congress of the European Association of Agricultural Economists – EAAE 2008.
Rose, L. D. (2012). Consumers' use and understanding of food label information and effect on their purchasing
decision in ghana; a case study of kumasi metropolis. Asian Journal of Agriculture and Rural Development,
Samson, G. (2012). Awareness of food labelling and use of the information purchasing pre-packaged food products among consumers in Ilala municipality Dares Salaam. Muhimbili University of Health and Allied Sciences.
Shine, A., O'Reilly, S. and O'Sullivan, K. (1997). Consumer use of nutrition labels. British Food Journal, 99(8): 290-96.
Smith, L. I. (2002). A tutorial on principal components analysis. Available:
http://faculty.iiit.ac.in/~mkrishna/PrincipalComponents.pdf
Tessier, S., Edwards, C. A. and Morris, S. E. (2000). Use and knowledge of food labels of shoppers in a city with a
high proportion of heart disease. Journal of Consumer Studies and Home Economics, 24(1): 35-40.
Thompson, S. K. (2012). Sampling. John Wiley and sons.
Werle, C. O. C., Trendel, O. and Ardito, G. (2013). Unhealthy food is not tastier for everybody: The