1
The impact of service fairness dimensions on female customers’ evaluation of critical incidents.
Robyn Ouschan, Curtin University of Technology, R.Ouschan@curtin.edu.au Catherine Archer, Curtin University of Technology,C.Archer@curtin.edu.au
Amy M. Croll, Curtin University of Technology
Key words: female consumers, service fairness perceptions, service outcomes, customer satisfaction, customer dissatisfaction.
Abstract
Women around the world currently control 85% of household spending, yet are most dissatisfied with the service they receive (Silverstein and Sayre 2009). This on-line survey assesses the impact women‟s fairness perceptions have on their satisfaction with the service and purchase intent. It challenges the common stereotype that interactive fairness is a more significant contributor to service evaluations than distributive fairness (service outcomes). The sample included 202 members of a large professional woman‟s association in Western Australia. Factor analysis uncovered two underlying dimensions of fairness (distributive/procedural fairness and interactional fairness). The regression analysis indicates that distributive/procedural fairness has a stronger impact on both satisfaction variables (overall and incident specific) as well as purchase intent. Thus, to improve the service to women, service firms should focus on tailoring service outcomes and processes to better meet the needs of women rather than merely focus on developing the interpersonal skills of frontline staff.
Background and Purpose of the Study
The emergence of the „female economy,‟ colourfully termed by the Boston Consulting Group (Silverstein and Sayre 2009, 6), hold the potential for the creation of vast wealth. However, limited research has been undertaken which explores how female consumers perceive the service especially in terms of service fairness. Nevertheless, evidence is emerging that women are not satisfied with the service they are receiving. In Australia it has been reported that despite the earning potential of women and the decision making power women hold, they are still not receiving the same standard of service compared to men (Foster 1997). A report on „Women as Consumers in Australian Franchised Automotive Dealerships‟ suggests female customers are not treated as genuine customers with the ability to purchase in their own right, or that a significant number of salespeople were uncomfortable with female customers (Martec Australia and Test Purchasing Australia 1994). A subsequent report revealed a large proportion of women are dissatisfied with their car purchasing experience (51%) and car servicing experience (49%) (The way ahead: women and the motor vehicle industry 2001).
2
perceptions, and more specifically, male students (customers) are more likely to give faculty employees higher ratings on fairness (Snipes et al 2006).
Clearly, there is ample evidence that female consumers perceive they are being unfairly treated. Thus, research is warranted to uncover the underlying dimensions of unfairness perceived by females and to develop an understanding of how critical they are in the evaluation of services. This study explores how critical incidents of service encounters (service failures) recalled by women are evaluated in terms of three kinds of fairness: distributive, procedural and interactional. It also assesses the relative impact of these fairness dimensions on overall satisfaction with the service, satisfaction with the critical incident and re-purchase intention.
Hypotheses
Service fairness has commonly been defined in terms of three types of justice (Seiders and Berry 1998): i) distributive justice (refers to the outcome of a decision or an exchange); ii) procedural justice (indicates the process used to generate that outcome); and iii) interactional justice (the interpersonal treatment people receive during this process). Several studies indicate males and females place different emphasis on these three fairness dimensions. Generally they show that men value distributive justice more than women (McColl-Kennedy et al., 2003; Oakley, 2000; Palmer, 2000; Iacobucci & Ostrom, 1993; Helgesen, 1990; Rosener, 1990) whereas women value interactional (McColl-Kennedy et al., 2003; Carlson, 1971) and procedural justice more than men (Sweeney & McFarlin, 1997; Meyers-Levy, 1989). Gender researchers have attributed gender differences between men and women to a variety of social and biological factors (Putrevu 2001). One of the oldest stereotypes of women is their interpersonal sensitivity (Putrevu 2001). In general, women are believed to be more sensitive to relational aspects of a service encounter, whilst men are more sensitive to cost aspects of a service encounter (Iacobucci and Ostrom 1993).
Several empirical studies have linked the service fairness dimensions to customer satisfaction, purchase intent and word of mouth (Maxham and Netermeyer 2002). Even though females may place greater emphasis on interactional fairness, it does not necessarily follow that interactional fairness is the main determinant of how services are evaluated by females. According to Bowen et al (1999), while all three types of customer justice (distributive, procedural and interactional) make significant and independent contributions to customer satisfaction and repurchase intentions; distributive justice is the most important predictor. Thus, this study proposes that distributive justice will also be the strongest predictor for female customers. What differs between males and females is the underlying motivation for distributive fairness. For women it may be more communal and for men more individualistic. More specifically, the following hypotheses are tested:
H1 Procedural and distributive fairness have a stronger positive impact on female customers‟ overall satisfaction with a service compared to interactive fairness.
3
H3 Procedural and distributive fairness have a stronger positive impact on female customers‟ re-purchase intent compared to interactive fairness.
Method and Preliminary Analysis
The sample frame for this study constituted a database of a large association for professional women in Western Australia. The majority of the members have tertiary qualifications (79%) and are aged between 24-45 years. A total of 202 completed surveys were received and based on the number of women who viewed the survey a response rate of 44% was achieved. The perceived fairness measure was adapted from Yi and Gong (2008). The measure contains nine questions presented in Likert scale form (ranging from 1= strongly disagree to 7=strongly agree). They are designed to address three types of fairness dimensions: interactive fairness, distributive fairness and procedural fairness. Respondents were asked to rate the fairness items in relation to the self-reported critical incident described in a preceding section of the survey instrument. The critical incidents the sample of women identified coverd a broad range of industries (automotive, retail, banking, telecommunications, hospitality, healthcare, fitness, transport, other). Exploratory factor analysis was conducted to demine the underlying dimensions of fairness as perceived by this study‟s female customers. The factor analysis results presented in Table 1 and an examination of the scree plot suggest the sample of women only distinguished between two types of fairness. The cross loading item “staff were fair” was eliminated from further analysis.
Table 1: Factor Analysis Results: Customer Perceived Fairness Items
Principal component analysis with Varimax rotation; KMO=0860; For readability; loading s > 0.4 are not listed Perceived Service Fairness Items
Factor Distributional/
Procedural Fairness
Interactional Fairness
The procedures followed by the company were fair 0.816
Regarding policies and procedures, the company handled my encounter
fairly 0.814
The company has fair policies and procedures for dealing with
customers 0.797
I feel the company offered an adequate service 0.732
The company offered more than you had expected 0.614
The employee communicated with customers in a respectful manner 0.823
The employee treated customers with dignity 0.822
The employee understood my needs 0.787
Staff were fair 0.542 0.640
Eigen values (initial) 4.832 1.215
4
The single item scale used by Brush and Sweeney (1996) was employed to measure the satisfaction with the critical incident respondents deemed to be unfair. The scale ranged from 7=”extremely satisfied” to 1= “extremely dissatisfied”. The items for the overall satisfaction and purchase intent measures were derived from Maxham and Netemeyer (2002). Both scales were presented in Likert scale format (ranging from 1= strongly disagree to 7=strongly agree) and included the following items:
1. Overall satisfaction with the service:
i) I am satisfied with my overall experience with the service provider. ii) As a whole, I am not satisfied with the service provider.
iii) I am satisfied with the overall quality of service by the provider. 2. Purchase Intent
i) I intend to use the same service provider in the future.
ii) I am likely to re-use the same service from the same service provider. iii) In the near future, I would not use the same service provider.
Cronbach alpha analysis was conducted on each of the multi-item constructs to assess the reliability of the respective items. This resulted in the in the elimination of the following items: i)“The employee understood my needs” (interactional fairness item); ii) “In the near future, I would not use the same service provider”(purchase intention item); and iii)”As a whole, I am not satisfied with the provider” (overall satisfaction with the service item). The Cronbach alpha scores for the constructs used to test the hypotheses were: i) distributive/procedural fairness α = 0.853; ii) interactional fairness α = 0.860.); iii) overall satisfaction with the service α = 0.820 ; and iv) purchase intent α =0.911
Results
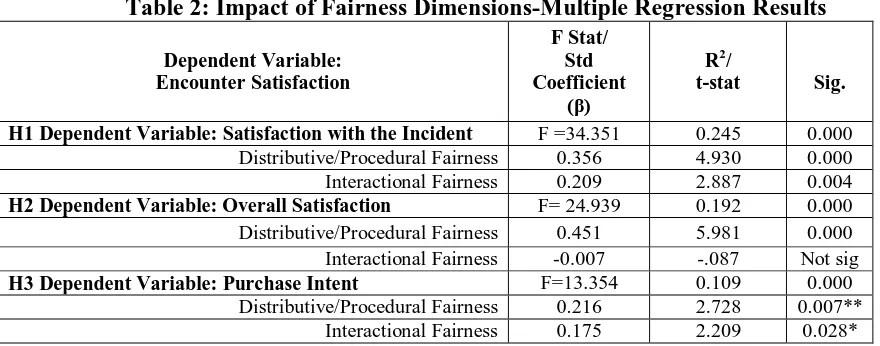
Multiple regression analysis was used to test the three hypotheses of this study. Because the factor analysis indicated that there are only two fairness dimensions (i.e., distributive fairness and procedural fairness items loaded on one factor) the regression equation only contained two independent variables: i) distributive/procedural fairness and ii) interactional fairness. Satisfaction with the incident, overall satisfaction with the service and purchase intent were entered as the depended variables. A summary of the results are presented in Table 2.
Table 2: Impact of Fairness Dimensions-Multiple Regression Results
Dependent Variable: Encounter Satisfaction
F Stat/ Std Coefficient
(β)
R2/
t-stat Sig.
H1 Dependent Variable:Satisfaction with the Incident F =34.351 0.245 0.000
Distributive/Procedural Fairness 0.356 4.930 0.000 Interactional Fairness 0.209 2.887 0.004
H2 Dependent Variable:Overall Satisfaction F= 24.939 0.192 0.000
Distributive/Procedural Fairness 0.451 5.981 0.000 Interactional Fairness -0.007 -.087 Not sig
H3 Dependent Variable: Purchase Intent F=13.354 0.109 0.000
5
Whilst the results in Table 2 show interactional fairness has a significant influence on the satisfaction with the critical incident and purchase intent, the higher β coefficients in Table 2 for the independent distributive and procedural fairness, indicates it is a stronger predictor of all three dependent variables: i) satisfaction with the critical incident, ii) overall satisfaction of the service and iii) purchase intent. Thus, all three hypotheses are supported. It is noteworthy that interactional fairness does not appear to influence female customers overall satisfaction with the service.
Implications and Conclusions
This study shows the female customers perceive the distributive fairness items and procedural fairness items as a single fairness dimension. There appears to be some confusion about the operational definition of these constructs. For example, Severt and Rompf (2006) classifies “I got what I expected” as a procedural fairness outcome, whereas Yi and Gong (2008) categorized a similar item “The company offered more than you had expected” as distributive fairness. Furthermore, according to Severt and Rompf (2006) “the process was fair” represents distributive fairness. In contrast, Yi and Gong (2008) classify “procedures followed by the company were fair” as procedural fairness. This study suggests female customers differentiate between fairness attributed to the organisation and fairness relating to the employees behaviour.
This study bridges an important gap in the services marketing literature, as fairness has not been examined in the critical incident context. Instead, service fairness studies tend to be specific to “service recovery” or “service complaint” situations. This is an important shortcoming as customers zones of tolerance are reduced in service recovery situations (Zeithaml et al 2010) and thus customers may be more sensitive about the fairness of employee actions and company procedures. The results clearly contradict the stereotype that female customers care more about interactional fairness compared to distributional fairness. More specifically, the findings highlight only distributional fairness impacts on female customers‟ overall satisfaction with the service. Thus, interactions with staff only play a significant role when specific incidents are being evaluated (i.e., interaction with staff (interactional fairness) is less relevant when the overall service is evaluated).
6
References
Bowen, D. E., Gilliland, S. W., Folger, R., 1999. HRM and service fairness:
How being fair with employees spills over to customers. Organizational Dynamics 28: 7−23.
Brush, G. J., Sweeney. J.C., 1996. The service encounter: an extended framework for classifying causes of satisfying and dissatisfying incidents. New Zealand Journal of Business 18 (2):43‐66
Carlson, R., 1971. Sex differences in ego functioning: exploratory studies of agency and communion. Journal of Consulting and Clinical Psychology 37(2): 267 – 277.
Foster, A., 1997. Do Women Pay More?. Consumer Law Centre Victoria. Quoted in the way ahead: women and the motor vehicle industry, 2001, 14.
Helgesen, S., 1990. The Female Advantage: Women‟s Ways of Leadership. New York: Doubleday.
Iacobucci, D., Ostrom. A., 1993. Gender differences in the impact of core and relational aspects of services in the evaluation of service encounters. Journal of Consumer Psychology 2(3): 257‐ 286.
Martec Australia and Test Purchasing Australia. 1994. Women as Consumers in Australian Franchised Automotive Dealerships. Quoted in the way ahead: women and the motor vehicle industry, 2001, 14.
Maxham, J.G., Netemeyer, R.J., 2002. Modelling customer perceptions of complaint handling over time: the effects of perceived justice on satisfaction and intent. Journal of Retailing 78: 239 – 252.
McColl‐Kennedy, J. R., Daus, C.D., Sparks, B.A., 2003. The Role of Gender in Reactions to Service Failure and Recovery. Journal of Service Research 6(1): 66‐82.
Meyers‐Levy, J.,1989. "Gender Differences in Information Processing: A Selectivity
Interpretation." In Cognitive and Affective Responses to Advertising. Editors: Patricia Cafferata and Alice Tybout. Lexington, MA: Lexington, 219‐260.
Oakley, J. G., 2000. Gender‐Based Barriers to Senior Management Positions: Understanding the Scarcity of Female CEO‟s. Journal of Business Ethics 27: 321‐34.
Palmer, A., 2000. Equity and repurchase intention following service failure. Journal of Services Marketing 14(6): 513 – 528.
Putrevu, S., 2001. Exploring the origins and information processing differences between men and women: implications for advertisers. Academy of Marketing Science Review 10: 1‐ 14
7
Seiders, K., Berry, L. L., 1998. Service fairness: What it is and why it matters. Academy of Management Executive. 12(2):8‐20.
Silverstein, M.J., Sayre, K., 2009. Women want more. New York: HarperCollins Publishers.
Severt, D. E., Rompf, P.D., 2006. Consumers‟ perceptions of fairness and the resultant effect on customer satisfaction. Journal of Hospitality Management 15(1): 101 – 121.
Snipes, R. L., Thomson, N.F., Oswald, S.L., 2006. Gender bias in customer evaluations of service quality: an empirical investigation. Journal of Services Marketing 20(4): 274 – 278.
Sweeney, P.D., McFarlin, D.B., 1997. Process and outcome: Gender differences in the assessment of justice. Journal of Organisational Behaviour 18: 83‐98.
The way ahead: women and the motor vehicle industry, 2001.
http://www.dpc.nsw.gov.au/__data/assets/pdf_file/0007/81682/The_Way_Ahead_Women_and_ the_Motor_Vehicle_Industry.pdf (accessed July 12, 2011)
Yi, Y., Gong. T., 2008. The effects of customer justice perception and affect on customer