—3
Sprinkler Pattern Radius
7t"Dennis C. Kincaid MEMBER
ASAE
ABSTRACT
A
A mathematical relationship describing the combined of nozzle size, pressure and nozzle discharge on sprinkler pattern radius was proposed and evaluated. The nozzle jet momentum flux was found to be a signifi-cant factor in determining pattern radius. A power func-tion is used to relate the momentum parameter to pat-tern radius. The relationship was evaluated by the use of manufacturers' catalog data and laboratory pattern test data collected at Kimberly, ID. The relationship can be used in computer simulation of sprinkler systems to pre-dict variations in pattern radius with pressure variations due to topography and/or friction losses. The method can also be used to compare the performance of different sprinklers or nozzles and to determine the effect of variables such as nozzle height or jet angle on pattern radius.
INTRODUCTION
The pattern radius of agricultural sprinklers is impor-tant as it determines the wetted area, average application rate, and runoff potential. The area wetted by a sprinkler lateral is approximately proportional to the pattern radi-us. From an economic standpoint, the pattern radius de-termines maximum sprinkler spacing necessary to obtain acceptable uniformity and thus determines equipment costs and/or labor requirements. As energy costs escalate, it becomes more important to be able to analyze the trade-offs between energy and equipment costs. A general relationship between pattern radius and pressure would be helpful in economic optimization.
Computer models have been developed to predict the water distribution from sprinkler systems on variable topography (James, 1982). A simple but relatively general method is needed to adjust pattern radius as pressure varies in these simulation models. The objective of this paper is to propose a method of relating pattern radius to pressure and discharge or nozzle size and to show how this relationship can be used to compare the performance of different types of sprinklers or nozzles.
Bilanski and Kidder (1958) studied the effects of various sprinkler components including pressure and nozzle size on the pattern shape and radius, but made no general conclusions. Segiper (1963) developed standar-dized patterns and related the pattern radius to the pressure head for certain nozzle sizes. Solomon (1980) used a clustering algorithm to group pattern test data in-to typical standard shapes and used pattern radius in-to define a relative distance from the sprinkler. The
Kin-Article was submitted for publication in January 1982; reviewed and approved for publication by the Soil and Water Division of ASAE in June 1982. Presented as ASAE Paper No. PNW-8].
Contribution from the USDA-ARS.
The author is: DENNIS C. KINCAID, Agricultural Engineer, Snake River Conservation Research Center, Kimberly, ID.
caid and Heermann (1969) center pivot model also used dimensionless pattern shapes, but no attempt was made to relate pattern radius to pressure or nozzle size. Recent modifications to this model to calculate the pressure variations due to topography led to this study of sprinkler pattern radius.
A Proposed Pattern Radius Relationship
It was hypothesized that the effects of pressure, discharge and nozzle size on the pattern radius could be combined in one parameter proportional to the jet momentum flux, i.e.,
R f(qV) [1]
where:
R = pattern radius q = nozzle discharge V — jet velocity
Nozzle jet velocity is related to pressure or nozzle size by,
V = ePV2 [2]
or q
V = e d2 [3]
where:
P = nozzle pressure
d = effective nozzle diameter c and e = constants
The momentum flux, qV, can then be written as,
qV eq P1/2 [4]
Of
2
qV =e d 2 [5]
This paper will show that the pattern radius of rotating jet sprinklers can be described by the relationship,
R a (q P 1/2)b
or
R = e(q/c1)f
where the constants, a, b, e and f depend upon the units used for q, p, d and R. Table 1 gives the SI units used here and the customary units normally given in sprinkler catalogs.
The term qP" 2 is converted from the customary to the SI units by multiplying by 9.94, and for practical pur-poses a factor of 10 can be used. This facilitates repre-I61
TABLE 1, UNITS
SI Customary (English)
P d Lim kPa mm gals/min (gpm) lb/in.2(psi) inch feet Discharge Pressure Nozzle diameter Pattern radius
(Ri 14 )2] 1/2 N-2
C8l N
• RainOird 305W1•1 c• Holton F32+33 Vao4
• Senninper 3023-5023
-60 -55
;50
•45 E
•40
-35
X
X
cl(gPro)
ip 20 30 5.0 80
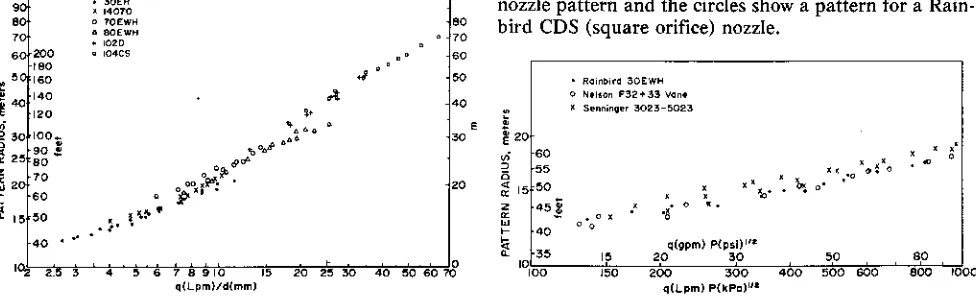
the maximum attainable radius with present equipment. Fig. 1 is presented to show the overall view of the pattern radius relationship. The remainder of the paper will be concerned with the lower portion of the curve (R <20 m)
only, representing medium-sized sprinklers which could be tested in the indoor laboratory.
sentation of the data in both English and SI units, as will be seen.
Pattern Radii for Medium-Large Sprinklers
A statement concerning manufacturers' catalog data is in order. Manufacturers have used both indoor radial, single leg tests and outdoor multiple leg tests to deter-mine pattern radius. A standard method has been tenta-tively adopted by ASAE and the Irrigation Association (ASAE 5398T adopted 1979), but much of the catalog data was developed prior to the adoption of this stan-dard. Also, catalog data may be developed from empiri-cal equations and interpolation methods rather than ac-tual measurements. Thus, care must be exercised when utilizing catalog data.
Equation [7] states that the pattern radius is a func-tion of the ratio of nozzle discharge to nozzle diameter. Fig. 1 shows a plot of selected Rainbird* catalog data using q/d as the abscissa and radius as the ordinate. Several sizes of sprinklers were used from medium-sized agricultural sprinklers through the large gun sprinklers. This plot represents nozzle sizes and pressures from 3.2 mm (1/8 in.) nozzles at 207 kPa (30 psi) through 33 mm (1.3 in.) nozzles at 827 kPa (120 psi). These sprinklers all have 27 deg nozzle trajectory angle except the 102 and 104 guns which have 23 deg angle. Points were plotted throughout the cataloged range of each sprinkler. It can be seen that a general relationship ex-ists, but there are differences between sprinklers. To-ward the upper end of the flow range for each sprinkler, the radius tends to drop below the general curve. This is largely due to higher pressures which cause greater stream breakup and smaller droplets which tend to limit the distance of travel. A sprinkler having a long range tube such as the Model 70 tends to straighten the flow and reduce turbulence and thus produce larger radii than a sprinkler having a shorter tube such as the Model 30. The upper periphery of the data in Fig. 1 represents
*Trade names and company names are included for the benefit of the reader and do not imply any endorsement or preferential treatment of the product listed by the U.S. Department of Agriculture.
100
90- E1°-
71)-60,-200 -t BO
50%160 1-4.140 p- 40 E • 120
.46 6
in
2 30.100..
.8°." 6 .. 6
go 25: 8 o
0 6'A
rt • • 70
08 '94 •
w 20-
le'
1- -60
"- 15450 -40 •
102 2`.5 3 4 5 6 7 8 9 10 1.5 20 21-5 30 40 5:0 io 40_pm}/d(rrim)
FIG. 1 Pattern radius for medium-Iarge sprinklers (Rainhird) vs. discharge/nozzle size ratio. (Date from manufacturers' catalogs)
Comparison of Similar Sprinklers from Different Manufacturers
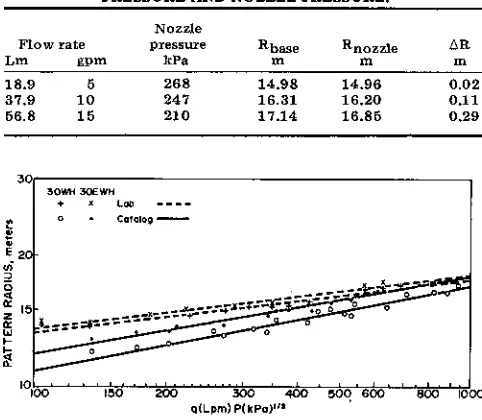
Fig. 1 applies to standard circular nozzles. The rela-tionship of equation [6] is used hereafter since it does not involve nozzle size. This allows comparison of various types of nozzles including noncircular nozzles or orifice nozzles in which the jet size may not be equivalent to the nozzle opening. Fig. 2 shows comparable data from three different manufacturers with similar-sized sprin-klers having 19 mm (3/4 in.) base and 23 to 27 deg noz-zle angles. Table 2 shows values of the regression coeffi-cients a and b and coefficient of determination r2 calculated on log-transformed data (r2 values calculated on nontransformed data were nearly identical), using se-lected catalog data points for each individual sprinkler. Only enough points were plotted in Fig. 2 to show the scatter.
A measure of the goodness of fit of equation [6] to a particular set of N data points is defined by the equation,
where:
s — standard error of estimate
pattern radius estimated by equation [6] Values of s in meters are given in Table 2.
The cataloged radii were higher for the Senninger* sprinkler than for the Rainbird* or Nelson* sprinklers. This may be due to slightly different methods used in testing and determination of pattern radius between manufacturers.
Experimental Verification of Equation [6]
In order to test the pattern radius relationship inde-pendently of catalog data, a series of indoor sprinkler tests were conducted at the Snake River Conservation Research Center, Kimberly, ID. These were indoor radi-al leg tests with collectors spaced at 0.5 m intervradi-als. Sprinklers were allowed to rotate normally in a full cir-cle. Fig. 3 shows two pattern tests using a Rainbird 30H sprinkler. The dots show a typical standard straight bore nozzle pattern and the circles show a pattern for a Rain-bird CDS (square orifice) nozzle.
150 200 300 400 500 600 BOO 1000
q(Lpin)PikPoP ia
FIG. 2 Pattern radius related to pressure and discharge for medium size sprinklers from three manufacturers. (Catalog data)
• 302H 0. 14070 70Er.r4
6 80EWH • 1025 6 104C5 80 70 SO 50 40 30 20
Nozzle Psi
• 5/32 45 CirCUIOr 0 irsto 29 Square
4
3
a
Li 2
o 4 5 6 7 8 9
DISTANCE. rn
2 3 10 II 12 13 14 15 IC
I50 200 300 400 500 C00
oil-pm)PikPoi l "
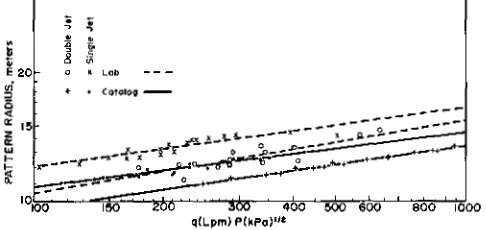
FIG. 4 Comparison of catalog radius with measured radius and show-ing the effect of straightenshow-ing vanes.
TABLE 2. PATTERN RADIUS REGRESSION COEFFICIENTS FOR EQUATION [6), SI UNITS.*
Sprinkler SIa
b
log meters N
A, Catalog data
Rainbird 30EWH 5.10 0.182 0.98 0.23 22
Nelson F32 and 33 5.22 0.178 0.97 0.34 21 Senninger 3023-5023 4.80 0.200 0.96 0.41 34
Rainbird 30WH 4.51 0.193 0.96 0.35 24
Rainbird 30H
wJCDS single jet 6.04 0.126 0.93 0.15 16 wJCDS double jet 5.03 0.142 0.99 0.07 16 Rainbird 30AWII 17° 4,33 0.187 0,96 0.32 29
Rainbird L30, 10 7.33 0.072 0.90 0.17 21
Nelson F33 w/FCN 4.38 0.215 0.78 0.39 15
B. Experimental data
Rainbird 30EWH wJvane 7.63 0.122 0.90 0.24 12
Rainbird 30W11 7.43 0.122 0.92 0.22 18
Rainbird 30WH (0 nozzle
height) 7.17 0.123 0.90 0.26
11
wJCDS single jet 6.89 0.119 0.78 0.36 18 (square jet)
w/CDS double jet 4.78 0.167 0.68 0.52 15 (2 rectangular jets)
Senninger 5023 7.57 0.116 0.95 0.20 4
Nelson F33, w /vane 6.22 0.160 0.99 0.07 4 Nelson F33, w /FCN 6.53 0.154 0.82 0.32 7
(flow control nozzles w/vane)
Nelson F33 wJFCN
(no vane) 6.00 0.166 0,39 0.48 8
*To convert to English units, multiply a by (9,94 13 10.3048).
The ASAE (1979) standard states that pattern radius is defined as the distance measured from the sprinkler centerline to the farthest point at which the sprinkler deposits water at the minimum rate of 0.26 mm/h (0.01 in./h). The application rate pattern was plotted for each test and the radius was determined as the point of in-tersection of the rate pattern with the above specified rate. The base pressure was measured in each test and the flow rate was measured volumetrically.
Pressure loss vs. flow rate tests were conducted on at least two sprinklers of each model. Friction loss was measured by using a water manometer connected to pitot tubes in the nozzle and riser. A flow coefficient was defined at the flow rate producing a loss of 6.89 kPa (1 psi), and these coefifcients are listed in Table 3. The straightening vane significantly increased the flow coeffi-cient and reduced the total loss through the sprinkler. The flow coefficients were used to compute nozzle pres-sure for each pattern test. The nozzle prespres-sure and measured discharge were used to compute the parameter qP"2. The results of the regression analysis of the laboratory data are shown in Table 2b.
The effect of sprinkler internal pressure loss on patern radius can be shown by the following example. Table 4 shows data for a Rainbird 30WH sprinkler at three flow rates and a constant base pressure of 276 kPa (40 psi) using a = 7.43 and b = 0.122 from Table 2b.
TABLE 3. FLOW COEFFICIENTS FOR SPRINKLERS TESTED
Flow rates at 6,89 kPa (1 psi) loss
Model Lm gpm
Rainbird 30WH 18.4 4.87
30EWH w/vane 24.1 6.38
Nelson F32 20.9 5.52
F32 w/vane 27.8 7,34
Rainbird L30 19.7 5.20
Senninger 5023 19.9 4.93
5023 w /vane 18.7 5.26
FIG. 3 Indoor sprinkler patterns for circular and square nozzles.
The difference in computed radius, AR, is the decrease in radius due to the pressure loss in the sprinkler. The standard error of estimate, s, for this sprinkler was 0.22 m. At the low flow, AR approaches the magnitude of s at the highest flow. Thus the difference between base pressure and nozzle pressure has a measurable effect on pattern radius only at the highest flow rates at which the sprinkler was cataloged.
RESULTS AND DISCUSSION
Table 2B lists regression coefficients for the ex-perimental data using the same sprinkler models that were used for catalog data. The average standard error of estimate of pattern radius was 0.27 m for catalog data and 0.30 m for experimental data. The values of b were generally lower for the experimental data than for the catalog data, and the values of a were generally higher from the experimental data.
Fig. 4 shows a comparison of laboratory data and catalog data for a Rainbird 30H sprinkler using straight bore nozzles with flow straightening vanes (30EWH) and without vanes (30WH). The laboratory tests produced significantly larger pattern radii than the catalog values, particularly at the lower discharge-pressure
combina-TABLE 4. COMPUTED PATTERN RADIUS USING BASE PRESSURE AND NOZZLE PRESSURE.
Nozzle
Flow rate pressure Rbase Rnozzle
Lm gpm kPa m
18.9 5 268 14.98 14.96 0.02
37,9 10 247 16.31 16.20 0.11
8 N
o Lob — —
[won
--er
100 150 ' ' ' ' t6o ' 400 500 600 800 i000 q(Lpm) P(ItPaPit
FIG. 5 Comparison of catalog radius and measured radius for Rainbird CDS nozzles.
tions. Also the laboratory data produced a smaller in-crease in pattern radius by using the straightening vane than indicated by the catalog data.
Fig. 5 shows the experimental and catalog data for the Rainbird CDS nozzles. The single jet CDS nozzle has a square orifice, while the double jet CDS nozzle has two rectangular orifices of equal size. These nozzles produce a more disperse jet than standard nozzles, which tends to reduce the pattern radius and produce a typical pattern shape as shown in Fig. 3. The double jet nozzle produces approximately the same radius as a single jet nozzle hav-ing twice the discharge or momentum. The laboratory pattern radii were again significantly larger than catalog data at lower values of momentum. This difference is larger than can be attributed to the measurement method since the differences were generally larger than the collector spacing. The manufacturers' data may be primarily from outdoor tests at low wind speeds. The smaller jets would be affected by low winds more than the larger momentum jets. A possible explanation is that the laboratory tests were run at a higher elevation (=-1220 m) at which the air density is approximately 10 percent lower than at the manufacturers' test sites. This would result in reduced air resistance to the drops and may account for the larger observed radii. This effect needs to be studied further.
Several tests were also run with a Senninger 5023 and a Nelson F33 sprinkler to compare the observed radii from sprinklers of different manufacture. The coefficients are given in Table 2. There was no significant difference be-tween the laboratory measured radii from the three dif ferent sprinklers. A series of tests was also run on the Nelson Flow Control Nozzles (FCN), and the coefficients are given in Table 2. This nozzle uses a flexible orifice which reduces in diameter as pressure increases, thus maintaining a relatively constant flow rate. The momen-tum principle is valid for the FCN nozzle. For a given size FCN nozzle, the discharge remains constant and thus the momentum and radius stays nearly constant as pressure varies. The r2 value was lower for this type of nozzle, but the radii produced were nearly equivalent to the standard nozzles.
Effect of Nozzle Height and Angle
The tests discussed thus far were conducted with a nozzle height of approximately 0.8 m, which is nearly the same as the nozzle height used by most manufacturers. A series of tests were also run at heights of 0, 1, and 2 m to assess the affect of nozzle height on pattern radius. The 1 m tests yielded results similar to the previous tests. The 0 m tests resulted in slightly reduced radii as indicated
by the coefficients for the 30WH (0 height) nozzle in Table 2 as compared to the 30WH nozzle. Due to ceiling height limitations, insufficient data were collected at the 2 rn height to run a correlation; however, the radius did not appear to increase significantly at heights between 1 and 2 m for the 27 deg sprinkler. The most common heights in field use on sideroll wheel lines or hand move laterals are between 0 and 1 m. On center pivot systems, heights of 3 to 4 m commonly occur; however, no data was available on pattern radius for these nozzle heights. Several manufacturers are producing sprinklers with several different nozzle trajectory angles and catalog data is available. Correlations were run on the Rainbird 30AWH 17 deg sprinkler and the Rainbird L30 10 deg sprinkler to compare with the 30WPSH 27 deg sprinkler. The coefficients are listed in Table 2. Only a slight reduction in radius was found between 27 and 17 deg; however, a large reduction occurs when the nozzle angle is reduced to 10 deg. The Nelson F33 sprinkler with 23 deg angle produces radii nearly identical to the 27 deg angle. These results are intended only to illustrate the use of the pattern radius relationship in assessing sprin-kler performance.
SUMMARY AND CONCLUSIONS
A relationship describing the combined effects of noz-zle size, pressure and discharge on sprinkler pattern radius was proposed and evaluated. A parameter propor-tional to the jet momentum flux can be calculated as the ratio of discharge to nozzle size. For convenient use, the momentum flux can be expressed as the product of dis-charge and square root of pressure. A power function was found to describe the relationship between pattern radius and the momentum parameter. Manufacturers' catalog data were used to verify the relationship over a wide range of sprinkler sizes, pressures and discharge. The relationship was tested in the laboratory for medium-sized sprinklers. Correlations with catalog data for a particular sprinkler and nozzle type yielded r 2 values between 0.95 and 0.98 for standard nozzles with 23 to 27 deg angles, and somewhat lower values for non-circular or flow control nozzles. Correlations with labora-tory test data yielded slightly lower r2 values and lower values of the slope coefficient b. The standard error of estimate of pattern radius is about 0.3 m using the jet momentum relationship. The laboratory data yielded significantly higher pattern radii than tilt catalog data at the lower values of jet momentum. Pattern radii were compared on medium-sized sprinklers from three dif-ferent manufacturers. Differences in catalog radii did not show up in the laboratory tests.
The effect of using flow straightening vanes on pattern radius was shown using laboratory and catalog data. The increase in radius due to the vane was slightly less than the catalog data indicated. Several tests were conducted at different nozzle heights. Pattern radius decreased slightly when the nozzle height was reduced from I m to zero. The effect of nozzle trajectory angle on pattern radius was shown using catalog data on 27, 17, and 10 deg angle sprinklers. Pattern radius begins to de-crease at angles less than about 23 deg and is significant-ly decreased at a 10 deg angle.
sprinkler and nozzle type, depending upon the degree of accuracy required. The narrower the range of sprinkler, nozzles and flow, the more accurate the pattern radius estimates become. The relationship should not be used to extrapolate beyond the intended range of data. For use in sprinkler system simulations, the relationship will predict the changes in radius with pressure variations. The method simplifies performance comparisons be-tween sprinklers and determining the overall effect of changing a parameter such as nozzle angle. It should be emphasized that a particular set of coefficients a and b apply only to a single nozzle angle and nozzle type. The coefficients can be determined with a minimum of two tests at the upper and lower ends of the desired pressure-discharge range.
The correlations show that the momentum principle is best applied with circular nozzles and is less accurate for noncircular or flow control nozzles. Catalog data is suit-able for general use with equation [6] for simulating sprinkler performance. However, if special conditions
such as nonstandard nozzle heights are to be simulated, a set of tests could be conducted to determine the coeffi-cients.
References
1 Bilanski, W. K. and E. H. Kidder. 1958. Factors that affect the distribution of water from a medium pressure rotary irrigation sprinkler. TRANSACTIONS of the ASAE 1(0:19-23, 28.
2 James, L. G. 1982. Modeling the performance of center pivot ir-rigation systems operating on variable topography. TRANSACTIONS of the ASAE 25(1):143-149.
3 Kincaid, D. C., D. F. Heermann and E. G. Kruse. 1969. Appli-cation rates and runoff in center pivot sprinkler irrigation. TRANSAC-TIONS of the ASAE 12(6):790-794, 797.
4 Seginer, Ido. 1%3. Water distribution from medium pressure sprinklers. Am. Soc. Civ. Engnrs. Irrig. Drain. Div. J. IR2, p. 13-29. 5 Solomon, Ken and James C. Bezdek. 1980. Characterizing sprinkler distribution patterns with a clustering algorithm. TRANSAC-TIONS of the ASAE 23,SW:899-902, 906.