The improving economy and greater levels of employment observed in 2014 have generally resulted in higher demands on the transportation network. This is apparent through declining speeds on the CMP network and increased ridership on BART - continuing the trends observed since 2010. The speed reduction on freeways and arterials in 2014 ranged between 0.9 mph and 1.7 mph.
Construction activities, both those recently completed and those currently underway also impacted the 2014 performance. The two notable locations showing improvements due to construction completion were the Caldecott Tunnel 4th bore and the Hayward Loop.
This final section highlights the LOS results in terms of conformity and summarizes
upcoming improvements to the road network that may be encountered in the
next monitoring cycle or beyond. As a final discussion, innovative ideas are
considered to further improve future LOS Monitoring Studies. These ideas focus on expanding the use of Big Data and inclusion of countywide monitoring of alternative modes.
8.1
|
2014 CMP Conformity
CMP conformity is evaluated for the Tier 1 network in the PM peak period on segments that fail to meet the LOS E threshold and operate at LOS F. There were 42 segments operating at LOS F in 2014 in the PM peak period. Of these 42
segments, 18 were exempt from deficiency planning requirements because they
were either grandfathered in the 1991 LOS surveys or impacted by construction. Based on the select link analysis performed on the remaining 24 segments using the Alameda Countywide Travel Demand Model, no new segments were
identified as deficient in 2014 after applying the statutorily applicable exemptions. Alameda CTC will continue to monitor the implementation of active deficiency
plans as part of the annual CMP Conformity Process.
8.2
|
Construction Work Underway During 2014 Monitoring
In 2014, one of the major impacts on road network performance was the construction and maintenance activities, particularly on major corridors.
Although it is not typical to close lanes during peak hours, these works often still
unavoidably impact traffic flows either through the traffic friction caused by
narrower lanes, presence of concrete barriers at close proximity, or gawking by roadway users.
In Alameda County, major construction work was present on I-580 in East
County, I-880 in North, Central and South County, and I-80 in North County
(also underway in 2012, but generally non-intrusive to traffic performance).
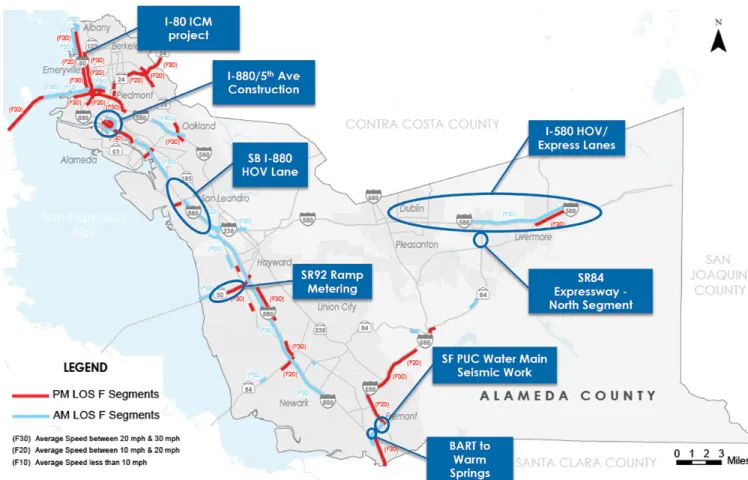
On the arterial network, State Route 112 (Davis Street) and State Route 262 (Mission Boulevard) were under construction. Figure 8-1 maps the location of
the AM and PM congested segments, and shows associated major construction
work. These construction activities are commonly undertaken in areas that are already performing poorly to improve performance. The next LOS monitoring cycle in 2016 will likely show improved performance resulting from the completed improvements.
Major work currently underway includes:
• I-580 HOV/Express Lanes: Major construction works are currently underway
along both directions of I-580 in the Tri-Valley area. This will add express lanes in both east and westbound directions to improve person throughput and performance of the corridor in general. The I-580 in the Tri-Valley area is one of the most congested corridors in the region and has continued to experience reduced speeds in 2014. There was a new congested segment in the westbound morning peak.
• I-880 Improvements: A number of projects are currently under construction
along the I-880 corridor including I-880/5th Avenue Seismic Retrofit in the
north county, southbound HOV lanes in the central county between Hegenberger Road to Marina Boulevard, and bridge construction on State Route 262-Mission Boulevard near I-880 related to BART Warm Springs Extension
project. Southbound in the morning peak and northbound in the afternoon
peak experienced congestion. Many congested segments were reported on
I-880 during these periods, generally in the vicinity of these projects. • I-80 Integrated Corridor Management (ICM) Project: As one of the most
congested corridors in the Bay Area, this corridor experienced congested conditions on many segments in the morning, afternoon, and weekend peak
periods. This project will implement adaptive ramp metering and incident
management on the 19.5 mile portion of I-80 from San Francisco-Oakland Bay
Bridge Toll Plaza to Carquinez Bridge in Contra Costa County. This project aims to improve performance by maximizing use of existing capacity. The project
also includes improvements on a parallel route, San Pablo Avenue. This route had one congested segment and other segments trending towards slower
speeds. Under this project, San Pablo Avenue will see improvements to signal infrastructure and coordination, for improved traffic flow.
8.3
|
Future Planned Network Improvements
To realize future performance improvement, Alameda CTC is currently studying the county’s multimodal transportation issues comprehensively through the following three plans:
1. Goods Movement Plan – Development of a long-range strategy for how
to move goods efficiently, reliably, and sustainably within, to, from, and
through Alameda County by roads, rail, air and water.
2. Transit Plan – Identification of near and long-term transit capital and
operating priorities in the county to reduce travel times, and improve access and connectivity.
3. Multimodal Arterial Plan - This plan will study the county’s major arterials
to identify strategies and solutions for improving multimodal connectivity, access, and mobility.
Alameda CTC has also developed a comprehensive 2014 Transportation Expenditure Plan. This 30-year plan would generate nearly $8 billion for essential transportation improvements such as expansions to BART, investments in aging highway corridors, improvements in air quality, and funds for maintenance of city infrastructure. This plan will come before voters on the November 2014 ballot under Measure BB.
In addition to the projects under construction discussed above, there are also many other improvement projects in various project development, programming,
8.4
|
Recommendations for Future LOS Monitoring Studies
Significant improvements were made to the LOS Monitoring methodology in this
monitoring cycle such as the use of commercial data, inclusion of HOV/express
lanes and bridges, and developing arterial classification for Tier 2 network. To
continue further improvement and to expand the scope of the LOS monitoring for larger level applications Alameda CTC could consider the following recommended enhancements.
8.4.1
|
Expanding the Use of Big Data
In 2016, Alameda CTC may consider expanding the use of commercial speed data to survey all arterials and HOV/express lanes as well.
Arterials (Tier 1): In 2014, arterials (Tier 1) were monitored using floating car surveys as the 2013 Validation Study recommended continuing floating car surveys since
commercial speed data sample available then did not result in adequate validation for further use on these segments. Since 2012, INRIX has updated their algorithms on arterials to be based on travel times. Therefore it is recommended that Alameda CTC verify the appropriateness of the updated algorithms using the 2014 data.
Project
Scope
Current Performance
In Project Development Phase/Programmed/Planned I-880 North Safety and
Operational Improvements at 23rd Ave. and 29th Ave.
Project proposes to construct operational and safety
improvements on I-880 at the existing overcrossings of 23rd
Ave. and 29th Ave. in the City of Oakland; construction
begins in mid-2014 and ends in 2018
Congested segments were present on I-880.
I-880 Broadway - Jackson Interchange Improvements
Project includes development work to identify improvements
between I-880, I-980 and local Oakland streets, including access to and from the Posey/Webster Tubes which connect
Oakland and the City of Alameda; project is currently in the
Scoping Phase
Congested conditions were experienced on I-880 and on connector segments to Posey/ Webster tubes.
Eastbound I-580 Truck Climbing Lanes
Truck climbing lane from Greenville Rd. to one mile east
of North Flynn Rd.; under construction with estimated
completion by end of 2015
I-580 contained congested segments in this section in the afternoon peak.
Eastbound State Rte. 84
Rte. 84 Expressway - South Segment Project involves widening
a 2.4 mile section of SR 84 (Isabel Ave.) from Ruby Hill Dr. to
Concannon Blvd. from two lanes to four lanes; construction
begins in 2015 and will be completed in 2017
The northbound approach experiences congested
conditions in the morning peak. Rte. 92/Clawiter - Whitesell
Interchange and Reliever Rte.
Project involves improving access to and from Rte. 92 in the area of the existing Rte. 92/Clawiter Rd. interchange;
construction begins in mid-2014 and ends in 2016
Congested conditions were experienced on the CA-92 in places in both morning and afternoon peaks.
Northbound I-680
HOV/express lane implementation from State Rte. 237 to north of State Rte. 84 including additional auxiliary lanes and
allowances for tolling infrastructure; project is currently in the
Environmental Phase
Congested conditions were experienced on the I-680 in the northbound direction in the afternoon peak.
HOV and express lanes: These managed lanes were also monitored using a
floating car methodology as exclusive managed lanes data was not available. These floating car surveys are more resource intensive than conventional floating
car surveys due to the multiple passenger occupancy requirements. Prior to the next monitoring cycle, it is recommended that a review be undertaken to determine if alternative managed lane data is available such as exclusive commercial speed data for managed lanes or data collection methodology.
8.4.2
|
Monitoring Alternative Modes
Monitoring of alternative modes has been undertaken since 1996 through ten
OD surveys. The objective is to compare the time taken to travel between major
employment origins and residential destinations by various modes - auto, transit, bike and HOV. While these surveys provide a useful insight to understand the competiveness of different modes, results from only ten survey routes limit the capability to facilitate countywide improvement.
Instead, these OD surveys may be replaced by dedicated, countywide travel time monitoring of each mode independently and then compared to each
other by estimating the travel time from specified origins-destination pairs for a
complete OD analysis. The analysis will reveal strengths and weaknesses of each mode allowing for informed decisions on the county transportation system. This section presents information about monitoring for each mode, monitoring of
transit transfers, and finally the OD comparison across modes.
Auto: Obtain travel times from current LOS monitoring.
HOV: Obtain travel times from current HOV/express lane monitoring.
Bike: Evaluate the utility of bike travel time information and if beneficial, monitor
bike performance on additional key bike corridors. Alternatively, bike monitoring may revert to data collection in the CMP Performance report (including counts and collision information).
Transit: Explore innovative methodologies to conduct countywide transit
monitoring using a desktop approach instead of in-field surveys of ten OD routes.
One such methodology involves remote monitoring of real time departures using publically available data from the 511 SF Bay Developer Resource Website6.
Alternatively, Alameda CTC may request access to Automated Passenger Counts (APC) or Automatic Vehicle Location (AVL) data from each transit operator (where available). In either method, the sample size of transit data
would significantly increase allowing for additional analysis (including reliability
of on-time arrival), and improved confidence in the results. To maximize the
effectiveness of transit monitoring, Alameda CTC in consultation with the stakeholders, could identify transit performance measures and geographical coverage/granularity that will effectively highlight transit routes in need of improvement. This effort can be coordinated with the countywide Transit Plan. Transit Transfers: The other crucial component of travel on transit is the delay
experienced during transit transfers and reliability of such transfers. Transfers between two buses, between two trains, and between bus/train should be monitored. Through monitoring a sample of key transit transfers, data will be available to understand the performance of the full transit trip from origin to destination, when combined with the transit travel times obtained in the previous step.
OD Comparison: This last task synthesizes the above data to allow for a
comparison of performance between modes on a number of key routes (similar to the current OD routes). Auto travel times for segments not within the CMP network may be determined by adding typical travel times from the 511 website or by obtaining additional commercial speed data for these non-CMP roads. The transit mode may be evaluated by adding the travel times of various transit segments and the relevant connection times. Such analysis may also facilitate estimation of reliability and competiveness of each mode.
This analysis of alternative modes could be undertaken as a part of the next LOS Monitoring Study in 2016, or this effort could be moved to the 2015 Performance Report as it has a stronger focus on alternative modes.
8.4.3
|
Refinements to the LOS Monitoring Process
Other refinements to the LOS Monitoring process are discussed below.
CMP Network Updates: Updates to the CMP network should be transferred into
the input files prior to subsequent monitoring cycle. These base files include:
• GIS network files;
• Route spreadsheets (if floating car surveys are employed again in 2016); and
• Summary spreadsheets.
Management of Incidents: In 2014 and all previous monitoring cycles, travel time
data has not been obtained during incidents. For a floating car methodology,
this is reasonable as the sample size is lower and one incident would have a
greater impact on the final monitoring result. For commercial data however, the sample size is significantly greater and an individual incident is unlikely to
have a large impact on the overall speed, unless there are a lot of incidents. In the latter case, instead of removing data associated with incidents, it would be
better to retain it so that the monitoring results reflect the reliability of travel time
Free Flow Speed Surveys: In the 2014 monitoring cycle, free flow speed surveys
were conducted on the arterial (Tier 2) network in order to inform the selection
of a HCM arterial class. The arterial class was selected using free flow speed
bins of 5-10 mph and other functional/design categories of road such as arterial hierarchy, availability of parking, intersection density, and roadside development. A small minority of surveys recorded questionable results due to limitations in the
floating car survey methodology and logistics. Such routes (identified in Appendix H) include those impacted by construction work (Dougherty Road, Fremont
Boulevard) and routes where the free flow speed was lower than the peak period
speed (such as 11th Street, and Tassajara Road). The latter situation may be due
to the differences in traffic signal timing between the peak and off peak periods.
Alameda County and cities periodically conduct radar surveys on local streets at
mid-block locations. These radar studies may be compared to the 2014 free flow speed results to allow for adjustments to their arterial class as necessary.
8.4.4
|
Vision for Future Monitoring
New data technologies and the performance measurement approaches they enable are radically transforming congestion monitoring practice nationwide.
These technologies and approaches revolve around the emerging fields of Big
Data and Analytics.
New data technologies include:
• Crowd Sourcing: The use of mobile devices to enhance traditional
monitoring methods;
• Open Data: Free provision of data by agencies, in structured formats, for use by stakeholders.
Resulting performance measurement approaches include:
• Continuous Monitoring: The ability to monitor congestion continuously, in
real-time; and
• Advanced Metrics: New metrics are helping agencies understand
congestion in new ways;
• Enhanced Visualization: Visualization is the core communication medium of
Big Data; and
• Integrated Analytics: Allowing agencies integrate data into their business processes.
Alameda CTC has taken a major first step in leveraging these new technologies by using crowd-sourced vehicle probe data in its monitoring for the first time in
this monitoring cycle. In future years, Alameda CTC may continue to transform its congestion monitoring process by adopting use of new data, and technologies and performance measurement approaches.
Crowd Sourcing: Crowd sourcing for transportation monitoring has emerged over the past decade with the emergence of mobile devices with GPS and cellular connectivity. In the United States, approximately 70% of adults now have
smart phones, creating major opportunities for agencies like Alameda CTC to
leverage the data from these devices to help them understand and improve the transportation system for all users.
The types of data available (now or in the near future from these devices, in order of decreasing product maturity) include:
• Speeds: Link-based, averaged speeds from mobile, the most mature data
product;
• Incidents: Companies such as Waze are now collecting incidents in real-time; • Origin/Destination: Companies such as AirSage and Streetlight collect
historical OD data;
• Volume: Companies are working to crowd-source average volumes, similar
to link speeds; and
• Sentiment: New techniques are available to mine social media for attitudes about services.
With this cycle, Alameda CTC has leveraged speed data from one provider to greatly enhance its monitoring process. Future cycles may extend this use of Big Data by adding additional crowd-sourced data, as they mature into reliable products. This additional integration may begin with incidents and OD data, as early as the next cycle.
Open Data: Open data is a process for freely sharing agency-generated Big Data via standardized formats. Alameda CTC can leverage open data in two ways. First, it can start to share the Big Data that it uses with its member
agencies, enhancing their participation in the transportation planning, project
development or monitoring processes. Second, it can acquire and use open data from partner agencies to enhance its own monitoring process. Regional
agencies such as MTC have made major open data investments, and Alameda
CTC can begin to incorporate this data for its own purposes, particularly in the area of transit performance.
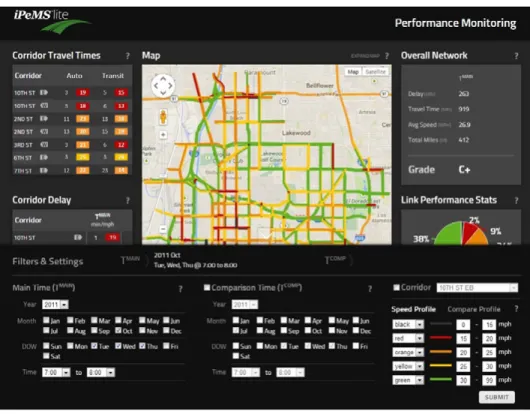
Continuous Monitoring: Beyond current biennial monitoring, Alameda CTC may consider development of a web-based, congestion monitoring dashboard to allow for continuous monitoring of all transportation modes in Alameda County. The dashboard may utilize crowd sourced data for the auto mode and 511 data for the transit mode allowing for the display of average speed, LOS and reliability for each CMP segment. Evaluation of conformity would still occur on the same CMP segments in the same time periods as current LOS monitoring. One example of such a dashboard is shown in Figure 8-2 on the next page.
The dashboard could display trends from one monitoring cycle to another, and trends across all months of the year or days of the week. This dashboard may be used as an interactive report allowing member agencies of Alameda CTC to query information useful to them.
Advanced Metrics: Traditional congestion monitoring has focused on average speeds and travel times, to characterize the travel experience throughout
areas like Alameda County. Experience has shown that a major component of the travel experience is the reliability of the travel times, rather than just the
average. Increasingly, the transportation industry is moving to focus on travel time reliability and also there are policy requirements such as MAP-21 that would need agencies like Alameda CTC to begin to monitor the reliability of travel time, in addition to the average travel time. While traditional techniques have made
this difficult, Big Data technologies may allow Alameda CTC to track travel time reliability, in addition to average experience, on most of the major corridors in
Alameda County.
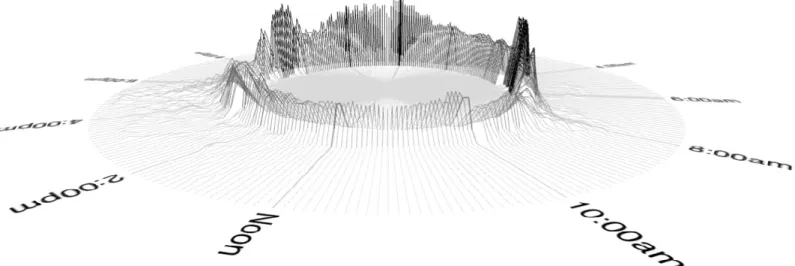
Enhanced Visualization: Text has served as the core communication for
congestion monitoring, largely in the form of tables in reports. However, the core communication medium for Big Data is not text, it is visualization. The visualization example in Figure 8-3 shows the average reliability of a particular route through
Alameda County over a three-month period, by five-minute intervals, throughout
the day. The reliability is visualized in a polar chart, as a probability distribution Figure 8-2: Example Dashboard
function, with lower travel times toward the center of the circle, higher travel
times further out, and frequency each time occurred on the vertical (Z) axis. This congestion fingerprint shows how reliability is high during the overnight and mid-day hours, where the travel times bunch vertically near free flow. It also shows, in detail, where the travel times flatten and move outward during peak periods,
demonstrating both increasing congestion and lack of reliability.
This visualization gives an example of the instant explanatory power now available via Big Data. Someone who understands how to read this chart
can quickly obtain an understanding of the congestion along this route; an
understanding that is both sweeping in its scope and precise in its detail. Attempting to characterize this level of information in text would take pages and pages of writing. Now that Alameda CTC has begun to tap into Big Data
sources, Alameda CTC may consider investing more of its resources to find ways
to effectively visualize that data, using advanced analytics techniques. Integrated Analytics: One of the core imperatives of the new Performance-Based Planning Process that MAP-21 will help agencies implement is the ability to integrate congestion monitoring into a larger planning and programming process. The long term vision for agencies like Alameda CTC that have built a sophisticated congestion monitoring infrastructure is to move from periodic reporting to a continuous monitoring approach, deeply integrated into Alameda CTC’s business processes. This integration will require changes to the ways in
which Alameda CTC uses data to make decisions about project selection and evaluation. To achieve this, Alameda CTC staff will need to someday find ways
to use its analytics tools as part of their daily process. Nationally, agencies that have developed these tools are beginning to modify their fundamental business processes, in order to fully leverage the new information from them. Alameda CTC may consider ways to begin this change towards adopting Big Data and analytics as integral part of Alameda CTC’s planning and monitoring.