S1
Supporting Information
High-performance CoCu catalyst encapsulated in KIT-6 for higher
alcohol synthesis from syngas
Zhuoshi Li†, Zhuang Zeng†, Dawei Yao†, Siqi Fan†, Shaoxia Guo†, Jing Lv*, †, Shouying Huang†, Yue Wang*, †, Xinbin Ma†
† Key Laboratory for Green Chemical Technology of Ministry of Education, Collaborative
Innovation Center of Chemical Science and Engineering, School of Chemical Engineering and Technology, Tianjin University, 92 Weijin Road, Nankai District, Tianjin 300072, People’s
Republic of China
Corresponding authors:
E-mail: muddylj@tju.edu.cn (J. Lv), yuewang@tju.edu.cn (Y. Wang).
Number of pages: 16 Number of figures: 8 Number of tables: 5
S2 CONTENT
Figure S1 The results of N2 adsorption-desorption experiments……….……... S3
Figure S2 Low-angle XRD patterns of KIT-6 and Co3Cu1/KIT-6………...…... S4
Figure S3 TEM results of the calcined Co3Cu1/KIT-6……….…... S5
Figure S4 Comparison between direct calcination and two-step pyrolysis……... S6 Figure S5 STEM image and EDX elemental mapping image ………..………….… S7 Figure S6 H2-TPR profiles of the calcined catalysts ...……….………….… S8
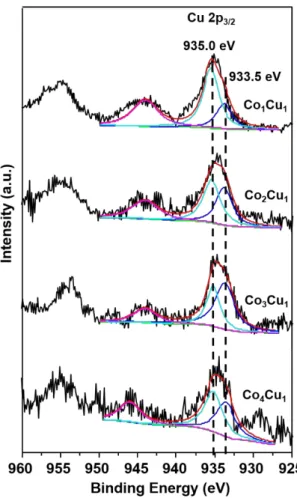
Figure S7 Peak-fitted XPS spectra of calcined catalysts ...……….…S9 Figure S8 Comparison of XPS spectra between reduced and used catalyst…..……S10 Table S1 Physicochemical properties of as-prepared materials……...………...…... S11 Table S2 Catalytic performances of some catalysts reported in references….….…. S12 Table S3 Peak analysis of H2-TPR profiles…….……….……...…... S13
Table S4 Phase analysis by XPS spectra of calcined catalysts…….………...…... S14 Table S5 Quantitative results of Co species………... S15 Reference………...…... S16
S3
Figure S1. (a) N2 adsorption-desorption isotherms and (b) pore size distribution curves
S4
S5
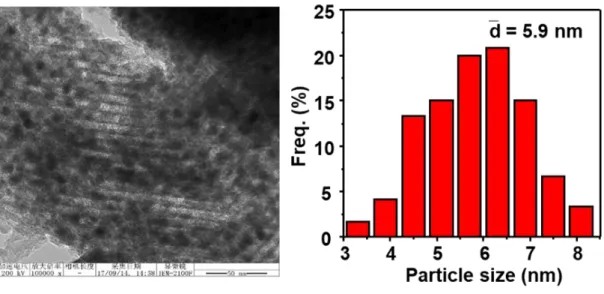
Figure S3. TEM image of the calcined Co3Cu1/KIT-6 catalyst and corresponding
S6
Figure S4. XRD patterns of Co3Cu1/KIT-6 catalyst via directly calcination or two-step pyrolysis.
S7
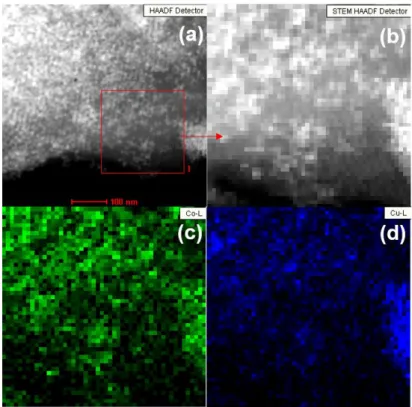
Figure S5. (a), (b) STEM image and corresponding EDX elemental mapping images of (c) Co and (D) Cu in reduced Co3Cu1/KIT-6 catalyst.
S8
S9
S10
Figure S8. Comparison of (a) Cu 2p, (b) Co 2p and (c) C 1s XPS spectra between reduced and used Co3Cu1/KIT-6 catalyst.
S11
Table S1. Physicochemical properties of as-prepared materials
aDetermined by ICP-OES. bDetermined by N
2 adsorption-desorption experiments. cDetermined by CO-chemisorption. dCalculated from XRD patterns by using the
Scherrer equation. eDetermined by TEM.
Metal loading
(wt.%)
Particle size of Co or CoCu species
(nm) Sample
Coa Cua
SBET
(m2/g)b
Pore volume (cm3/g)b
Pore size (nm)b
dc dd
Averag e particle
size (nm)e
KIT-6 - - 936 1.6 7.1 - -
-Co/KIT-6 33.1 - 232 0.4 6.3 - -
-Co4Cu1/KIT-6 23.5 6.1 198 0.3 6.3 3.9 3.5 3.8
Co3Cu1/KIT-6 23.0 8.9 286 0.4 6.6 4.4 3.6 4.3
Co2Cu1/KIT-6 18.9 12.7 358 0.5 6.6 4.3 3.6 4.5
Co1Cu1/KIT-6 12.8 19.1 336 0.6 6.5 5.3 5.0 5.5
-S12
Table S2. CO conversion and alcohol selectivity in some representative catalysts reported in references
Selectivity (%) Catalyst T (K) P (MPa) GHSV (h-1)
H2/ CO
Xco (%)
HC CO2 ROH
STY C2+OH
(mmol/gcat/h) Ref.
Co2Cu1Nb0.2 493 6 3600 1.5 10.0 46.0 1.0 45.0 N/A 1
Co8Cu8Mn8/AC 493 3 500 2 58.3 54.7 5.2 40.1 10.5 2
Cu-Co/Al2O3/CNTs
503 3 3900 2 45.4 35.3 1.8 62.9 16.0 3
Co3Cu1-11%CNT 300 5 7000 2 26.5 45.2 5.1 49.7 9.6 4
CoCu/GE–LFO 300 3 3900 2 50.0 35.0 8.0 57.0 10.7 5
Co3Cu1/KIT-6 270 3 9000 2 83.3 38.4 1.8 59.8 39.7 This
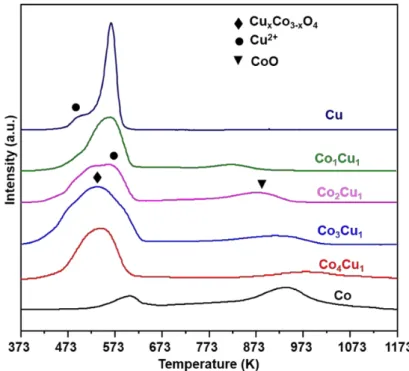
S13 Table S3. Peak analysis of H2-TPR profiles
Catalyst
α peak proportion
(%)
β peak proportion
(%)
γ peak proportion
(%)
δ peak proportion
(%)
β/(α+β+γ)
(%)
Co1Cu1 12.2 41.0 40.5 5.3 43.7
Co2Cu1 12.7 47.0 26.7 13.6 54.3
Co3Cu1 18.1 57.6 13.8 10.5 64.3
S14
Table S4. Phase analysis by XPS results of calcined catalysts
Phase proportion (molar %) a
Catalyst
CuO CuxCo3-xO4
Co1Cu1 70.2 29.8
Co2Cu1 54.5 45.5
Co3Cu1 38.5 61.5
Co4Cu1 45.8 54.2
aThe relative proportion of each phase was calculated from the deconvolution results
S15 Table S5. Quantitative results of Co species
Catalyst CO uptake a
(μmol/g) Dispersion b (%)
SCoCu c
(m2/g)
Co1Cu1 452 18.2 3.2
Co2Cu1 692 21.8 6.7
Co3Cu1 699 21.9 10.1
Co4Cu1 688 24.8 8.9
a Obtained from CO-chemisorption
b Obtained from CO-chemisorption, referring to the dispersion of total cobalt species. c Obtained from quantifying XRD patterns of reduced catalysts combined with
S16 REFERENCE:
1. Xiang, Y.; Barbosa, R.; Li, X.; Kruse, N. Ternary Cobalt-Copper-Nibium Catalysts for the Selective CO Hydrogenation to Higher Alcohols. ACS Catal. 2015, 5 (5), 2929-2934.
2. Pei, Y.; Jian, S.; Chen, Y.; Wang, C. Synthesis of Higher Alcohols by the Fischer– Tropsch Reaction over Activated Carbon Supported CoCuMn Catalysts. RSC Adv. 2015, 5 (93), 76330-76336.
3. Cao, A.; Liu, G.; Wang, L.; Liu, J.; Yue, Y.; Zhang, L.; Liu, Y. Growing Layered Double Hydroxides on CNTs and Their Catalytic Performance for Higher Alcohol Synthesis from Syngas. J. Mater. Sci. 2016, 51 (11), 5216-5231.
4. Dong, X.; Liang, X.-L.; Li, H.-Y.; Lin, G.-D.; Zhang, P.; Zhang, H.-B. Preparation and Characterization of Carbon Nanotube-Promoted Co–Cu Catalyst for Higher Alcohol Synthesis from Syngas. Catal. Today 2009, 147 (2), 158-165.
5. Niu, T.; Liu, G. L.; Chen, Y.; Yang, J.; Wu, J.; Cao, Y.; Liu, Y. Hydrothermal Synthesis of Graphene-LaFeO3 Composite Supported with Cu-Co Nanocatalyst for