A preliminary study of the ecology of a mud-flat
15
0
0
Full text
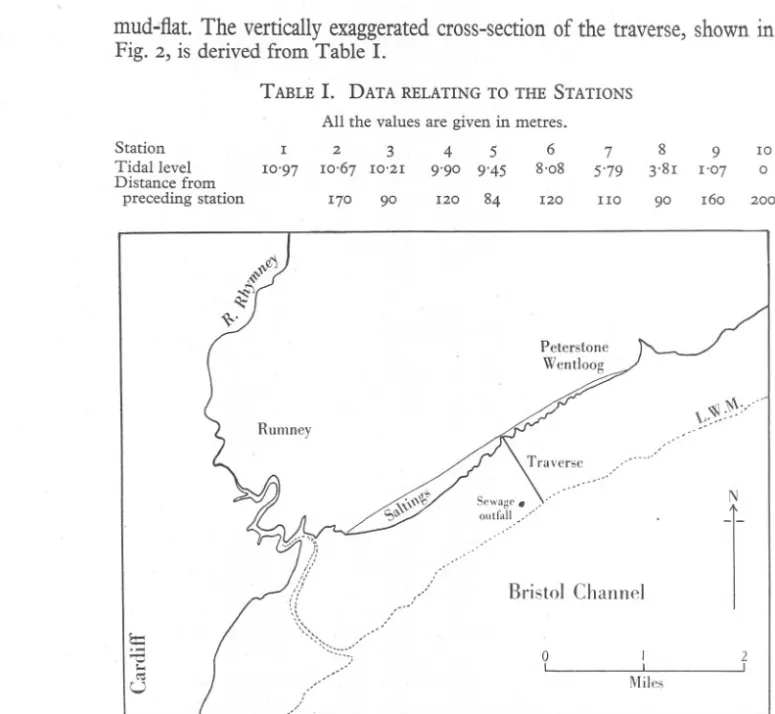
(2) COLIN. 186. B. REES. mud..:flat.The vertically exaggerated cross-section of the traverse, shown in Fig. 2, is derived from Table 1. TABLE 1. DATA RELATING TO THE STATIONS. Station Tidal level Distance from preceding station. All the values are given in metres. 6 2 3 4 5 8'08 9'9° 9'45 10'67 10'21. 10'97. 17°. 120. 9°. 84. 120. 8. 7 5'79. 3'81. 9°. 1I0. 9 1'°7. 10. 160. 200. °. N. ..,~}. .,/'. ;?. .:. // b:: .... '"0 ... etI. U. '». :/. Bristol Channel 0 L. I 1 Miles. l 2 J. /..... Fig. I. Sketch-map showing the position of the traverse along which the ten stations were taken.. On the coast side the flat is terminated by saltings about 5 ft. in height with the top I !-2 ft. humified and containing a large number of Scrobicularia plana shells. Beneath this humified layer hard clay extends to the flat level. Numbers of dead Scrobicularia occur along the fringe of the flat. St. I, placed about 13° m. from the fringe, was situated in a hard deposit, which, during the summer, became dry and tessellated at the neap-tide period. A little way beyond St., I Salicornia dolichostachys* formed a zone stretching in the direction of the traverse for about 200 m. with St. 2 situated in a mud patch in the middle of this zone. The deposit at this station was also fairly hard but, though uncovered at neap tide, was never seen as dry and tessellated. * I am obligedto Prof, R. C. McLeanfor this identification..
(3) THE. ECOLOGY. OF A MUD-FLAT. 187. St. 3 was just outside the Salicornia zone and the following stations up to St. 6 had an increasingly softer, grey deposit with St. 5 in the softest area. At St. 6 the deposit was firmer and at St. 7, at mid-water mark, the change from the loose grey deposit of the higher levels to the hard, yellowish deposit of the lower levels was clearly marked. At the remaining stations the deposit was hard and yellow, and the surface, in contrast to the smooth surface of the grey deposit, rough. The extent and development of black mud followed the same sequence, the mud being quite black and beginning near the surface at Sts. 2-6, and then becoming greyer and more deeply placed at the following stations. A brown di::itom scum developed on the surface in the summer months. This was mainly, if not wholly, confined to the region of St. I during the spring-tide period when the deposit was moist, its restriction in area being probably due to the greater stability of the mud here. I. 901.. ,,. 2. , ! Salicornia. .'. 4. 0. :. . 6m.. 3m.. 10. Om.. Fig. 2. The cross-section of the traverse.. Information given by an intelligent workman, who laid the sewage pipes, points to a series of humified layers at various depths. This has not been personally investigated, but from the, measurements given by him it seems probable that the uppermost layer extends to the edge of the Salicornia zone. The second layer would appear to extend to the neighbourhood of St. 6 and the third layer between Sts. 6 and 7. All these layers extend inland for a considerable distance. The form of the traverse (Fig. 2) may be partly accounted for by these layers and partly by the action of the strong tidal stream. One small point of interest is a slight increase in gradient between Sts. 2 and 3 due to the effect of the Salicornia in raising the level of the flat. The flat is broken up by a series of deep runnels directed seawards and into these run a number of smaller subsidiary runnels. The upper edges of the deep runnels are generally raised slightly above the mud-flat level and in many places are bound by a growth of Vaucheria. The erosion of the saltings and the encroachment of the mud-flat inland takes place irregularly along the coast, but there is good evidence for believing that in places the rate is over I ft. per year..
(4) 188. COLIN B. REES METHODS. Four samples were brought back to the laboratory from each station. (a) The sample required for the analysis of the macrofauna consisted of the mud within an area of fa sq. m. and a depth of 18 em. In the laboratory this sample was sieved and the animals removed, identified, and counted. Owing to the clayey character of the samples, sieving presented some difficulty. A sheet of copper gauze about I ft. square and with perforations of approximately 0'2 mm. was bent into a hemispherical form and slung by its corners under a water tap to which was attached a piece of rubber tubing. This tubing served to decrease the exit opening and so increased the water pressure over unit area, and by its manipulation the stream of water could be directed on any part of the gauze. A handful of the mud was placed on the gauze and the tap turned full on. Practically all the mud could be removed. When a large number of Hydrobia ulvae was present the fraction of the whole sample which had not passed through the gauze was resieved through sieves with perforations of 0'5 and 1'0 rom. diameter. This process made the separation of Hydrobia from other material considerably easier. (b) A brass tube, open at both ends, was forced vertically into the mud, removed with a column of mud inside, and corked at both ends. In the laboratory this column was forced out from the bottom and I em. blocks cut off from the surface downwards. Each block was made into a suspension with a little sea water, the suspension placed in portions on a marked slide, and the animals counted as quickly as possible. This was made all the easier by the movements of the nematodes and oligochaetes. Some of the copepods and other forms were counted 2 or 3 times in the process but as each, when moving in the suspension, left a track behind them, correction was easily made. When the number of animals in a group, particularly the nematodes, was high, a. t. or. l. portion. of the suspension. was used in counting. these and. the group neglected in the remainder of the sample, the number obtained being increased by a factor. The same tube was used for all stations. It had an internal diameter of 1,8 em. giving an area of 2'546 sq. em. (e) A similar sample to (b) was cut into 2 em. blocks, a.total of 5 blocks being obtained for each sample. Each block was weighed wet, dried at 1050 c., and reweighed dry. From the weights the percentage weight of water in the wet mud was obtained. (d) A third brass tube was used to obtain material for mechanical analysis and the top 3 em. of mud, in which the microfauna mainly lived, was dried and analysed at leisure. The method adopted for grade analysis was experimental. The results have proved unsatisfactory and it is unfortunate that, as analysis was performed after I had left the district, the samples have proved irreplaceable. The method of soil analysis as agreed upon by the International Society of Soil Science.
(5) THE. ECOLOGY. OF A MUD-FLAT. 189. (1930), using the Atterburg scale, was adopted. This scale recognizes the following fractions. (I) Stones (over 2'0 mm.). (4) Silt (0'02-0'002 mm.). (2) Coarse sand (2'0-0'2 mm.). (5) Clay (less than 0'002 mm.). (3) Fine sand (0'2-0'02 mm.). In analysis the organic matter in the mud was first oxidized by H202, afterwards treated with HCI, and thoroughly washed with distilled water. The material. was then stirred. with 10. % ammonia. and made up to the 10 em.. mark with distilled water. The liquid was poured off from the sedimented material after 8 hr. The material still suspended in the liquid consisted of the clay' fraction. This process was repeated until all the clay was removed, the bulk of liquid obtained then evaporated to dryness at 1050 c., and the clay fraction weighed dry. The residue was again made up to 10 em. with distilled water and poured off after 4 min. 48 sec. Repetition of this process brought out the whole of the silt fraction which was filtered off, dried and weighed. The residue consisted of fine sand-there being no coarse sand fraction. Each fraction was rigidly examined microscopically before being passed as the material dealt with by this method was of an unusual nature. Sea-water samples were analysed for salinity by titration with silver nitrate, and for pH by Maclendon's method with cresol red as indicator.. SOME CHEMICAL AND PHYSICAL FACTORS. The sea water. No series of water samples have been taken through the year but sufficient have been analysed to show that the salinity was about 3 less than at the plankton station for which a series of readings are available (Rees, 1939). The salinity during the period of work reported here varied at the beginning to 25'5 at the end but earlier in the year from 24'5 the monthly average salinity had been less than 20 As a general rule there was very little change in salinity between high and low water. The amount depended on the height of the tide, i.e. on the amount of movement of the water mass further out in the channel. On occasions when the height of the tide was low no salinity change occurred with the state of the tide, but with high spring tides there was a difference of about I The pH was high and varied about pH 8'00 during this period. Water content of mud. Table II gives the percentage of water in the wet mud at different levels for each station. The water content of the mud is dependent on at least three factors, (a) period of exposure between tides, (b) the distribution of particle size and (c) the efficiency in packing. Interpretation of the values in Table II is complicated by the fact that the samples were not taken at the same time but each was taken when that particular station was visited. Climatic conditions between the visits therefore 0/00. 0/00. 0/00. 0/00'. 0/00'.
(6) COLIN. 19°. B. REES. affects the sequence but the deeper sections are less affected by these conditions than are the surface ones. If particle size and efficiency in packing were constant over the area then the water content would increase towards low water, with the maximum content at ,St. 10. This is not so. From 0 to 4 em. the maximum content occurred at St. 5 and from 6 to 10 em. at St. 6. It has already been mentioned that the texture and colour of the mud changed from a loose, grey deposit at the upper stations to a hard, yellowish deposit at the lower stations. At the least there is a change in the efficiency in packing and it is probably this that counteracts, to some extent, the tendency towards increase in water content at the low-water stations. TABLE II. Stations 0-2 em. 2-4 em. 4-6 em, 6-8 em. 8-10 em.. ..,. PERCENTAGEWATER CONTENT OF THE MUD. I. 2. 37'8 29'4. 44'9 36'6 34'2 35'9 34'9. 3°'5. 28,8 32'8. 3 50'6 41'0 38'2 38'4 37'4. 4 49'1 41'1 36'8 41.6 37'6. 6. 5 63'8 55'8 42'1 43'5 43'3. 8. 7 56'3 52'0 46'3 43'2 37'5. 52'6 42'8 37'8 44'4 43'6. 52.6 46'0 47'0 42'3 42'4. 9 44'4 38'1 39'0 43'5 38'3. 10 47'6 41'5 42'9 44'1 42'3. Grade analysis. The available results are given in Table III and there is here shown a tendency towards an increase in clay content towards low water. This agrees with the appearance of the samples and is not inconsistent with the water content, if this is due, as suggested, to a greater efficiency in packing. TABLE III.. GRADE. Values Station I 3 5 6 7. Clay 22'4 17,8 28'0 3°'5 33'1. ANALYSIS. OF THE SURFACE. given as percentages Silt 34'9 5°'3 46'5 34'5 31'3. MUD. by weight. Fine. sand. 27'0 13'1 9'4 14'2 17'6. Loss in weight 15'7 18,8 16'1 20'9 18'0. It is noticeable that there was a considerable loss in weight. This was especially due to the treatment of the sample with H202, HCl and water. The sea salt in the dry sample was washed away by the distilled water. This accounts for a loss of about 2 %, and with the other reagents there was a loss of organic matter, calcium ion, carbonate ion, mixed sesquioxides of iron, and some, silica. Dr Gregg, who kindly analysed one sample, estimated a loss of 4-5 % of iron and a rather lesser value for silica. Incineration of a sample gave a loss of 12 % which may be taken as an estimate of organic matter although this value includes the additional loss of carbonate and the constitutional water of the clay (this water is included in the dry weight of mud). These figures for loss of constituents must be taken with reserve as they serve merely as indications.. ~--. ---.
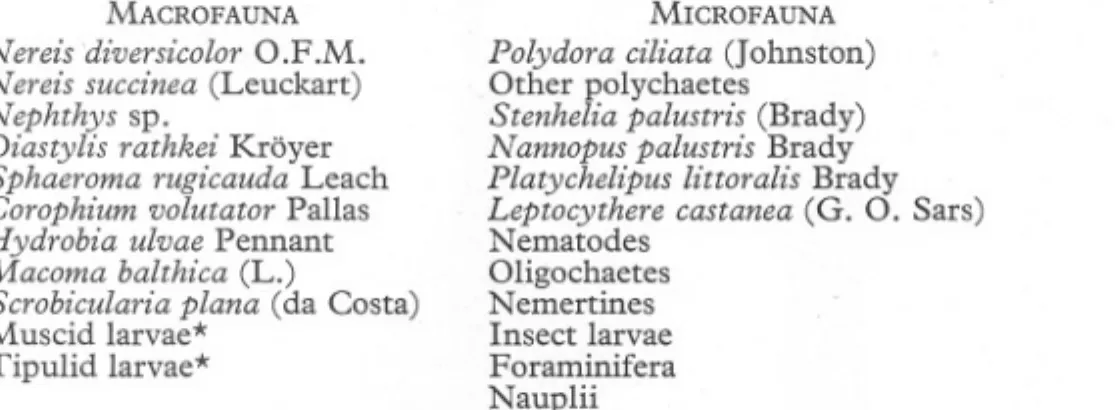
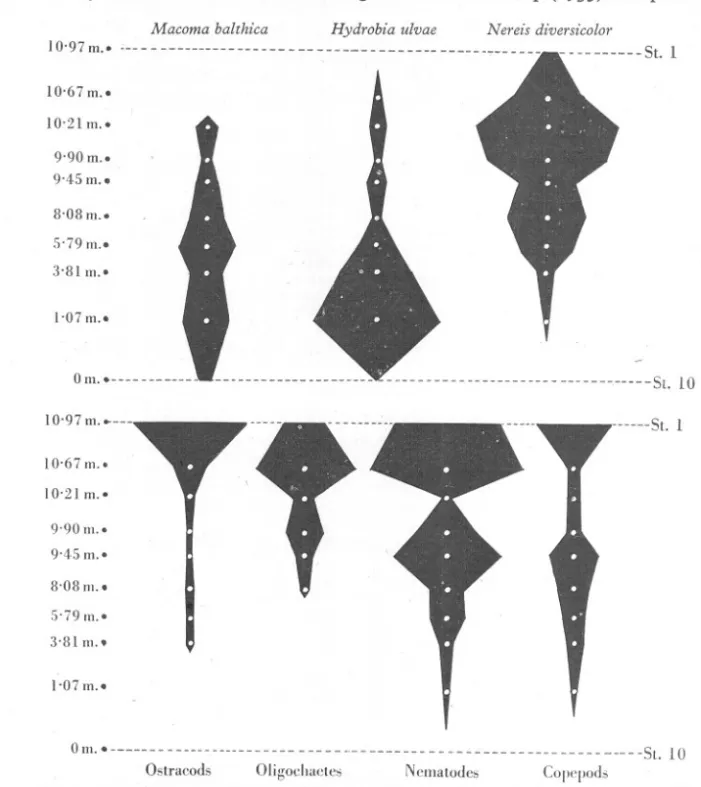
(7) THE. ECOLOGY. OF A MUD-FLAT. MUD-DWELLING. 191. SPECIES. Reference is made in this section only to those forms which may be regarded as living in the mud during the intertidal period. Hydrobia ulvae is included since a large proportion of the individuals was found below the immediate surface of the mud. The fauna is divided into macrofauna and microfauna purely on the basis of the method of quantitative analysis employed in their estimation. MACROFAUNA. MICROFAUNA. Nereis diversicolor O.F.M. Nereis succinea (Leuckart) Nephthys sp. Diastylis rathkei Kroyer Sphaeroma rugicauda Leach Corophium volutator Pallas Hydrobia ulvae Pennant Macoma balthica (L.) Scrobicularia plana (da Costa) Muscid larvae* Tipulid larvae*. Polydora ciliata (Johnston) Other polychaetes Stenhelia palustris (Brady) Nannopus palustris Brady Platychelipus littoralis Brady Leptocythere castanea (G. O. Sars) Nematodes Oligochaetes Nemertines Insect larvae Foraminifera Nauplii * These were identified with reservations by Dr F. W. Edwards to whom I am obliged.. The Macrofauna In Table IV are given the numbers, to the nearest 10 or 100, of the animals per sq. m. at each station. Only three species were of importance, these being Nereis diversicolor, Hydrobia ulvae and Macoma balthica. The zonation of these species is given in Fig. 3 in which the stations are placed according to their distances from one another and not according to tidal level. TABLE IV. Station... ... ... Nereis diversicolor N ereis succinea Nephthys sp. Diastylis rathkei Sphaeroma rugicauda Corophium volutator Hydrobia ulvae Macoma balthica Scrobicularia plana. NUMBERS PER SQUARE METRE OF THE MACROFAUNA I 240. 2 600. 3 2000. 4 1700. 5 800. 6 IlOO. 7 720. .. 8 260. 10. 9 30. + + 10. + 1200. 2500 320. IlOO 140. +. 2600 290. 1200 500. 5600 800. 10,100 500. 18,100 690. 2400 50 190. Nereis diversicolor. This species was especially abundant, the highest number of 2000 per sq. m. being obtained at St. 3. It extended down to St. 9, a level lower than it generally extends elsewhere. For comparison the numbers obtained by Nicol (1935) at the Aberlady salt-marsh may be used. The average of five pools gives the equivalent of 330 per sq. m. and in one exceptional pool, not in the five, she found the equivalent of 96,000 young Nereis per sq. m. The numbers obtained in the present mud-flat were, however, consistently high. An analysis showed that the intestines were empty in the large majority of specimens, and that mud was to be found in the remainder. It is generally.
(8) COLIN. 192. B. REES. agreed (Hunt, 1925)that a high frequencyof empty intestinesindicatesa mainly carnivorous diet. This result agrees with Thamdrup (1935) who places Macoma balthica. I0'97m.. ;-- - - ___n. Hydrobia ulvae. n- --- - -- - -- --- -- - - -- --. Nereis diversicolor. n --n_- ---. - S1.1. 10'67 m.. 10'21m.. 9'90m.. 9'45 m... 8,08 m.. 5'79 m.. 3'8Im.. I'07m... 0 m. On I 0'97 m. o-n-. n_'. nn. - h- - - n. --- - _n -. n-St.. m---St.. 10. 1. 10.67m.. 10'21m.. 9'90 m.9'45 m.8,08 m.. 5'79 m.3'8Im.. 1'07m... 0 m... _hn - n - h'_-n - - - - - - --- -- u-- -- -- -St. 10 Ostracods Oligochaetes Nematodes Cope pods Fig. 3. The distribution of some of the macrofauna species and microfauna groups. The stations are plotted according to their distances from one another and not according to the tidal levels which are otherwise indicated in the figure.. Nereis diversicolor as a transition between the general deposit feeders and those that select organisms, either plant or animal. Hydrobia ulvae. The numbers are, again, very high but the greater frequency of this species towards low water is of some interest. Wohlenberg (1937).
(9) THE. ECOLOGY. OF A MUD-FLAT. 193. found it mainly in the upper third of the beach and this is its more general distribution. This feature is probably largely dependent on the nature of the substratum, for Nicol (1935) found it occurring in pools with a firm substratum, while in pools with the mud in a semi-liquid condition-an extreme form of the soft mud in the upper levels of the present mud-flat-only a few specimens were found. Further, Fraser (1932) found it fairly thickly over parts of" thick mud" while it appeared to be absent on "thin mud".. As to numbers comparison may again be made with Nicol (1935). In sandy pools 6400 per sq. m. were found, and on bare mud a number, presumably exceptional, of 32,5°0 per sq. m. Macoma balthica. Like Hydrobia this species also occurred with greatest frequency below mid-water mark, unlike the results of Stephen (1929) who generally found Macoma in the upper half of the beach. S,tephen (1931) , considers 150-200 per sq. m. in the muddy sand at Aberlady as relatively abundant and Petersen (1918) gives 20 per sq. m. as typical of a Macoma community. Fraser (1932), on the other hand, found' 6000 per sq. m. in "thick mud" at Dingle Beach and none in the" thin mud". The" thick mud" of Dingle Beach agrees with the deposit in the lower levels of the present area only in firmness and stability. The "thick mud" consists of considerably coarser particles. Bassindale (1938) states that Macoma does not tolerate soft mud or clayey mud in the Mersey estuary. The clayey mud in the lower levels of this flat appears to be quite favourable to Macoma and possibly more favourable than the soft mud. A number of specimens were below 0'3 cm. in length (spat), and the average was about 0' 5 cm. Corophium volutator. An unusual distribution appeared for this species. While it was observed in very small numbers in the runnels of the Salicornia zone and near St. 5, it was obtained in large numbers only at St. 10. This station was rarely visited and no note on the persistence of the species can be given, though there is good reason to believe that its appearance was only temporary. Sars (1894) dredged it from a depth of 5 fm. in the Christiania Fjord, and Wohlenberg (1937) found it distributed towards low water under certain conditions, but usually found it, as it occurs elsewhere, towards high water. The absence of Corophium in the higher levels may be due to the high organic content as indicated by the black mud (Hart, 1930). Scrobicularia plana. In spite of the number of shells at the edge of the flat only a single specimen was obtained. This does not necessarily mean that the species has virtually died out as it is possible that the samples were not taken from a sufficient depth. '. jOURN,. MAR. BIOL. ASSOC, vol.. XXIV, 1939. 13. '.
(10) COLIN. 194. B. REES. The Microfauna Attention was particularly directed in this section to the quantitative work and the systematic aspect was only briefly considered. Furthermore, all the microfauna groups were not dealt with and such forms as the Infusoria and flagellates were neglected. The results are given in Table V as the numbers in the various groups at each station in each I em. layer with an area of 10 sq. em., the numbers being given to the nearest 10 or 100. TABLEV. OCCURRENCEOF THE MICROFAUNAAT THE STATIONS N¥mbers given for an area of 10 sq. em. Station. .... Copepods. .... .... 2. 3. 9°. 4 lIO. 5 310. ... 5° 3° ... ... ... +. 500. 80. 9°. lIO. 7900 r600 5° 440 .. 480 .. 20 7880 10,44° 0-1 em. 120 460 I-2 em. 80 220 120 2-3 em. 5°. 77° 160. 0-1 em. 1-2 em. 2-3 em.. Total Nematodes. Total Oligochaetes. 0-1 1-2 2-3 3-4 4-5. em. em. em. em. em.. 3-4 em. Total Ostracods. I 5°° ... 7300 53°. .. 320. 74° 5° .. .. .. 79°. Foraminifera 0-1 em. 1-2 em. 2-3 em. 3-4 em. 4-5 em.. 50 14° 9° .. ... 3° + ... 280. 7°. 410 10 420. 80. Total. Nauplii. 0-1 em. 1-2 em.. Total Polyehaetes. 0-1 em.. I-2 em. 2-3 em. 3-4 em.. Total Nemertines 0-1 em. Rotifers 0-1 em. Insect larvae 0-1 em.. .. .. .. .. .. .. .. ... ... 930 80. 7° ... ... 5° 780 IS° 24° 60 10 .. .. + + 24° 7°. 0-1 em. 1-2 em. 2-3 em. 3-4 em. 4-5 em.. Total. ... 20. ... 6 24°. 7 160. 34°. 24°. 160. 4100 4°. 1600. 80. ... 6700 660 160. 120. 414°. 7520. 1680. 2320. 1080. 220. 60. 5° 20. 20. 3°. ... 60 ?. 3°. 3°. 2200. 8 14°. 9 50. 14°. 5°. 97°. 27°. lIO. 10. 7°. 60. 33°. 7°. 10. ... ... 280. 100. 3° ... 3° ... 7° 60 ... 3° ... 3° ... ... +. ... +. +. ... +. 60. +. 20. 3°. 20. ... 80. 50 3° 5° + 13° .. .. ... .. .. .. ... ... ... ... .. .. ... 80 .. 80. ... ... .. .. .. ... ... ... ... 24° 20. .. .. .. 10. ... ... ". ... ... + ... ... ... .. 60. 24° 20 +. 3°. +.
(11) THE. ECOLOGY. OF A MUD-FLAT. 195. In order to assess the density of the organisms comparison is made in Table VI between the numbers obtained by Moore (1931) at the Loch Head station, this being his richest station, and the highest numbers from the present area, both sets being equivalent to an area of 100 sq. cm. TABLE VI.. COMPARISON OF NUMBERS IN DIFFERENT AREAS Numbers refer to surface area of 100 sq. em.. Loch Head Bristol Channel. Nematodes 2515 104,000. Polychaetes 34 2400. Ostracods 125 7900. Copepods 697 5000. The values for the Bristol Channel reveal an abundant microfauna. Nematodes, present to the extent of over 10 million per sq. m. at St. 2, were always dominant numerically but were not always so by volume. A rough calculation gives the volume of nematodes in the top cm. layer at St. 2 as 0'3 % and of oligochaetes nearly 0'5 %. An estimate of I % by volume ofliving organisms in the particular layer would be a reasonable approximation. .It is clear from Table V that the main mass <;>f the fauna was in the surface layer, and that numbers decreased towards the lower levels until there were very few specimens at a depth of 3-4 cm. Fig. 3 also gives the horizontal distribution of some of the microfauna groups and shows that the highest numbers were present in the upper part of the intertidal zone. Copepods and ostracods were present in highest numbers at St. 1. This sample was taken during the spring-tide period when the deposit was moist, but the presence of such numbers at a position which becomes arid for several days is a matter of considerable interest. Note may be made of some systematic results. Leptocythere castanea appeared to be the only ostracod present. There were at least two species of oligochaetes, one of which appeared to select diatoms for food while the other contained mud in its intestines, and two species of nematodes. I am unable to say what polychaete species was present at the low-water stations, but Polydora ciliata was present at St. 2. The three species of copepods are of interest in that, though belonging to different families, they agree in having natatory first legs, relatively small fifth legs, and a strong development of spines. The data' do not reveal an obvious differential zoning of these three speCies. OTHER SPECIES. In the Salicornia zone there is a pile of stones poorly covered by a growth of Ascophyllum nodosum. Here were found Carcinus maenas, Sphaeroma rugicauda, Clitellio arenarius, Lineus sp., Membranipora sp., and mites. On one of the stones, usually covered by the water in a deep runnel, occurred a pile-like mass of the diatom Melosira Borreri amongst which was Obelia dichotoma bearing another diatom, Lycmophora Lyngbyi, and Zoothamnion sp. '3-2..
(12) 196. COLIN. B. REES. Someof the stonesnear low watersupportedDiadume luciae and Balanus improvisus.. B. improvisus and Obelia dichotoma were found on the piles towards. low water. Underneath the Vaucheria, on a bed of black, humified mud, were found enormous numbers, considering the available space, of the spring-tail Archistoma besselsi.* These insects occasionally spread out over the water in the runnels. Crangon vulgaris was sometimes common in the runnels and Tachidius discipes was found here though not in the mud. DISCUSSION. Until the Tamar survey (Hardey & Spooner, 1938) results are available it would be premature to do more than define some of the environmental factors which appear to be of importance. . There are several indications that the traverse crossed two very different areas. The intermediate zone between these is comparatively narrow and may be taken as occurring about St. 6. Above the station the deposit is loose and the gradient low, below the station the deposit is hard and clayey and the gradient steeper. This difference is due to the fact that the sources of the deposits are entirely different. In the higher levels the deposit was, and is, derived by sedimentation from the overlying sea water at high tide, while in the lower levels the speed of the tidal stream (see Rees, 1939) prevents any sedimentation, or at least any deposition is purely temporary and is removed when the stream starts again. The tidal streams exert a scouring action on what was previously a land deposit so that the clay bed is exposed and partially removed. The gradient, as shown in Fig. 2, is essentially of the form to be expected from the action of the tidal streams, which decrease in speed as the coast-line is reached, and from the previous history of the area as revealed by the humified layers at different depths. The absence of a marked difference between the salinities at high and low water indicates that the salinity is not such as to differentiate the area into salinity zones. While there is no such effective difference it is of considerable importance that the salinity changes in the course of the year. During the period of investigation more particularly referred to in this report the salinity was about 250/00 but in the period January-March was below 20 0/00' Another factor, which is common to all intertidal areas, refers to the periods of exposure between tides at different tidal levels, leading to a zonation in the fauna. WPile it has not been fully substantiated by direct observation it can be assumed that the diatom content of the mud is greatest in the higher levels and is pr9bably very low towards low water. Opacity of the sea water prevents .. * I am indebted to Mr J. M. Brown for thi&identification..
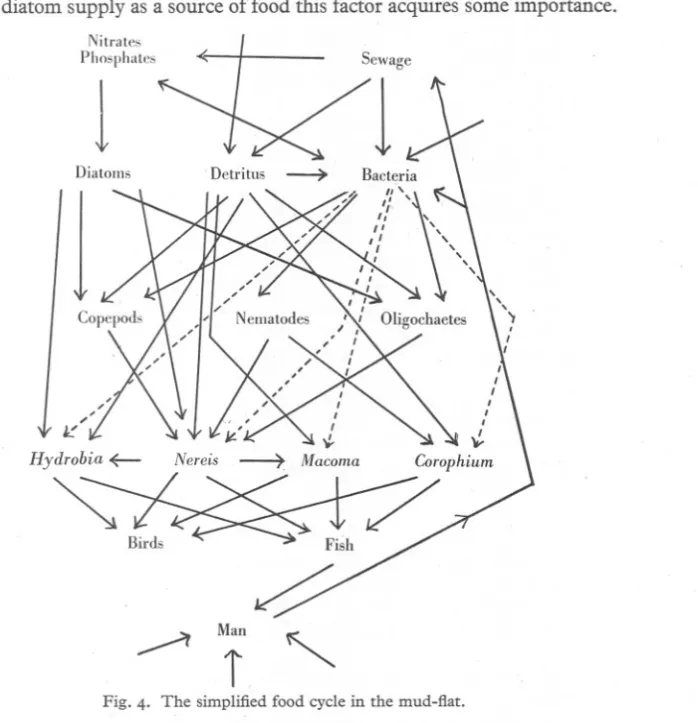
(13) THE. ECOLOGY. OF A MUD-FLAT. 197. any considerable photosynthesis when the mud is covered by a deep layer of water. Diatoms must photosynthesize far more effectively in the upper levels where such a deep layer of water does not occur. In view of the importance of the diatom supply as a source of food this factor acquires some importance. Nitrates Phosphates. Sewage. 1 Diatoms. 1. Hydrobia ~. ~ ~. Man. ~. i ~. Fig. 4. The simplified food cycle in the mud-flat.. The organic content, derived pardy from the decay of the Salicorniaand partly by sedimentation out of the sea water, must also be greater in the upper levels. Of considerableimportance is the proximity of the sewageoutfallfrom which is derived, directly and indirectly, a constant and rich supply of organic matter, bacteria, phosphates and nitrates. A striking feature is the inverse relationship between the numbers of Nereis diversicolorand some of the microfauna groups (Fig. 3). At Sts. I and 2 Nereis was comparativelylow and the numbers of copepods, nematodes, oligochaetes.
(14) 198. COLIN. B. REES. and ostracods high. At St. 3, where Nereis reached its maximum number, these microfauna groups were much decreased. Nereis decreased to St. 5 and copepods and nematodes increased (oligochaetes increased to St. 4); then, with an increase in Nereis at St. 6, there was a decrease in the two microfauna groups. While it.cannot be insisted upon there is a strong suggestion that these microfauna groups are controlled by the predatory effects of Nereis diversicolor, which may also control Macoma balthica and Hydrobia ulvae through their young stages. It is of course clear that Nereis diversicolor has an effect of ecological value simply because it is placed within a food cycle. As the food cycle is the main biological interaction within the fauna, a simplified form for the mud-flat is presented in Fig. 4. This cycle has been built up partly from personal observation but mainly from the results of Blegvad (1914), Rauschenplat (1901), Thamdrup (1935) and others. The linkages for Corophium are derived from Hart (1930), and importance is given to bacteria in view of the results of MacGinitie (1935). Thamdrup (1935) states that Hydrobia ulvae feeds on green algae. Its distribution in this area and the probable distribution of diatoms introduces some doubt as to diatoms being the sole, or even the main, source of food. Blegvad (1914) and Nicol (1935) place it among the detritus eaters.. I take pleasure in expressingmy gratitude to Prof. W. M. Tattersall, under whom I worked, for his help and encouragement, and I am, also, obliged to Dr A. C. Stephen for reading the MS. The field work was done while I held a Postgraduate Studentship of the University of Wales. SUMMARY. Ten stations, from high water to low water, were investigated along a mud-flat in the Bristol Channel. The mud was analysed for water content and grade. The values suggested, with other observations, that the stations were distributed over two different areas. Quantitative analysis of both macrofauna and microfauna revealed a dense mud population. The operative ecological factors, including the food cycle, are defined. REFERENCES BASSINDALE, R., 1938. The intertidal fauna of the Mersey estuary. Journ. Mar. Bio!. Assoc., Vol. XXIII,pp. 83-98. BLEGVAD,H., 1914. Food and conditions of nourishment among the communities of invertebrate animals found on orin the sea-bottom in Danish waters. Rep. Danish Bio!. Stat. XXII. FRASER,J. H., 1932. Observations on the fauna and constituents of an estuarine mud in a polluted area. Journ. Mar. Bio!. Assoc., Vol. XVIII,pp. 69-86..
(15) THE. ECOLOGY. OF A MUD-FLAT. 199. HART, T. J., 193°. Preliminary notes on the bionomics of the Amphipod Corol'hium volutator Pallas. Journ. Mar. Biol. Assoc., Vol. XVI,pp. 761-89. HARTLEY,P. H. T. & SPOONER,G. M., 1938. The ecology of the Tamar estuary. I. Introduction. Journ. Mar. Biol. Assoc.,Vol. XXII,pp. 501-8. HUNT, O. D., 1925. The food of the bottom fauna of the Plymouth fishing grounds. Journ. Mar. Biol. Assoc., Vol. XIII, pp. 560-99. INTERNATIONAL SOCIETYOF SOIL SCIENCE,193°. Report of the (Jommittee on Soil Measurements as adopted at the Second International Soil Congress. MACGINITIE,G. E., 1935. Ecological aspects ofa Californian marine estuary. American Midland Naturalist, 16, No.5. MOORE,H. B., 1931. The muds of the Clyde Sea area. III. Chemical and physical conditions; rate and nature of sedimentation; and fauna. Journ. Mar. Biol. Assoc., Vol. XVII,pp. 325-58. NICOL,E. A. T., 1935. The ecology of a salt marsh. Journ. Mar. Biol. Assoc., Vol. XX, pp. 2°3-62. PETERSEN, C. G. J., 1918. A survey of the work done in connection with the valuation of Danish waters from 1883-1917. Rep. Danish Biol. Stat. xxv. RAUSCHENPLAT, E., 19°1. Ueber die Nahrung von Thieren aus der Kieler Bucht. Wiss. Meeresunters Abt. Kiel, N.F., Bd. 5, pp. 85-151. REES,C. B., 1939. The plankton in the upper reaches of the Bristol Channel. Journ. Mar. Biol. Assoc., Vol. XXIII,pp. 397-425. SARS,G. 0., 1894. Crustacea of Norway, Vol. I, Amphipoda, pp. 1-711. STEPHEN,A. C., 1929. Studies on the Scottish marine fauna. The fauna of the sandy and muddy areas of the tidal zone. Trans. Roy. Soc. Edinb., Vol. 'LVI, Pt. II (No. 14), pp. 291-306. 1931. Notes on the biology of certain lamellibranchs on the Scottish coast. Journ. Mar. Biol. Assoc., Vol. XVII,pp. 277-3°0. THAMDRUP,H. M., 1935. Beitrage zur Okologie der Wattenfauna auf experimenteller Grundlage. Medd. Komm. Danmarks Fisk.- og Havunders., Ser. Fiskeri, Vol. x, Nr.2. WOHLENBERG, E., 1937. Die Wattenmeer-Lebensgemeinschaften im K6nigschafen von Sylt. Helgol. Wiss. Meeresunters., I, H. I, Helgoland..
(16)
Figure


+3
Related documents
The total coliform count from this study range between 25cfu/100ml in Joju and too numerous to count (TNTC) in Oju-Ore, Sango, Okede and Ijamido HH water samples as
Results of the survey are categorized into the following four areas: primary method used to conduct student evaluations, Internet collection of student evaluation data,
Figure 4 shows the uncertainty associated with the estimation result for the simulated example shown in Figure 2 using the compensation filter with the frequency response
19% serve a county. Fourteen per cent of the centers provide service for adjoining states in addition to the states in which they are located; usually these adjoining states have
Assessing the Impact of Biodiversity Conservation in the Management of Maize Stalk Borer (Busseola f
Field experiments were conducted at Ebonyi State University Research Farm during 2009 and 2010 farming seasons to evaluate the effect of intercropping maize with
It was decided that with the presence of such significant red flag signs that she should undergo advanced imaging, in this case an MRI, that revealed an underlying malignancy, which
Also, both diabetic groups there were a positive immunoreactivity of the photoreceptor inner segment, and this was also seen among control ani- mals treated with a
