Contents lists available atScienceDirect
Harmful Algae
journal homepage:www.elsevier.com/locate/hal
Application of the μAqua microarray for pathogenic organisms across a
marine/freshwater interface
Delphine Guillebault
1, Linda K. Medlin
*
,2Sorbonne Université, CNRS, Laboratoire de Biodiversité et Biotechnologies Microbiennes LBBM, F-66650, Banyuls sur Mer, France
A R T I C L E I N F O Keywords:
Cyanobacteria Toxic algae Phylochip
marine/freshwater interface
A B S T R A C T
Monitoring drinking water quality is an important public health issue and pathogenic organisms present a particularly serious health hazard in freshwater bodies. However, many pathogenic bacteria, including cyano-bacteria, and pathogenic protozoa can be swept into coastal lagoons and into near-shore marine environments where they continue to grow and pose a health threat to marine mammals and invertebrates. In this study, we tested the suitability of a phylochip (microarray for species detection) developed for freshwater pathogenic organisms to be applied to samples taken across a marine/freshwater interface at monthly intervals for two years. Toxic cyanobacteria and pathogenic protozoa were more numerous in a coastal lagoon than at the freshwater or marine site, indicating that this microarray can be used to detect the presence of these pathogens across a marine/freshwater interface and thus the potential for toxicity to occur within the entire watershed.
1. Introduction
Monitoring drinking water quality is an important public health issue and more especially in view of climate change (Carey et al., 2012; Moore et al., 2008). The present ecological balance determining major changes in the type, abundance and distribution of pathogenic microbes could be modified with global climate changes. Pathogenic organisms present a particularly serious health hazard and cause no less than 170,000 cases of water-related diseases annually in lakes and rivers used as drinking water reservoirs (https://www.cdc.gov/healthywater/ disease/az.html). The pathogenic organisms that are responsible for water-related diseases include bacteria, cyanobacteria, protozoans and viruses. In this paper, we examine the distribution of toxic cyano-bacteria and pathogenic protozoa across a marine/freshwater interface using molecular tools from samples taken at monthly intervals for two years.
Cyanobacteria are oxygenic phototrophic prokaryotes, some of which produce a variety of toxins and pose a serious health threat to drinking water worldwide (Carmichael, 2008). The frequency, intensity and geographical distribution of algal blooms in freshwaters have been growing worldwide, with the major causes generally correlated with water eutrophication and climate changes (Brookes and Carey, 2011; Carey et al., 2012;Moore et al., 2008). Among the cyanobacteria, about
40 species can produce potent toxins, potentially causing the so-called Harmful Algal Blooms (HABs) to impact heavily on environmental and human health. The risk of human exposure comes from contaminated recreational surface waters and from the consumption of unsuitably treated drinking water or ingestion of contaminated food (Carmichael, 2008).
Protozoa are a diverse phylogenetic group of single celled organisms (https://microbialclassification, blogspot.com/p/pathogenic-protozoa. html). Pathogenic protozoa are considered to be parasites because they take over the host cells and reproduce by binary fission. They cause a wide array of clinical diseases, which include intestinal, ur-ogenital and blood parasites (http:// http://infectionnet.org/notes/ protozoa/). Intestinal parasites always involve contamination with faecal material (EntamoebaandCryptosporidium) or untreated drinking water (Giardia andCryptosporidium), and it is these organisms from different phylogenetic groups that are monitored in freshwater systems for human health problems. Monitoring in marine waters for marine parasites is unknown at this time (Certad et al., 2019).
Cabral (2010)reviewed the major problems in water microbiology, which in general terms, finds that the greatest microbial risks are as-sociated with ingestion of water contaminated with human or animal faeces. Wastewater discharges in fresh waters and coastal seawaters are the major source of faecal microorganisms, potentially carrying
https://doi.org/10.1016/j.hal.2019.101703
Received 15 March 2019; Received in revised form 26 October 2019; Accepted 29 October 2019 ⁎Corresponding author.
E-mail address:[email protected](L.K. Medlin).
1Present address: Microbia Environnement, Avenue Pierre Fabre, 66650 Banyuls sur Mer, France. 2Present address: Marine Biological Association of the UK, The Citadel, Plymouth, PL1 2PB UK.
Harmful Algae xxx (xxxx) xxxx
pathogens. According to the WHO, the mortality of water-associated diseases exceeds 5 million people per year (https://www.who.int/ water_sanitation_health/diseases-risks/en/). Although those countries with the poorest hygiene are the most affected, developed countries are not exempt from problems. In the USA, it has been estimated that each year 560,000 people suffer from severe waterborne diseases, and 7.1 million suffer mild to moderate infections, resulting in estimated 12,000 deaths a year (Medema et al., 2003).
As rivers flow into marine systems, these pathogens and their toxins flow into a different environmental habitat. Nevertheless these patho-gens and toxins can still cause health problems in the marine en-vironment (Preece et al., 2015a,2015b,Lucy et al., 2008) and even death to marine mammals (Miller et al., 2010) as they accumulate and possibly reproduce in the marine environment (Takahashi et al., 2014) because many genera, e.g., cyanobacteria can tolerate salinities up to or over 16 o/oo (Table 1). There is little monitoring over the entire wa-tershed of a river. Although marine and freshwater Cyanobacteria can be the same species because of their salinity tolerances, it is unknown if freshwater protozoans can survive in marine waters and infect both terrestrial and marine hosts.
Monitoring for cyanobacteria and other pathogens in freshwater systems typically involves traditional microbiological methods (Rosalba et al., 2016). However, molecular tools are more rapid, accurate and reliable than traditional methods, which means faster mitigation stra-tegies with less harm to humans and the community. Molecular tools are designed to replace traditional methods for monitoring, which are laborious, technically demanding and time-consuming. Among the molecular tools that can enable a rapid detection of many pathogens simultaneously are microarrays (see review in Kegel et al. (2016)). Several microarrays have been developed based on RNA barcoding as well as other genes. The MIDTAL microarray targeted only toxic marine microalgae (Medlin, 2013a,b). Microbe and microbial function detec-tion arrays have been designed for environmental microbes (e.g. Phy-loChipWilson et al., 2002, GeoChipHe et al., 2007) and for host-as-sociated bacteria (e.g. GreenChip (Palacios et al., 2007), HOMIM (Ahn et al., 2011), HITChip (Rajilic-Stojanovic et al., 2009) and Bactochip (Ballarini et al., 2013). A Eukaryotic microarray for soil microbes has also been designed based on a PCR step before amplification (Lekang
et al., 2018). These arrays all currently target a combination of known functional classes genes or, most commonly, variants of the single 16S rRNA gene using with longer probes (e.g. 60-mer), which are more sensitive.
The European Project μAqua (FP7-KBBE-2010-4, 265409) was conceived as a project to make novel tools for the early and sensitive detection of freshwater-borne pathogens and cyanobacterial toxins. The novel tools developed in μAqua were a phylochip (microarray), which identifies the presence of freshwater pathogenic targets using rRNA barcodes and a RT-PCR microarray to amplify the mRNA captured by the barcodes for genes involved in cyanobacterial toxin synthesis. For the phylochip, the presence of the target organisms was detected through the use of rRNA barcodes used in a microarray detection platform (www.midtal.com). For the toxin array, we performed a re-verse transcriptase extension of the mRNA probes for various toxin pathways spotted on the array incorporating fluorescent nucleotides in the reaction to amplify the signal from the messenger RNA that is ex-pressed in low quantities in the cells (Medlin et al. 2007,Van der Waal et al., 2017;Medlin, 2018).
The microarray from the μAQUA project and the subsequent MicroCokit project that used the μAQUA phylochip was field tested in 6 countries. Results for four of the monitoring sites have been published: the Tiber River in Italy, (Marcheggiani et al., 2015;Medlin et al., 2017), the north German coastal fresh and brackish water sites (Baudart et al., 2016), six lakes in the Netherlands (Van Der Waal et al., 2017), one lake in Turkey (Akcaalan et al., 2017) and in this paper we present results for three sites in along the Mediterranean coast of south-east France ranging from fresh to brackish to full strength seawater, thus testing the distribution of these pathogens and the applicability of the probes across the marine/freshwater boundary. The results for the cyano-bacteria and Protozoa are reported here, whereas the cyano-bacterial com-ponent will be reported elsewhere (Baudart and Guillebault un-published).
2. Materials and methods
2.1. Sampling sites
Samples were collected over a two year period in 3 different sites, which include Amelie Station in the Mondony River as a fresh water site, the Canet-Saint Nazaire site as a brackish water site and the SOLA station as a seawater site (see yellow balloons inFig. 1), thus crossing a freshwater to marine barrier. The Mondony River flows into the Tech River at Amelie les Bains, our sampling station. Canet-Saint Nazaire is a coastal lagoon typical of this part of the Mediterranean coast. It is fed by one major river and many small drainage ditches and creeks. It is the coastal lagoon above the mouth of the Tech River. SOLA is the long-term sampling site for Sorbonne Université at Banyuls sur Mer at 42°29’366 N, 03°08’625Ein the Bay of Banyuls. Longshore currents in the western Mediterranean flow southward so all outflows from the Canet Lagoon and the Tech (Mondony) River would flow towards SOLA (Millot, 1999).
2.2. Sample processing
Samples were taken monthly over a two-year period, with a few exceptions because of poor weather, etc., during the winter months of 2011 and 2012 (Table 2) for a total of 54 samples. A water sample (40 liters) from each site was concentrated to 1 L using the Hemoflow filter (HF-80S, Fresenius Medical Care, Bad Homburg, Germany) and back-flushed with sodium hexametaphosphate (Sigma, St. Louis, USA), 0.5 % Tween 80 (Sigma), 0.001 % of antifoam B emulsion (Sigma) solution to yield a 1 L concentrate. This concentrate was size-fractionated by fil-tering through 20 μm, 10 μm, 5 μm, 2 μm, 0.8 μm, 0.45 μm, 0.1 μm, and 0.025 μm filters. The filters were fixed with Tri-Reagent (Chomczynski and Sacchi, 1987) prior to extraction.
Table 1
Common harmful bloom-forming cyanobacterial genera observed across the freshwater-marine continuum and their known toxins, adapted fromPearl et al. (2018).
Salinity Range Genus Potential Toxin
(S)a Low(0 − 4) Mod.(4 − 16) High(16+) Anabaena ATX, CYN, MC,
STX X X
Anabaenopsis MC X X X
Aphanizomenon ATX X X
Cylindrospermopsis ATX X Cylindrospermum ATX X
Dolichospermum ATX X X
Fischerella MC X X X
Haplosiphon MC X
Lyngbya CYN, LYN, STX X X X
Microcystis MC X
Nodularia NOD X X X
Nostoc ATX X X
Oscillatoria ATX X X X
Phormidium ATX X X X
Planktothrix ATX X X
Raphidiopsis ATX X X
Scytonema MC X X X
Umezakia CYN, MC X
a Toxin abbreviations: ATX = anatoxin-a CYN = cylindrospermopsin LYN = lyngbyatoxin MC = microcystin NOD = nodularin STX = saxitoxin.
1 ml aliquots were taken from the concentrate and fixed in paraf-ormaldehyde for counting by flow cytometry using a Becton Dickenson FaxScan Flow cytometer. The number of cells, either exhibiting a red fluorescence and a small side scatter (autotrophs, cyanobacteria and/or picoeukaryotes) or a green fluorescence and a small side scatter after SybrGreen I staining (bacteria), was determined for each time-point at each site for the two years sampling
2.3. RNA extractions
All filters were pooled and extracted with Tri-Reagent following the protocol inLewis et al. (2012)as modified inKegel et al. (2013)with additional modifications for cyanobacterial extractions from Yilmaz et al. (2009). Briefly, after addition of the RNA extraction control (500 000Dunaliellacells) and 250 μl of 0.5 mm ZR BashingBeads™, samples were bead-beaten twice at maximum speed for 1 min. 0,2 M Tris (pH 5.0), 0,02 M EDTA (pH 8.0), and 1 % SDS buffer were added and well mixed followed by addition of 0,75 M NH4 Acetate, 1 % Potassium ethyl Xanthogenate (Sigma 254770-100 G) and incubated at 65 °C for 15 min. The next steps of the procedure were performed as described in Kegel et al. (2013).
From the total RNA extractions, all but 5 dates were used in the final analysis (Table 2). RNA concentrations were determined by spectro-metry using a NanoVue spectrophotometer (GE Healthcare). Quality and integrity were evaluated using the Bioanalyzer (Agilent Tech-nology). The five samples not analyzed either were not sampled be-cause of bad weather or did not have enough good quality RNA to be used in the hybridizations.
2.4. Microarray construction and hybridization
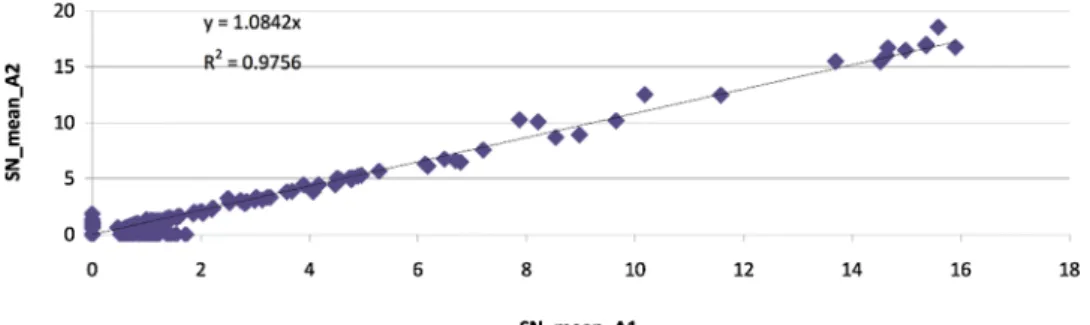
The μAQUA microarray (phylochip) contains 246 probes for rRNA genes, which were spotted by Scienion AG (Berlin, Germany) as follows: microarray slides contained two arrays with eight spots for each probe. Hybridizations of each sample were hybridized on different slides (technical replicates). Multiple probes were designed where possible for each target. Considering two arrays per sample, each probe is re-presented by 16 spots. The hybridization signal-to-noise results from
the two slides were regressed against each other to determine the re-plicability of the hybridization and normalized using the signal from the positive control, Dunaliella, to permit comparisons across hy-bridizations.
This microarray contains probes for the following toxic Cyanobacteria at the genus level: Microcystis spp., Planktothrix spp., Anabaena spp., Aphanizomenonspp., Cylindrospermopsis spp. plus two species level probes,Nodularia spumigena and Planktothrix agardhii,and generic probes for the following pathogenic protozoans: Cryptosporidium, Giardia, Entamoeba, Naegleriaand various higher group level probes were designed ranging from family, order, class, phylum to domain depending on target availability (Table 3) to complete a taxo-nomic hierarchy for each target species or genus. We employed hier-archical probes to avoid false positives. Thus for a species or genus to be present, the entire taxonomic hierarchy also had to be present. Probes were tested against pure cultures and any probe showing any cross reaction with other targets was either deleted or renamed to recognize both targets, such as GNAnaAphS01 vs. GNAphAnaS01. In the first case, the probe reacts more strongly withAnabaena, whereas in the second case the probe reacts more strongly withAphanizomenon. Calibration curves for the different cyanobacterial generic level probes can be found inBaudart et al. (2016). All probes have > 2 mm to their target and were designed to hybridise at 60 °C, which should minimize any cross reaction.
Microarray hybridizations were carried out by following the pro-tocol inLewis et al. (2012), which was modified inKegel et al. (2013). RNA was labeled and purified using a Platinum Bright 647 Infrared Nucleic Acid kit (Leica Biosystem, USA) according to the manu-facturer’s instruction. The degree of labeling (DoL) was determined by measuring concentration and incorporation of the dye using a NanoVue spectrophotometer (GE Healthcare). Samples with DoL values between 1.0 and 3.0 were processed to hybridization. Labeled field samples (500 ng RNA) were mixed with 30 μl of 2× hybridization buffer con-taining 3 μL Poly-dA (1 μM) and 10 ng TBP-control and adjusted with nuclease-free water to a final volume of 30 μL. The mixture was dena-tured for 5 min at 95 °C, then placed briefly on ice, and 7.5 μl of KREAblock (background blocker from Leica Biosystem) were added. The hybridization mixture was equally distributed to each array Fig. 1.Map of France with enlarged section showing the three sampling sites marked with yellow balloons.
(250 ng of labeled RNA) and covered by LifterSlips (Erie Scientific, USA).
2.5. Microarray analysis
GPR Files exported from the Genepix scanner were loaded into the GPR analyzer program (Dittami and Edvardsen, 2013), with the taxo-nomic hierarchy shown inTable 3and normalized with the signal from theDunaliellainternal control. Using the taxonomic hierarchy, it was assumed that if signals for the lowest taxon available (species/genus) were valid under the assumption that for a species/genus to be present all of the higher taxonomic probes should be present. Applying the
hierarchy rule, also helps to prevent recognition of false positives. Excel files were imported into PermutMatrix, which is freely available soft-ware that allows a heat map representation of microarray data (http:// www.atgc-montpellier.fr/permutmatrix/(Caraux and Pinloche, 2005). 2.6. qPCR analysis
SybrGreen based quantitative PCR was developed with newly de-signed specific primers from the genomic DNA of reference cultures, including several strains of Microcystis, Planktothrix, Anabaena, Nodularia, AphanizomenonandCylindrospermopsis, to target the micro-cystin A (McyA) genes. The primer pair MicMcyA192 F 5’GGA ACT CTT GGC GAC TTC AG3’ and MicMcyA747R 5’TTG CAA GTT TCG CAC ATC TC3’ specifically amplifies a PCR product of 556bp ofMicrocystis(Mic), and the primer pair PlaMcyA4970 F 5’AAG GCG CGA CAA CCC AAC CC3’ and PlaMcyA5498 F 5’GGT CGG GGT AAT GCA GGG CG3’ speci-fically amplifies a PCR product of 580bp ofPlanktothrix(Pla). All the PCR resulting products were cloned into pGEMt for sequencing and to be use as qPCR standards for quantitative curve establishment. The PCR product obtained from allPlanktothrixandMicrocystisstrains gave se-quences corresponding toPlanktothrixandMicrocystis, respectively. The cloned PCR products were used as standards to quantify the number of cyanobacterial cells in all subsequent qPCR reactions.
The qPCR reactions were performed using StepOnePlus™ System (Applied Biosystem by ThermoFisher) with 2 μL of environmental genomic DNA collected from a river (Amelie), an estuarine lagoon (Canet) and a marine site (Sola) or the standard DNA, 0,1 μM of each primer pair and 1X KAPA SYBR FAST qPCR Master Mix (Clinisciences), in a final reaction volume of 20 μL. Amplifications of standards, nega-tive controls and environmental gDNA were done as 3 replicates. PCR cycling conditions were a 2-step amplification including a 95 °C dena-turation followed by an annealing/extension 63 °C for Planktothrix primers or 62 °C for Microcystis primers for 40 cycles. The Cycle threshold (Ct) was determined by StepOne Software (v2.1 Real-Time PCR System). The number of cyanobacterial cells was determined from the Ct obtained according to the regression equations of the cloned standards. A post-PCR melting curve analysis was carried out to confirm that the generated fluorescence signals were specific products.
An on-line Pearson’s correlation test was used to compare cell numbers inferred from qPCR with those from the RNA (https://www. socscistatistics.com/tests/pearson/default2.aspx).
3. Results
The samples taken at monthly intervals for two years over three sites span a freshwater marine interface: one river (Amelie), one es-tuarine lagoon (Canet) and one marine site (Sola). Rainfall patterns for 2012 show that the summer of 2012 in this region of Languedoc, France was lower than the national average (Fig. 2), thus increasing the sali-nity in the estuarine lagoon and decreasing river flow at the freshwater site. This is not an unusual pattern for the entire region. In year one, samples were collected from July 2011 to May 2012 and in year two samples were collected from June 2012 to May 2013. These intervals are marked with yellow lines on all of the heat maps shown below for each of the three sites, with one exception. The sampling date of 07 March 2012 produced very strong signals because theDunaliellasignal was lower than expected. Inclusion of this date in the same excel file overpowered the signals from the other dates so it was excluded from the dataset to produce the heatmaps shown in the figure but added to the figure to the right of all the Canet dates just before the signals from Sola on all heatmaps. The scales for the various probes are shown on the heat map and range from 30 to 51 relative fluorescent pixels over background. Thus, in the results below a weak signal would be re-present 1–10 fold over the background signal, a moderate signal would be 10–20 and a high signal would be over 20 fold.
The hybridizations were very strong and very well replicated Table 2
Sampling dates at the three locations and the fit of the two pseudo-hybridizations (R²). Intervening missing dates were either not sampled or not analyzed further because of poor RNA quality.
Amelie R² 21//06//11 0.98 26//07//11 0.94 21//09/11 1.00 19/10/11 1.00 02/12/11 1.00 20/03/12 0.91 11/04/12 0.74 22/05/12 1.00 19/06/12 0.97 14/08/12 0.87 25/09/12 0.97 23/10/12 0.80 27//11/12 0.97 19/03/13 0.96 23/05/13 0.98 09/05/12 1.00 08/06/12 0.99 03/07/12 0.99 07/08/12 0.99 18/09/12 0.99 16/10/12 0.99 19//11/12 0.96 28/03/13 0.96 18/04/13 0.99 16/05/13 0.99
Canet R2
05/07/11 0.94 09/08/11 0.82 26/09/11 0.96 24/10/11 0.94 15//11/11 0.95 07/03/12 0.99 03/04/12 0.97 08/04/13 1.00 06/05/13 0.99 Sola R² 27/06/11 0.97 01/08/11 0.96 12/09/11 0.97 10/10/11 0.96 07/11/11 0.99 13/03/12 0.98 23/04/12 0.86 14/05/12 0.97 11/06/12 0.97 12/07/12 0.96 28/08/12 0.98 11/09/12 1.00 08/10/12 0.96 11/03/13 0.98
between the two slides representing each sampling date (Table 2, Fig. 3). In most cases, the hierarchy file could be used to discard false positives. The exception to this was in the pathogenic protozoans, where the family and order level probes forCryptosporidiumproved to be rather weak often breaking the hierarchy, even when tested with pure cultures of the parasites (data not shown). Species, genus and class level probe signals for this group were quite high and in the inter-pretation of the hierarchy tests, the family and order level probes were omitted. Results are discussed by site, by group for the two years. 3.1. Mondony River (Station Amélie,Figs. 4 and 5, left panel) 3.1.1. Cyanobacteria (Figs. 4–6)
3.1.1.1. Higher group probes year 1 (left of yellow line). Bacterial kingdom level probes were highlighted throughout the year (Fig. 4) with the lowest signal obtained in March 2013. All cyanobacterial phylum level probes, except PHYCyaExCylS01, SO2 and SO3 probes, were also present most of the year at various fluorescent signal strengths with PhCyano02 showing the weakest signal. Chroococales, Nostocales, and Oscillatoriales level probes were all present at much lower abundances especially in the first year and were lower in the winter months. Oscillatoriales strains were isolated into culture from this site (data not shown) and from their probe intensity signals would appear to be the most abundant of the cyanobacterial order level probes on the microarray. Blooms of unicellular cyanobacteria were seen using flow cytometer in October 2011.
3.1.1.2. Higher group probes Year 2 (right of yellow line). Bacterial kingdom level probes were highlighted throughout the year (Fig. 4)
but were lowest in the second half of year 2. All Cyanobacteria phylum level probes, except PHYCyaExCyl S02 & SO3, and PhCyanoS02 probes, were also present during most of the year but with the signals disappearing during the winter months but not as much as in year 1. Chroococales, Nostocales & Oscillatoriales level probes were present at lower abundances and were negligible in the winter of year 2. Oscillatoriales strains were also cultivated from the site. Blooms of unicellular cyanobacteria were seen using flow cytometer in July and October 2012 (Fig. 6).
3.1.1.3. Genus level probes year 1 (left of yellow line). Genus level probes for the different targets (Aphanizomenon & Anabaena, Cylindrospermopsis, Microcystis, Nodularia and Planktothrix) were all present but showed a very low fluorescent signal throughout the year (Fig. 5) with the exception of GNNodAna S03, which had no signal. Nodularia spumigenaandPlanktothrix agardhiiwere also recorded at the species level.
3.1.1.4. Genus level probes year 2 (right of yellow line). Genus level probes for the different targets (Aphanizomenon/Anabaena, Cylindrospermopsis, Microcystis, Nodularia, and Planktothrix) were all present, albeit weakly throughout most of the year but peaks were higher for some probes during the summer (Fig. 5).Aphanizomenonhad the brightest signal on several occasions in year 2. All the hierarchy probes ofNodularia spumigenawere weakly present during the end of summer, beginning of autumn at a low level but significantly higher than the rest of the period.Microcystisgenus probes were highlighted during autumn and winter at a very low level, andPlanktothrixprobes were at their highest during the same period.
Table 3
Summary of hierarchical probes for cyanobacteria and Protozoa. Read the hierarchy from left to right beginning with either a species or a genus level probe. The second and third levels in the hierarchy recognize multiple orders and the second name is the stronger probe and must be present to go the next level in the hierarchy test. Thus,Microcystisis recognized by its genus level probe and the order level probe that hits only Chlorococcales and a second order that hits both Chlorococcales and Nostocales. The multiple order hit probe must be present to procede through the hierarchy test to the division and kingdom level. The bracketed numbers in Fig. 4are designated in the hierarchy table.
A. Hierarchy for Cyanobacteria
Species Genus or Multiple Genera Order 2nd level of Multiple Orders 3rd level of multiple Orders1 2= Phylum
/division 1) Kingdom Microcystis 3=Chlorococcales 5=Chroococales/Nostocales Cyanobacteria Eubacteria Anabaena/Aphanizomenon/
Cylindrospermopsis 4=Nostocales 5=Oscillatoriales/Nostocales 3=Chroococales/Nostocales Cyanobacteria Eubacteria Anabaena/Aphanizomenon 4=Nostocales 5=Oscillatoriales/Nostocales 3=Chroococales/Nostocales Cyanobacteria Eubacteria Anabaena/Aphanizomenon/Nodularia 4=Nostocales 5=Oscillatoriales/Nostocales 3=Chroococales/Nostocales Cyanobacteria Eubacteria Aphanizomenon 4=Nostocales 5=Oscillatoriales/Nostocales 3=Chroococales/Nostocales Cyanobacteria Eubacteria Cylindrospermopsis 4=Nostocales 5=Oscillatoriales/Nostocales 3=Chroococales/Nostocales Cyanobacteria Eubacteria Nodularia/Anabaena 4=Nostocales 5=Oscillatoriales/Nostocales 3=Chroococales/Nostocales Cyanobacteria Eubacteria Nodularia/Anabaena/Aphanizomenon 4=Nostocales 5=Oscillatoriales/Nostocales 3=Chroococales/Nostocales Cyanobacteria Eubacteria Nodularia 4=Nostocales 5=Oscillatoriales/Nostocales 3=Chroococales/Nostocales Cyanobacteria Eubacteria Nodularia
spumigena Nodularia 4=Nostocales 5=Oscillatoriales/Nostocales 3=Chroococales/Nostocales Cyanobacteria Eubacteria Planktothrix
agardhii Planktothrix 5=Oscillatoriales 4=Nostocales/Oscillatoriales Cyanobacteria Eubacteria B. Hierarchy for Protozoa
Species Genus Family Order Class Kingdom
Cryptosporidium hominis Cryptosporidium Cryptosporidae Eimeriorina Conoidasida Eukaryote Cryptosporidium parvum/hominis
Cryptosporidium parvum/hominis Cryptosporidium parvum
Giardia intestinalis Giardia Diplomonadida Eukaryote
Naegleria fowleri Naegleria Eukaryote
Naegleria lovaniensis
3.1.2. ProtozoaFig. 7, left panel
3.1.2.1. Higher group probes year 1 (left of yellow line). The Eukaryotic probes were high all year, even completely saturated (white boxes) on some dates. All higher group level probes (Class Conoidasida and Phylum Diplomonadida) were only weakly highlighted throughout year 1.
3.1.2.2. Higher group probes year 2 (right of yellow line). Similar results to year 1 were obtained throughout year 2 but were higher especially in
the summer. March 2013 had almost a total absence of signal at this level.
3.1.2.3. Genus level probes year 1 (left of yellow line). Genus level probes were all very low and just above the background. Faint signals were seen forNaegleriaon two occasions. Strong signals forCryptosporidium parvumwere seen throughout year 1 but with faint genus level probes so the hierarchy was likely broken, except in May 2012.Entamoeba histolyticawas present during May.
Fig. 2.Representative graphs showing typical regression of the signal to noise ratio for each replicate slides for each hybridisation of each sampling date.
3.1.2.4. Genus level probes year 2 (right of yellow line). No or extremely faint signals were seen throughout year 2, except for the strong signals forC. parvumand the genusCryptosporidium,which were strongest in the autumn 2012 into 2013. A complete hierarchy was faintly seen for Naegleria fowleriin the winter of 2012 through to the spring. October 2012 registered the presence of all parasite protozoans at the species level:Giardia intestinalis,Entamoeba histolytica, Cryptosporidium parvum andhominus, Naegleria fowleriandlovensis.
3.2. Canet lagoonFigs. 4 and 5, middle panel 3.2.1. Cyanobacteria (Figs. 4–6)
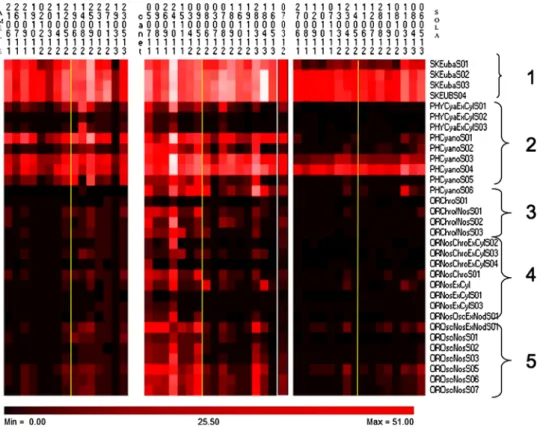
3.2.1.1. Higher group probes year 1 (left of yellow line). All Bacterial kingdom level and Cyanobacterial phylum level probes were present all year, with strongest reactions (saturated) in the Autumn through to Winter at various fluorescent signal strength with PHYCyaExCylS03 & SO2 probes showing almost no fluorescence (Fig. 4). Chroococales, Fig. 4.Heat maps for the higher group level probes for the cyanobacteria across the fresh-water marine interface from left to right. Left Panel: Amelie, Middle Panel: Canet Lagoon, Right Panel: Sola. Yellow line separates year 1 from year 2. The color scale provides the range of signal intensities for hybridizations from the lowest to the highest intensity detected. Low or weak hybridization 1–10 fold above back-ground, medium hybridization signal 1–20 fold over back ground, high or strong hybridiza-tion > 20.
Fig. 5.Heat maps for the genus level probes for the cyanobacteria across the freshwater marine interface from left to right. Left Panel: Amelie, Middle Panel: Canet Lagoon, Right Panel: Sola. Yellow line separates year 1 from year 2. The color scale provides the range of signal intensities for hybridizations from the lowest to the highest intensity detected. Low or weak hybridization 1–10 fold above back-ground, medium hybridization signal 1–20 fold over back ground, high or strong hybridiza-tion > 20.
Fig. 6.Flow cytometric measurements of the total bacterial community (in red) measured by size and the total cyanobacterial community (in green) measured by size and fluorescence.
Fig. 7.Heat maps for the higher group and genus level probes for the protozoans across the freshwater marine interface from left to right. Left Panel: Amelie, Middle Panel: Canet Lagoon, Right Panel: Sola. The color scale provides the range of signal intensities for hybridiza-tions from the lowest to the highest intensity detected. Low or weak hybridization 1–10 fold above back-ground, medium hybridization signal 1–20 fold over back ground, high or strong hybridization > 20.
Nostocales & Oscillatoriales level probes were more strongly present in the autumn to winter samples except for the ORNosExCylS01, ORNosExCylS03 & ORNosExNodS01, which showed fainter signals. Highest signals were from the Oscillatoriales probes. Blooms of unicellular Cyanobacteria and/or picoeukaryotes were recorded in Canet Lagoon by flow cytometry in August and October 2011 (Fig. 6), of which the former date was very strong on the microarray and the latter date was at saturation (see white color on the heatmap in Fig. 5),
3.2.1.2. Higher group probes year 2 (right of yellow line). All Bacterial Kingdom level and Cyanobacteria phylum level probes were also present all year with stronger fluorescent signal strength with PHYCyaExCylS02 & SO3 probes showing low or no fluorescence (Fig. 4). All order level probes were faint and lower than that in year 1. Again Oscillatoriales signals were the strongest of all the order level probes. Blooms of Cyanobacteria were detected by flow cytometry in July and September of 2012 (Fig. 6). Of these two dates the strongest signal on the microarray was in September 2012. The very intense signal in March 2013 is not reflected in the cytometric data. However, the cytometric data only counts the unicellular species, whereas the microarray reflects the entire community, both unicells and filaments. The high probe signal on this date must then logically have come from the filamentous species present in the community, viz. Oscillatoriales and Nostocales.
3.2.1.3. Genus level probes year 1 (left of yellow line). Genus level probes for Aphanizomenon and Anabaena, Cylindrospermopsis, Microcystis, Nodularia andPlanktothrixwere all present throughout the first year, with Cylindrospermopsis, Nodularia and Planktothrix producing the strongest signals. Planktothrix agardhii was detected in June and October 2011, albeit very faintly (Fig. 5). Nodularia spumigena was detected throughout the year and the corresponding genus level probes were also detected, especially GnNODS01. These results are consistent with the cyanobacterial isolation from Canet where all taxonomic orders were found and Anabaena and Nodularia were isolated into culture (data not shown).
3.2.1.4. Genus level probes year 2 (right of yellow line). Various probes for Aphanizomenon or Anabaena were highlighted sporadically throughout year 2. A microarray signal was present throughout the second year for the probe for all Aphanizomenon spp. (GNAphS01) (Fig. 5) except in May 2013. MicrocystisandPlanktothrixgenus level probes were only sporadically highlighted in year 2.Cylindrospermopsis was regularly present in year 2 but with lower signal intensities than in year 1. The overall signal ofNodularia spumigenagenus & species probes were low but were present together throughout the autumn/winter of 2012 and at a lower level in Spring 2013.
The GNPlankS01 is not specific toPlanktothrixbut also recognizes Cylindrospermopsis. There was also a consistently very high signal for Cylindrospermopsis,thus it is more likely that the signal from GNPlank S02 originated fromPlanktothrixin March 2013. Many Oscillatorialean cyanobacteria were isolated into culture during year 2.
3.2.2. Protozoa (Fig. 6middle panel)
3.2.2.1. Higher group probes year 1 (left of yellow line). Class level probes for Cryptosporidium were moderate at the beginning of the autumn of 2011 and became saturated into 2012 as did the phylum level probes for the Diplomonadida but at a lower intensity.
3.2.2.2. Higher group probes year 2 (right of yellow line). Probes for the class level ofCryptosporidiumare present in all autumn to early spring samples in year 2, becoming saturated. The weaker order level probes for the Diplomonadida were highest in the spring of both years.
3.2.2.3. Genus level probes
3.2.2.3.1. Year 1 (left of yellow line). The species level probes forC. parvum mirrored its higher group level. The genus level probe for Cryptosporidium, GNCrypto05, was the strongest, maintaining the hierarchy in most months. Genus level probes forGiardiawere weak but peaked in late 2011. The genusNaegleriaand its species,Naegleria fowleri, were stronger throughout the year. Naegleria lovensis was present to a lesser degree. The genus Entamoeba was present really only in 2011.
3.2.2.3.2. Year 2 (right of yellow line). Genus level probes were low throughout year 2, except for GNCryptoS05.C. parvumsignals appear through out the year and the hierarchy was only really broken once in April 2013, even with the low generic probes. Generic probes for GiardiaandEntamoeba were weak or absent throughout year 2. Two Naegleria genus level probes were strong throughout year 2, accompanied by signals forN. fowleri.
3.3. Sola (Figs. 4 and 5right panel) 3.3.1. CyanobacteriaFigs. 4–6
3.3.1.1. Higher group probes year 1 (left of yellow line). Eubacteria were detected the Kingdom level at a slightly lower fluorescent signal than at the other sites. Of cyanobacterial phylum level probes, PHCYANOS04 recorded the highest values and some of the other probes not reacting at all. Order level probes were present randomly by date rather than by group. Of the order level probes, probes for the order Oscillatoriales were the strongest, albeit all were weak. Two major blooms of unicellular cyanobacteria were recorded by flow cytometry in year one throughout late summer to the fall and in April 2012 (Fig. 6), which matched the continuous probe signals for the two strongest phylum level probes (Fig. 4).
3.3.1.2. Higher group probes year 2 (right of yellow line). Kingdom Eubacteria and cyanobacterial phylum level probes mirrored the pattern seen in year 1 with cyclic blooms detected by flow cytometry and continuous probe signals through year 2 with saturated signals in March with a lower cell number detected by flow cytometry and inferred cell numbers from our target species (Table 4). The high probe signal at the phylum level may also reflect signals coming from filamentous cyanobacteria, such asLeptolynbyaandOscillatoria,which were isolated into culture from Sola and identified by sequencing (data not shown). The same pattern was found for order level probes as for the first year. Oscillatoriales level probes were again the strongest, especially on the dates where there is a low flow cytometric signal. 3.3.1.3. Genus level probes year 1 (left of yellow line). Genus level probes for Aphanizomenon & Anabaena, Cylindrospermopsis, Microcystis spp, were not present or were present at a very faint level throughout the first year. There was one strong signal forCylindrospermopsis. Nodularia spumigena andPlanktothrix agardhiishowed weak signals throughout the year. These results are consistent with the design of the probes that were made for freshwater targets. They support the robustness of the probe specificity by the absence of strong cross-reactions with marine cyanobacteria that belong to other genera but are in the same order as our target toxic species.
3.3.1.4. Genus level year 2 (right of yellow line). Genus level probes for Aphanizomenon&Anabaena,Cylindrospermopsis, Microcystisspp, were similar to those in year 1.
3.3.2. Protozoa (Fig. 6, right panel)
3.3.2.1. Higher group probes year 1 (left of yellow line). Class level probes forCryptosporidiumwere moderately illuminated and the order level probes for the Phylum Diplomonidada were present but consistently weaker. Weak but consistent signals were seen for the family probe forCryptosporidium.
3.3.2.2. Higher group probes year 2 (right of yellow line). Year 2 had stronger class level probes than year 1.
3.3.2.3. Genus level probes year 1 (left of yellow line). Sporadic weak signals were recovered from all of the targeted protozoans at the genus level. Strong signals were seen forC. parvummore especially in the fall and autumn that were in general supported by very weak signals at the genus level.
3.3.2.4. Genus level probes year 2 (left of yellow line). Moderately strong C. parvumprobe signals mirrored the pattern of the class level probes. No other strong probe signals for the pathogenic protozoans could be seen and all were faintly illuminated.
3.4. Inferred cell numbers from microarray signal as compared to those determined from cell fluorescence (Fig. 8)
Because calibration curves have been performed for the cyano-bacterial probes using RNA concentrations from known numbers of cells from pure cultures (Baudart et al., 2016), we are able to infer cell numbers present in the samples in lieu of cell counts (Suppl. Table 1, Fig. 8). We can compare the numbers obtained to the total cyano-bacterial counts made by flow cytometry (Fig. 6) for the unicellular species. We had more than one probe for each of the cyanobacterial taxa, except the species level probe forNodularia spumigena, so inferred cell numbers were averaged to obtain a relative number based on multiple probes. Most cell numbers inferred from species or genus level probes were low (averages under 1000 cells per liter) except in Canet during Oct 2011 and March 2012 of year 1 forMicrocystisand Nov 2012 from year 2 for Planktothrix (Table 4). AFC measurements indicate
blooms of all fluorescent microalgae and when separated by size (side scatter), then Cyanobacteria and picoeukaryotes can be separated from microplankton. Cyanobacterial blooms were detected at each of the three sites but only one date at Canet can be correlated with toxic Cyanobacteria based on the numbers inferred from our probe signal on the microarray. These are the blooms ofMicrocystis in Oct 2011; all other peaks of fluorescence must be correlated with other non-toxic cyanobacterial species or toxic filamentous species or picoeukaryotic microalgae. A Pearson’s correlation of the fluorescent microarray data and the AFC data showed a slightly negative correlation at Amelie and Canet and a slightly positive one at Sola, all of which were not sig-nificant. This would support that the AFC data and the microarray data are measuring two different things. Only when there is a high micro-array signal for a unicellular target with a high AFC value, can any interpretation be made as to the target organism that is blooming. 3.5. Comparison with qPCR data (Fig. 9)
qPCR amplifications were performed forPlanktothrixandMicrocystis on environmental samples for the three sites because specific amplifi-cations were obtained only for those two cyanobacteria genera. MicrocystisqPCR gave no signals at any of the three sites.Planktothrix qPCR didn’t give any significant signals for Canet and Sola sites (data not shown) but those for Amelie as presented inFig. 9. Copy numbers of the mcyA gene could be determined for seven samples that were above the Ct, ranging from 48 866 to 372 479 copies per liter. These results suggest a maximal cell concentration of 372 479 cell/L in the Amelie sample of September 2012. All remaining signals were below the de-tection level. Cell numbers inferred by the qPCR method are based on the presence of the mcyA gene in the DNA, whereas those inferred from Table 4
Comparison of the inferred cell numbers from qPCR of theMcyA gene and those from the microarray using our calibration curves. Only those dates in common with the two methods (those in grey) were used in the correlation.
the microarray signal are based on rRNA content from actively growing cells. When compared to cell numbers inferred from the rRNA probes, the qPCR data inferred numbers were significantly higher but followed the same general trend,Planktothrixwas highest in abundance in the fall samples of both years, although present year-round. Using a Pear-son’s Correlation with the sample dates that were in common for the two methods (Table 4), there was a strong positive correlation between the numbers inferred with the two methods at with R = .8364, p = .08 but it is not significant at p= < .05.
Several samples with high cell numbers inferred from the rRNA had low or no numbers inferred from the qPCR data. This difference could stem from either of four reasons: 1) SybrGreen method is cost-effective but less sensitive than the TaqMan method with higher thresholds, 2) dilution were required for PCR to amplify environmental targets, therefore the concentration of the DNA could have been too low for the qPCR to work effectively on those environmental samples, 3) the qPCR was inhibited by natural products in the environmental sample, or 4) some cells were non-toxic (Bukowska et al., 2017). Certainly in the samples taken from Oct 2012 to March 2013 there was little or no expression of any of the McyA gene variations in the toxin array (Medlin, 2018) so thePlanktothrixcells enumerated by the species array could have easily been non-toxic.
Also qPCR can overestimate the number of cells according to the number of genes. There could be a cross reaction with other mcyA genes from other Cyanobacteria.
4. Discussion
4.1. Microarray results 4.1.1. Cyanobacteria
For the cyanobacteria, the Eubacterial kingdom probes recognize all cyanobacteria in all kinds of water bodies. However, we found that the phylum level probes were not evenly highlighted depending on the water body. At Sola, two probes, PHYCyano SO2 and SO3, were con-sistently and strongly highlighted, whereas the PHYCyaExCylS01-3 probes were consistently non reactive, suggesting a mismatch between these probes and marine cyanobacteria. The order level probes were most effective in the coastal lagoon, whereas in the flowing river and in marine waters, fewer cyanobacteria at the lower taxonomic levels were detected using our probes. A bloom of cyanobacteria was detected by the same microarray in the Tiber River (Medlin et al., 2017) and the bloom in the Mondony River was detected here by both flow cytometry and the microarray but with the latter only by the higher group level probes. For the freshwater site, the order level probes were weakly highlighted throughout both sampling periods, indicating that these orders were always present at low amounts. At the brackish water site, year 1 had more intense signals than year 2. At the genus level, most of the reacting probes results were confirmed by alternative approaches to check for the presence of our cyanobacteria targets, such as through culture isolation or qPCR methods. At the marine site, these probes Fig. 8.Inferred cell numbers/L for cyanobacterial genera across all sites based on averaged numbers in Supplemental Table 1. Note abundances at Canet are plotted on a logarithmic scale because of the blooms ofMicrocystisoccurring there.
were in general not reactive, again suggesting possible mismatches between the target and the probes in the marine environment or cells that were, in general, senescent, which would match with the general oligotrophic nature of the Mediterranean.
The same pattern was observed for all the genus and species level probes designed against the different cyanobacterial targets with Nodularia, CylindrospermopsisandPlanktothrixweakly present in marine waters and the other genera not generally present. Signals for Microcystis, Anabaena, and Aphanizomenon and in particular Cylindrospermopsiswere more intense in the brackish waters where they were retained within the enclosed system rather than in the river where they were washed out. These results strongly support probe specificity for the recognition of Cyanobacteria, even though it is documented (see below) that they can be flushed out into the marine system and thrive there. Cyanobacterial abundance was highest in the summer/fall months in Canet.
4.1.2. Protozoa
For the protozoa, we found that the order and family level probes were very weak and almost never produced any signals; this was con-sistent with results obtained when the probes were tested with pure cultures. These probes should be redesigned or discarded from any future microarray. In contrast, the phylum, genus and species level probes produced quite strong signals, especially in the brackish water site, indicative of presence of targets in the field samples. The proto-zoans targeted in this study can also infect other animals besides hu-mans and we feel that the majority of the signals originate from para-sites infecting farm animals and fish because there have never been any reports of pathogenic protozoa in the area. An internal intercalibration exercise was performed within the μAqua project and aliquots of our concentrate were sent to the University of Dublin who are specialists in pathogenic protozoa. They did not see any oocysts or cysts in the samples they examined.
At least three different species ofCryptosporidiumare known from marine fish (Certad et al., 2019). Infections ofC. parvumin freshwater fish can be as high as 37 % of the population but infections in marine fish are much lower (ca 3 %) and novel genotypes were more highly represented (Certad et al., 2019). This study suggested that the range of
marine fish that were contaminated withCryptosporidiumspp. could represent a health risk with the danger of passing the parasites from fish to humans because some of the host fish, e.g pilchard, are only mari-nated and not cooked or gutted.
The most common source of waterborneCryptosporidiumoocysts, Giardia cysts, and microsporidian spores are agricultural lands that contain (1) animal faeces from grazing herds and spreading of stored waste after winter-storage and (2) human sewage sludge end products spread on agricultural land (Lucy et al., 2008), whereasOates et al. (2012)found that wild canids and opossums were the most highly in-fected hosts and were higher risks for being zoonotic. We note that for Naegleriathe primary hosts are not humans and are unknown but likely to be a fish (http://www.bms.ed.ac.uk/research /others/smaciver/ naegleria.htm) but invertebrates cannot be ruled out. Cattle, sheep and goats are also commonly infected withCryptosporidium.Giardiainfects humans, but is also one of the most common parasites infecting cats, dogs and birds. Mammalian hosts also include cows, beavers, deer, and sheep. Whether or not the signals we recorded were from cells that could infect humans is unknown. The absence of specific probes of protozoans in the marine Sola samples would indicate that the probes are acting specifically. The one large signal forEntamoeba histolytica that we recorded in the Sola sample in year 1 and for Giardia in year 2 could be related to high rainfall and river and sewage flushing, which are likely the source of these targets in the marine samples. In later 2012–2013, which was a drier year, only the higher level probes were present. The consistently high presence of the higher group level probes in the marine samples indicates we are picking up marine parasites and that the freshwater species targeted in this microarray are not present in the marine samples unless there is a major freshwater flush that in-troduces the targeted species into the offshore waters. The low signals at Sola and in the Mondony River indicate that these organisms are not present in high concentrations.
4.1.3. Similarity measurements using hierarchical clustering (Fig. 10) Within the PermutMatrix program, it is possible to compare the hybridization results using hierarchical clustering, although the pro-gram provides no percent difference scales. Only the higher group level probes for both Cyanobacteria and Protozoa were analyzed using this Fig. 9.Inferred cell numbers/L forPlanktothrixat Amelie based on qPCR amplification of theMcyA gene.
option. Among the three sites, those samples from Canet are very si-milar (see the high level of clade sisi-milarity), whereas those from Amelie and Sola are more different from each other. For all probes, there is a weak seasonal signal to the samples from Amelie and Sola (see colored boxes across the cladograms). For the cyanobacterial higher group level probes, the boxed areas at Amelie can be associated with a summer similarity (left box) and a spring/fall similarity (right box). At Sola, samples from 2013 grouped together and the boxed area represents spring samples from 2012 plus one sample from 2013. For the proto-zoan probes at Amelie, the boxed area represents samples taken pri-marily in the late spring and fall of year 1, whereas at Sola, the samples are clustered more by the year in which they were taken.
4.1.4. Validation of the microarray using qPCR
The results obtained either with the microarray or the qPCR were consistent with the water type. Indeed targeted cyanobacteria were only found in the fresh water site with both approaches. Although Microcystiswas not detected by qPCR,Planktothrixwas identified in 7 samples from Amelie, 3 corresponding to Autumn, 1 to Spring and 3 to Summer, in good agreement with the period the most favorable for Planktothrixgrowth as described byWalsby and Schanz (2002). Apart from the matrix dilution or PCR inhibition, our results can be explained by the correspondence between rRNA and DNA contents that varies accordingly to physiological state of cells. In environmental conditions, different cell states can be found: numerous cells with a medium ac-tivity, dying cells, few cells highly active or dormant. The microarray targets rRNAs, which represent the active part of the genetic material, whereas the qPCR designed assay targets DNA. This can explain the observed discrepancies: activity can be detected from a low population of highly active cells, whereas no DNA can be amplified even if there are only a few highly active cells. Nevertheless the numbers inferred from qPCR were significantly correlated with those from the microarray and the qPCR has validated the microarray.
4.2. Comparison to other sites in the μAqua project or other EU projects using the μAqua microarray
Within the μAqua project, the microarray was tested in 6 countries and cyanobacterial results were addressed in two sites above and below Rome in the Tiber River (Marcheggiani et al., 2015), 14 north German coastal fresh and brackish water sites (Baudart et al., 2016), six lakes in the Netherlands (Van Der Waal et al., 2017), one lake from Turkey (Akcaalan et al., 2017), several rivers and lakes in Ireland and one lake in Bulgaria (data never published). In the two sites where lakes were sampled (Turkey and the Netherlands), there is a clear development of cyanobacterial blooms, as would be expected from a water basin. Planktothrix was the dominant bloom former and displayed a clear seasonal pattern in the Turkish lakes being absent in the winter months (Akcaalan et al., 2017).Microcystissignals were also strong but colonies were never encountered and it was presumed that unicells were present as was documented in Medlin et al. (2015) andBarra Caracciolo et al. (2019)using the microarray validated by FISH and CARDFISH probes forMicrocystis. In the Dutch lakes, samples were only taken once in the summer of 2016 and distinct blooms ofAphanizomenonwere counted and toxins detected (Van Der Waal et al., 2017). Microcystins were detected, signals forMicrocystismatched cell counts taken at the time of sampling. Of the field tests published from lagoons and shallow inland lakes, those from the north German coast are most comparable to those sampled here (Baudart et al., 2016). In the German study, 9 freshwater sites were compared to 5 brackish water sites. The cyanobacterial probes were well represented in the freshwater sites, of which 6 were small inland ponds or seas and 3 were slow flowing rivers. The brackish water sites were stations on the Baltic or coastal lagoons, which are comparable to Canet Lagoon studied here. Those coastal lagoon sites in the Baltic had a much lower salinity because the adjacent saltwater body was the low salinity Baltic as compared to the high salinity Mediterranean. In the Baltic brackish sites, there was a constant strong Fig. 10.Hierarchical clustering of the higher group probes within the PermutMatrix program. No scale provided by the program. A–C Cyanobacteria: Amelie, Canet, and Sola, respectively. D–F Protozoa: Amelie, Canet, and Sola, respectively.
single for the genusNodulariaandNodularia spumigena,which has been reported in recurrent bloom proportions from the Baltic (Sivonen et al., 1989) and a strong signal forMicrocystisin the fresh water sites. In two other stations,Cylindrospermopsiswas detected. In that study and here, cell counts were also inferred from the microarray signal. From the North German sites and the Tiber River, no cell counts were made but relative abundance observations were made that correlated well with inferred observations. Inferred cell counts from the Tiber River (Medlin et al., 2017) were of the same magnitude as those from the Mondony River in this study and both rivers did support toxic cyanobacterial blooms even though the Tiber River flows faster than the Mondony River and is wide enough to support ship traffic up as far as Rome. The inferred cell numbers from the rivers in the North German study were higher than those obtained here and were on about the same order of magnitude as the Canet Lagoon inferred cell counts. The rivers in this part of North Germany are very shallow and slow flowing and thus there would be time and space for bloom biomass to accumulate in the system and not be flushed out by faster flowing rivers.
Outside the μAqua project, the μAqua microarray was used in an-other EU project Microcokit, which sampled four locations that spanned the length of the Tiber River (Medlin et al., 2017). The Tiber River was sampled in the μAqua project but only with samples taken above and below Rome. Blooms of cyanobacteria (Microcystis) were detected along the length of the Tiber River primarily in the fall of 2014 sampled in the Medlin et al. (2015) study but not above and below Rome in the Marcheggiani et al. (2015)study.
In our study, the total cyanobacterial community was measured by autofluorescence using flow cytometry and one date (Oct 2011) with maximum cyanobacterial flow cytometry signals in Canet also had the highest probe signals forMicrocystisspp. andPlanktothrix. Blooms de-tected at the other dates by flow cytometry were likely those of pi-coeukaryotic microalgae or other cyanobacterial species. Dates showing a high probe signal and no flow cytometric data were almost always dates where the probes for filamentous species are highlighted.
Protozoan distribution was addressed in the two sites above and below Rome in the Tiber River (Marcheggiani et al., 2015), the 14 north German coastal fresh and brackish water sites (Baudart et al., 2016), and four sites along the full length of the Tiber River (Medlin et al., 2017). In each of these studies, all of the targeted pathogenic protozoa were detected and in the north German study, higher group signals from the brackish water sites were stronger than those from the freshwater sites as they were in this study, suggesting that these probes are also picking up marine parasites but not the genera we have tar-geted in the saline sites.
4.3. Crossing the freshwater/marine interface for cyanobacteria
Cyanobacteria commonly bloom and cause toxic events in most freshwater basins (Carmichael, 2008), which is in contrast to the si-tuation in rivers. In rivers, benthic cyanobacteria can become dislodged and float downstream to become trapped in pools and along channel margins where they can accumulate biomass as mats and cause toxic events (Bouma-Gregson et al., 2018). Bouma-Gregson et al. (2018) documented the first widespread distribution of selected cyanobacterial toxins in a North American watershed. They sampled the entire length of the Eel River but did not sample in its estuary opening into the Pa-cific Ocean. In the station closest to the estuary they found moderate amounts of toxins and it could be predicted that they could be trans-ported and accumulate in marine waters. The transport of cyano-bacterial toxins into marine waters and being incorporated in seafood and causing harmful events has only recently received attention (Preece et al., 2017). The salinity tolerance of selected cyanobacteria have been reviewed byPreece et al. (2017)who note thatAnabaena, Anabaenopsis, MicrocystisandOscillatoriacan tolerate and even grow in marine waters (Table 1). They note that the cyanotoxins are chemically and physically stable in marine waters and do not degrade and thus can be readily
incorporated into shellfish. Mitigation strategies should be applied across the entire freshwater-marine continuum and can be applied to some degree.Pearl et al. (2018)emphasized that it is important to re-cognize the linkages within watersheds and to understand how up-stream activities have direct impacts on downup-stream water quality. Because of these close knit interactions, nutrient management strategies (reductions in both P and N) should target basin-wide water quality objectives and not treat each water body, i.e., river, stream, reservoir, as a closed system. Although we did not sample an entire watershed, we have shown that toxic cyanobacterial blooms can develop within slow flowing rivers. Canet lagoon receives freshwater input from small drainage ditches and canals and from one main river, the Reart, which is mostly dry with some subsurface waters. Inoculation of the brackish water lagoon with Cyanobacteria would come from the smaller inlets rather than the river as well as from birds feeding in the area.
Preece et al. (2017)also comment on the global geographical dis-tribution of freshwater cyanobacteria. In Europe, the Baltic is the most common water body where cyanobacterial blooms have been docu-mented regularly.Nodularia spumigena, Aphanizomenonspp., and Ana-baenaspp. (=Dolichospermumspp.) now occur every summer in the Baltic and can cover areas spanning over 125,000 km2(Öberg, 2016). It is not surprising that our microarray detected more cyanobacteria in the coastal lagoon than it did in the river and offshore marine site. Microcystis has also been reported from several estuaries along the Iberian peninsula (see references inPreece et al., 2017).
Toxin concentrations have not been widely reported in the in-cidences of freshwater cyanobacteria in marine waters but most have been associated with eutrophication (Preece et al., 2017). Low levels of microcystins have been detected in coastal lagoons and estuaries along the southern Californian coast near San Diego (Howard et al., 2017). Microcystins produced in freshwater systems have been shown to cause effects far downstream of their biological origin, have been detected in downstream coastal estuaries and near-shore marine waters where they have accumulated in marine shellfish and mammals (Chen et al., 1993; Gibble and Kudela, 2014,2016,Miller et al., 2005,2010,Preece et al., 2015a,2015b,2017,Takahashi et al., 2014;Tatters et al., 2017). More worrying is the report that cyanotoxins can accumulate in the muscle tissue of shellfish (see references inPreece et al., 2017).
In this study no freshwater basin was studied. Instead, we sampled a river with a medium flow rate, a coastal lagoon and an offshore marine site. Although the river site was not directly connected to the coastal lagoon, the lagoon was fed by small ditches draining fields and one normally dry river and Cyanobacteria would have entered the brackish lagoon via the small freshwater inlets. The brackish lagoon offers a direct comparison to a freshwater basin in that the cells were retained within the system and not regularly flushed, allowing biomass to ac-cumulate and potential toxic cyanobacterial blooms to develop. Of the three sites, toxins were only detected in Canet Lagoon. Microcystins, nodularin, cylindrospermopsins and saxitoxins were recorded by the RT-cyano microarray that captured and amplified mRNA from selected toxin genes (Medlin, 2018) but only microcystins, and cylin-drospermopsins were detected by chemical analyses in a companion study on a few occasions over the two-year period (Greer et al., 2016; Rodriguez et al., 2016). The causative organisms,Microcystisand Cy-lindrospermopsis, were detected here with the species microarray in this study. Anatoxins were detected chemically in Canet Lagoon but these genes were not on the toxin array (Medlin, 2018) but potential species (Anabaena) that could produce this toxin were consistently reported from Canet Lagoon and isolated into culture. The species and the toxin array when used together should be able to provide a secure early warning system for cyanobacterial toxin blooms as defined by health and fishery administrators (Rosalba et al. 2018). Preliminary evidence suggests that the toxin array can pick up the expression of toxin genes long before they can be detected by chemical means but this remains to be tested empirical.
4.4. Crossing the marine freshwater interface for parasitic protozoans Parasitic protozoans are also able to live in both marine and freshwater systems but their presence in marine system has not been the subject of wide investigation.Certad et al. (2019)has provided the first survey of cryptosporidians in a variety of wild fish along French coasts. They were concerned that parasites in fish could be transmitted to humans because of the way the fish were prepared for human con-sumption. Notably aquaculture fish did not contain any parasites, pre-sumably because their food was controlled. Miller et al. (2005) sug-gested that mussels could be used to monitor water quality in southern California and noted that factors significantly associated with detection ofCryptosporidiumspp. in mussel batches were exposure to freshwater outflow and mussels tested within a week after a rainfall event. Cysts of CryptosporidiumandGiardiawere detected in Californian sea lions by antibodies byDeng et al. (2000)who also suggested that sea lions could serve as hosts and thus, reservoirs for the environmental transmission of these parasites. Filter-feeding shellfish, such as mussels, can also con-centrate protozoan parasites and other pathogens in aquatic environ-ments (Lucy et al., 2008), either from freshwaters entering the marine system or by filtering faeces from sea lions (Adell et al., 2014). Because the cysts of these pathogens can remain viable for at least one year, the monitoring of them in marine hosts, who are also long-lived becomes an attractive option/tool for long-term monitoring (Adell et al., 2014). The species array presented here also offers an additional long term mon-itoring tool.
5. Conclusions
Our microarray for pathogenic pathogens obtained high signals for all of the targets on the phylochip (bacteria are presented elsewhere). When compared to the toxin array, target organisms that could produce the highlighted toxins on that array (Medlin, 2018) were present on the phylochip on the same sampling day. Cultures of some cyanobacterial species were also established from the same sampling day. The effi-ciency of the phylochip has also been compared to other molecular tools and found to outperform them. The greatest percentages of correct identification and highest sensitivity of the dominant source in dou-bletons were 100, 96, and 92 % for PhyloChip, Illumina, and TRFLP, respectively, in a study of beach water quality looking at the pathogenic bacterial community (Cao et al., 2013). They also concluded that qPCR assays with their relative low sensitivity are inappropriate for man-agement applications where high analytical sensitivity is required for detecting very low levels of human waste input. The differences be-tween the qPCR and microarray results shown here, although they targeted two different genes, would support similar conclusions. Where signals did overlap between the two methods, they were of different magnitudes and this suggests the use of the toxin array (Medlin, 2018) along with the species array shown in this study is a better strategy for monitoring for toxic cyanobacteria with molecular tools. The signals from a phylochip are appropriate for transmission in wireless sensor networks, such as those already developed for abiotic measurements for monitoring for water quality remotely (Barabde and Shruti Danve, 2015) and should be a future effort in the field of phylochips. The probes developed here for freshwater pathogens has been successfully applied to samples taken across a marine-freshwater interface and thus are appropriate for monitoring of the entire watershed to document the flux of toxic organisms into the marine ecosystem.
Declaration of Competing Interest
The authors declare that they have no known competing financial interests or personal relationships that could have appeared to influ-ence the work reported in this paper.
Acknowledgments
This research was funded by the European Commission as part of the FP7 European project; MicroAqua, Grant No. 265409. Special thanks to the molecular biology platform and the flow cytometry ser-vices of the University for their support.[CG]
Appendix A. Supplementary data
Supplementary material related to this article can be found, in the online version, at doi:10.1016/j.hal.2019.101703.
References
Adell, A., Smith, W.A., Shapiro, K., Melli, A., Conrada, P.A., 2014. Molecular epide-miology ofCryptosporidiumspp. andGiardiaspp. in mussels (Mytilus californianus) and California Sea Lions (Zalophus californianus) from central California. Appl. Environ. Microbiol. 80, 7732–7740.
Ahn, J., Yang, L., Paster, B.J., Ganly, I., Morris, L., et al., 2011. Oral microbiome profiles: 16S rRNA pyrosequencing and microarray assay comparison. PLoS One 6, e22788. Akcaalan, R., Meric Albay, M., Koker, L., Julia Baudart, J., Guillebault, D., Fischer, S.,
Weigel, W., Medlin, L.K., 2017. Seasonal dynamics of freshwater pathogens as measured by microarray at Lake Sapanca, a drinking water source in the north-eastern part of Turkey. Environ. Mon. Assess. 212. https://doi.org/10.1007/s10661-017-6314-7.
Ballarini, A., Segata, N., Huttenhower, C., Jousson, O., 2013. Simultaneous quantification of multiple bacteria by the BactoChip microarray designed to target species-specific marker genes. PLoS One 8 (2), e55764.https://doi.org/10.1371/journal.pone. 0055764.
Barabde, M., Shruti Danve, S., 2015. Real time water quality monitoring system. IJIRCCE 3, 5064–5069.https://doi.org/10.15680/ijircce.2015.0306016.
Barra Caracciolo, A., Dejana, L., Fajardo, C., Grenni, P., Martin, M., Mengs, G., Sánchez-Fortún, S., Lettieri, T., Saccà, M.L.L., Medlin, L.K., 2019. A new fluorescent oligo-nucleotide probe for in-situ identification ofMicrocystis aeruginosain freshwater. Front. Microbiol. 114, 503–513.
Baudart, J., Guillebault, D., Mielke, E., Meyer, T., Tandon, N., Fischer, S., Weigel, W., Medlin, L.K., 2016. Microarray (phylochip) analysis of freshwater pathogens at sev-eral sites along the Northern German coast transecting both estuarine and fresh-waters. Appl. Microbiol. Biotechnol. 101, 871–886. https://doi.org/10.1007/s00253-016-7937-2.
Bouma-Gregson, K., Kudela, R.M., Power, M.E., 2018. Widespread anatoxin-adetection in benthic cyanobacterial mats throughout a river network. PLoS One 13, e0197669.
https://doi.org/10.1371/journal.pone.0197669.
Brookes, J.D., Carey, C.C., 2011. Resilience to blooms. Science 334 (6052), 46–47 386. Bukowska, A., Kaliński, T., Koper, M., Kostrzewska-Szlakowska, I., Kwiatowski, J.,
Mazur-Marzec, H., Jasser, I., 2017. Predicting blooms of toxic cyanobacteria in eutrophic lakes with diverse cyanobacterial communities. Sci. Rep. 7, 8342.https://doi.org/10. 1038/s41598-017-08701-8.
Cabral, J., 2010. Water microbiology. Bacterial pathogens and water. Int. J. Environ. Res. Public Health 7, 3657–3703.https://doi.org/10.3390/ijerph7103657.
Cao, Y., Van De Werfhorst, L.C., Dubinsky, E.A., Badgley, B.D., Sadowsky, M.J., Andersen, G.L., Griffith, J.F., Holden, P.A., 2013. Evaluation of molecular community analysis methods for discerning fecal sources and human waste. Water Res. 47, 6862–6872.
https://doi.org/10.1016/j.watres.2013.02.061.
Caraux, G., Pinloche, S., 2005. PermutMatrix : a software for analysing and visualising data. Bioinformatics 21, 1280–1281.
Carey, C.C., Ibelings, B.W., Hoffmann, E.P., Hamilton, D.P., Brookes, J.D., 2012. Eco-387 physiological adaptations that favour freshwater cyanobacteria in a changing cli-mate. Water 388 Research 46 (5), 1394–1407.
Carmichael, W., 2008. A world overview—One-hundred-twenty-seven years of research on toxic cyanobacteria—Where do we go from here? In: Hudnell, H.K. (Ed.), Cyanobacterial Harmful Algal Blooms: State of the Science and Research Needs. Springer, New York, NY, USA, pp. 105–125.
Certad, G., Follet, J., Gantois, N., Hammouma-Ghelboun, O., Guyot, K., Benamrouz-Vanneste, S., Fréalle, E., Seesao, Y., Delaire, B., Creusy, C., Even, G., Verrez-Bagnis, V., Ryan, U., Gay, M., Aliouat-Denis, C., Viscogliosi, E., 2019. Prevalence, molecular identification, and risk factors forCryptosporidiuminfection in edible marine fish: a survey across sea areas surrounding France. Front. Microbiol. 10, 1037.https://doi. org/10.3389/fmicb.2019.01037.
Chen, D.Z., Boland, M.P., Smillie, M.A., Klix, H., Ptak, C., Andersen, R.J., Holmes, C.F., 1993. Identification of protein phosphatase inhibitors of the microcystin class in the marine environment. Toxicon 31, 1407–1414.
Deng, M.Q., Peterson, R.P., Cliver, D.O., 2000. First findings ofCryptosporidiumand Giardiain California sea lions (Zalophus californianus). J. Parasitol. 86, 490–494.
Dittami, S.M., Edvardsen, B., 2013. GPR-Analyzer: a simple tool for quantitative analysis of hierarchical multi-species microarrays. Environ. Sci. Pollut. Res. 20 (10), 6808–6815.
Gibble, C.M., Kudela, R.M., 2014. Detection of persistent microcystin toxins at the land-sea interface in Monterey. Bay, California. Harmful Algae 39, 146–153.