A PROTOCOL FOR ENHANCED IMAGING AND
QUANTIFICATION OF CERVICAL CELLS UNDER
SCANNING ELECTRON MICROSCOPE
Yessi Jusman a,1,*, Agus Jamala,2, May Valzonb,3, Khairunnisa Hasikinc,4, Siew Cheok Ngc,5 a Department of Electrical Engineering, Faculty of Engineering, Universitas Muhammadiyah Yogyakarta, Bantul,
Daerah Istimewa Yogyakarta 55183, Indonesia
bDepartment of Anatomy, Faculty of Medical and Health Science, Universitas Abdurrab, Pekanbaru, Riau, Indonesia cDepartment of Biomedical Engineering, Faculty of Engineering, University of Malaya, 50603 Kuala Lumpur
1 Email:[email protected]*; 2 Email:[email protected]; 3 Email:[email protected]; 4[email protected]; 5[email protected]
*corresponding author
I. Introduction
The applications of optical systems and technologies to biology and medicine have shown promising results in worldwide disease prevention [1-4]. Field Emission Scanning Electron Microscopy and Energy Dispersive X-Ray (FE-SEM/EDX) is one of the visual tools to characterize materials in terms of morphology and elemental characteristics. FE-SEM/EDX has been applied in various biological material studies, including cells, bacteria, fungi, and chromosomes. Assessment of tiny topographic details on the surface of whole or fractionated objects is essential in the field of modern materials science [5], [6]. The assessment of the topographic details of the objects is crucial to material characterization, and to understand the mechanism and mode of the object formation. Besides, the FE-SEM/EDX allows the evaluation and prediction of the object under a given set of environmental or load conditions since it produces the highest resolution and best contrast images that illustrate the most exceptional structural features of the object.
However, sample preparation is a critical step during the FE-SEM/EDX data acquisition process. Improper preparations of organic and inorganic samples usually manifest problems (i.e., charging
ARTICLE INFO (8 pt) A B S T R A C T
Article history: Received June 2019 Revised July 2019 Accepted December 2019
The application of Field Emission Scanning Electron Microscopy
and Energy Dispersive X-Ray (FE-SEM/EDX) for the
characterization of biological samples can produce promising results for classification purposes. The limitations of the established sample preparation technique of cervical cells for the FE-SEM/EDX study that differentiate between normal and abnormal cells prompted the development of a proposed protocol for the preparation of cervical cells. The proposed protocol was conducted by a McDowell-Trump fixative prepared in 0.1M phosphate buffer without osmium tetroxide at 4°C for two h in the fixation process. Morphologically, the cervical cells scanned under the FE-SEM/EDX did not present blackening effects, and the structure of the cells was not broken based on the FE-SEM images. Quantitatively, the possible elemental distributions in the cells, such as carbon, nitrogen, oxygen, and sodium, are detected in samples prepared by the proposed protocol. The analyzed elements were validated using the Attenuated Total
Reflection and Fourier Transform Infrared (ATR/FTIR)
spectroscopy. Moreover, by avoiding osmium tetroxide fixation, the time required for sample preparation decreased significantly. This sample preparation protocol can be used for normal and abnormal cervical cells in achieving better results in terms of morphological, detected elemental distribution, and rapid in time.
Copyright © 2017 International Journal of Artificial Intelligence Research. All rights reserved.
Keywords: Cervical Cells Protocol FE-SEM/EDX Characterization Images
effect due to accumulation of electrons on the scanned area of the sample and local radiation damage of the sample induced by energetic electrons through different mechanisms such as decomposition, sputtering, sublimation, ionization, diffusion, or transformation) that could affect the assessment process [7].
Some researchers have investigated sample preparation for individual cells. The biological sample preparation for SEM imaging of porcine retina has been examined by comparing Critical Point Drying (CPD), Hexamethyldisilazane (HMDS), and direct imaging using Environmental SEM (E-SEM). The research concluded that the HMDS technique was the best technology applied for the porcine retina. Meanwhile, the preparation protocol for differentiated stem cells has been proposed by applying methanol in the dehydration process [8]. However, the protocol was only applicable to differentiate cells.
In our previous study, although the osmium-HMDS technique produced good results of cervical cells in the morphological and elemental characteristics of the cervical cell as compared to the osmium-CPD technique, the former still has limitations as addressed in our previous study [9]. Plate artifacts as the morphological sign of cell deterioration and low detection of elements in the cervical cell have appeared as a disadvantage of the osmium-HMDS technique. In order to overcome the problems, effective sample preparation techniques, and low voltage scanning electron microscope are required to improve image quality and detect elemental distribution for characterizations [10], [11].
In principle, the sample preparation for biological specimens requires three significant steps; fixation, dehydration, and drying process. For the fixation step, osmium tetroxide for the FE-SEM/EDX technique is usually used. All the previous protocols used for the SEM analysis have used osmium postfixation, as it is known to yield the best possible membrane preservation [12]. Osmium postfixation, dehydration using ethanol, and drying using the HMDS techniques have been chosen in our previous study to obtain a better quality of cervical cells in terms of qualitative and quantitative than the osmium postfixation, long-chain ethanol series, and CPD techniques [9]. However, osmium postfixation is known to produce blackening of the specimens [13], especially lipid contents in the cell [14], resulting in reduced differences in contrast and 3-D character of the differentiated cells [8]. Therefore, by avoiding the use of toxic osmium tetroxide for postfixation, we have developed a protocol for the preparation of cervical cells for FE-SEM/EDX analysis, which is safer and cost-effective in order to be used as the first step in our study.
In this chapter, we report the investigation of the morphology structure of the surface and element contents in cervical cells using FE-SEM/EDX based on the developed protocol for sample preparation. Our protocol approach provides a simple, rapid, cost-effective, easy, and convenient route to obtain the number of elements of the microstructure. Materials and methods, results, discussions, and conclusion sections are presented in Sections 2, 3, 4, and 5, respectively.
II. Materials and Methods
The description of our material and methodology of the research is presented. In this study, cervical tissue and cells (namely cervical samples) were used to test the proposed protocol. Similar cervical samples were used as materials in this research to evaluate the capability of sample preparation techniques. The comparison of our previous technique in [9] and the proposed protocol was conducted for testing the effectiveness.
After preparation, the samples were tested using the FE-SEM/EDX and Attenuated Total Reflection and Fourier Transform Infrared (ATR/FTIR). In the FE-SEM/EDX testing, the samples were placed in a low vacuum chamber of FE-SEM/EDX to observe different effects of both techniques in terms of morphological and elemental characteristics of the samples used. FTIR analysis was used to investigate the compositional characteristics in the cervical samples to determine the validity of the results of the elemental characteristics obtained from the FE-SEM/EDX technique.
The description of our material and methodology of the research is presented. In this study, cervical tissue and cells (namely cervical samples) were used to test the proposed protocol. Similar cervical samples were used as materials in this research to evaluate the capability of sample
preparation techniques. The comparison of our previous technique in [9] and the proposed protocol was conducted for testing the effectiveness.
After preparation, the samples were tested using the FE-SEM/EDX and Attenuated Total Reflection and Fourier Transform Infrared (ATR/FTIR). In the FE-SEM/EDX testing, the samples were placed in a low vacuum chamber of FE-SEM/EDX to observe different effects of both techniques in terms of morphological and elemental characteristics of the samples used. FTIR analysis was used to investigate the compositional characteristics in the cervical samples to determine the validity of the results of the elemental characteristics obtained from the FE-SEM/EDX technique.
A. Materials
In this research, cervical samples used to check the capability of the proposed protocol were taken from the rest of the diagnosed cervical cells by pathology at University Malaya Medical Centre (UMMC). The Medical Ethics Committee (MEC) of the UMMC has approved the collection of the Thin Prep vials from the pathology department. These Thin Prep vials were from underwent routine cervical screening for cervical precancerous cells of patients in 2015. The samples used in this study consisted of 10 regular and ten abnormal cervical cell samples to test the capability of the protocol for both standard and abnormal cells. The samples were kept in the refrigerator from contamination until they were used. For the next process, these samples were sent to various laboratories in the Faculty of Dentistry, University of Malaya, Kuala Lumpur for the sample preparation, and capturing image process using FE-SEM/EDX.
B. Methods
A protocol for cervical samples preparation has been proposed in order to maintain the natural morphological structure and physical characteristics of the cervical samples (tissue and cells). In this study, the proposed sample preparation technique was employed with three main steps. In the first step, the specimens were fixed in a McDowell-Trump fixative prepared in 0.1M phosphate buffer or cacodylate buffer (pH 7.2) at 4°C for two h and then washed twice with 0.1% of a Phosphate-Buffered Saline (PBS) for 10 min each time. For the dehydration process, a series of ethanol dilution dehydration series was implemented at 50%, 75%, and twice at 95% for 15 min each time, and three times at 100% with an equilibration step of 20 min each time. In the drying process, the dehydrate specimens were immersed in 1-2 mL of HMDS for 10 min, the HMDS was then decanted into the specimen vials and put into the desiccator and left to air dry at room temperature. The final process was to mount the dried specimens on circular stainless steel molds, coated with 10 nm of pure gold in a vacuum sputter coater, and kept in a desiccator or under vacuum at all times before they were viewed under FE-SEM/EDX. This proposed technique is called the No Osmium HMDS technique.
This research used SEM with brand Quanta Field Emission Gun (FEG) 250 SEM. The FE-SEM provides flexibility and versatility to handle the challenges of today’s wide-ranging research needs. In both sample preparation techniques, the capturing of the FE-SEM image was implemented in the same working distance (10 mm) and done under a low vacuum to produce optimal imaging conditions, and this distance is useful for the average voltage range (5 to 20 kV). Since the overarching goal of the study was to investigate biological samples, as well as cervical samples to achieve high-resolution images at high magnifications, FE-SEM was operated at low voltage (10 kV for cervical samples). Elevation, tilt, and azimuth degrees in the data acquisition were set up for 35º, 0.01º to 0.5º, and 0º, respectively. Both In-Lens (I-L) and Everhart-Thornley (E-T) detectors were used to create the image.
C. Characterization and analytical methods
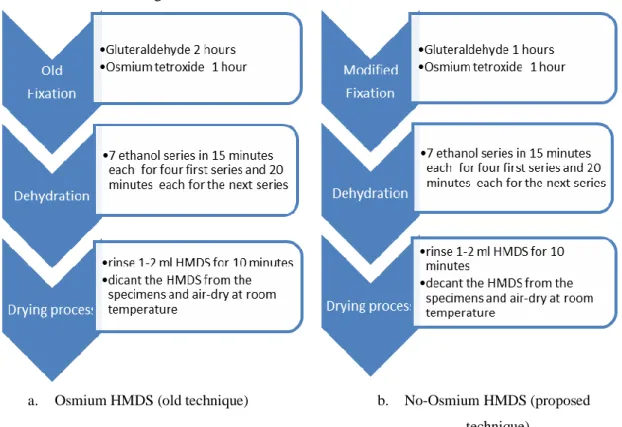
To investigate the capability of the proposed sample preparation technique, previous sample preparation techniques were considered for comparison, as presented in Figure 1. As claimed in our previous study, the Osmium HMDS technique presented better qualitative and quantitative results compared to the Osmium CPD technique [9]. However, based on another previous study, the blackened specimen was produced when the osmium was applied to the sample [8]. The blackening can affect the elemental composition of the specimen. In the proposed technique, the fixation step was modified where the osmium fixative was prevented due to some problems affecting the cervical cells [8].
The fixation step was to use the Glutaraldehyde for 1 hour. Dehydration and drying process are done similar to our previous study [9] where seven ethanol series in 15 minutes each for the four first series and 20 minutes each for the next series then rinsed 1-2 ml HMDS for 10 minutes decanted the HMDS from the specimens and air-dried at room temperature as presented in Figure 1a and 1b. The modified fixation, dehydration and drying steps are presented in Figure 2b.
In this paper, the osmium HMDS and no osmium HMDS techniques (further called Osmium and No Osmium techniques, respectively) were compared in terms of qualitative and quantitative results. The qualitative analysis focused on the effect of osmium showed on the FE-SEM images, and the quantitative analysis was based on the corresponding EDX elemental distribution of the cervical cells in the FE-SEM images.
a. Osmium HMDS (old technique) b. No-Osmium HMDS (proposed
technique)
Fig. 1.The difference of the fixation process for both osmium HMDS and no osmium HMDS techniques
C.1 Microstructure analysis
Based on the qualitative results, the comparisons of both techniques were presented in terms of cell attachment in the tissue, morphologic signs of cell deterioration (i.e., plate artifacts and crystals of the cells), and blackening of the specimens for the reasonable and abnormal cell classes.15 The visual comparison of FE-SEM images was viewed when captured in 1000 to 10000x magnification to investigate the region of interest. The existence of blackened specimens, level of cell attachment, and a morphological sign of cell deterioration was presented clearly in 5000-10000x, 1000-3000x, and 3000x-10000x magnification, respectively. The existence of the bacteria and virus in the samples was not used for microstructure analysis of the sample preparation performances. The bacteria and virus might be available in the cervical samples, as presented in the pathology diagnosis.
C.2 Elemental analysis
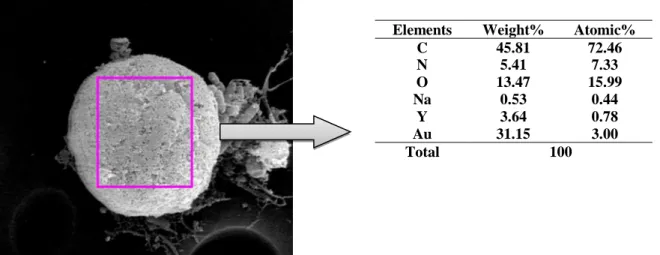
The effect of osmium on the elemental distribution in cervical cells was analyzed using FE-SEM/EDX. For the FE-SEM/EDX analysis, an accelerating voltage of 10~20 kV was used with a scan time of 60 s per sampling area. An example of the elemental distribution in the surface of cells (i.e., cell diameter: 3μm to 6μm) scanned by FE-SEM/EDX equipment, and INCA software is presented in Figure 2. The quantitative results based on FE-SEM/EDX elemental distribution in the pink box area were compared for both techniques in terms of weight and atomic percentage. The
possible elements in the cells were used in the analysis of this study, as presented in the previous studies [16], [17]. The rest of the elements which can be coming from the coating material was ignored.
Elements Weight% Atomic%
C 45.81 72.46
N 5.41 7.33
O 13.47 15.99
Na 0.53 0.44
Y 3.64 0.78
Au 31.15 3.00
Total 100
Fig. 2.Example of data acquisition on the surface of the cervical samples
C.3 Compositional analysis
Spectrum One FTIR (Perkin Elmer, Waltham, MA, USA) with a PIKE GladiATR Attenuated Total Reflectance (ATR) accessory (PIKE Technologies, Madison, WI, USA) was used for the compositional analysis of cervical cell samples to examine the chemical compound in the cells as a supporter for FE-SEM/EDX elemental distribution. The cervical cell samples were dried on a microscope slide, and the dried samples were scraped and placed in the FTIR specimen holder. The spectra were recorded in the range of 2000-800 cm-1. Before comparison, baseline correction and
normalization were performed. The central peak located around 1900 and 1000 cm-1 was strictly observed for the cervical cell compound.
III. Results
In this section, the results of normal and abnormal cervical cells were used to analyze the effect of the presence of osmium in the sample preparation techniques for FE-SEM/EDX. Three types of analyses (i.e., FE-SEM images, FE-SEM/EDX spectrum, and FTIR spectrum) were presented for the qualitative and quantitative analysis. For FE-SEM images analysis, one sample of healthy cervical cells FE-SEM images in five-level magnifications based on both osmium and no osmium techniques were observed and compared in terms of cell attachment on the tissue, blackening of the specimens, and morphological signs of cell deterioration as presented in Figure 3. The abnormal cell samples based on both osmium and no osmium techniques were also compared based on the same qualitative terms in different magnifications, as presented in Figures 4. For quantitative analysis, FE-SEM/EDX normal and abnormal cell spectrum results from both the osmium and no osmium techniques were presented in Tables 1 and 2 respectively. The composition of elemental distribution existed in the cervical cells was compared in terms of weight and atomic percentage. The composition of the synthesized cervical cell chemical compound was determined by FTIR spectroscopy in the range of 2000-800 cm-1.
A. Field emission scanning electron microscopy
A
A
B
B
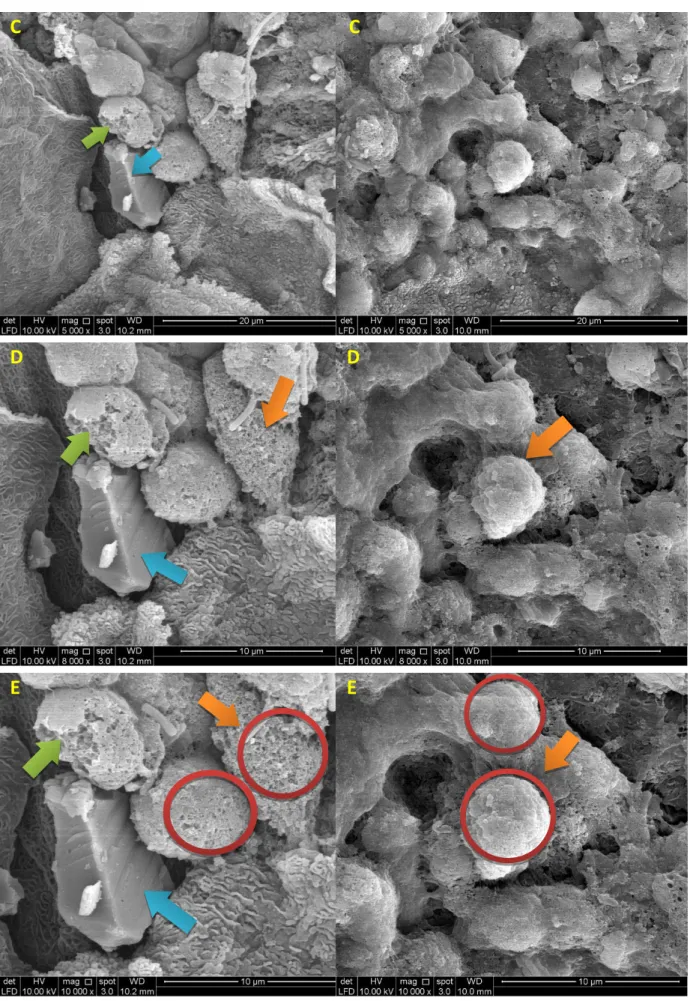
Fig. 3.Comparison of normal specimen images using osmium HMDS (left) versus no osmium HMDS (right) techniques
Note: A=1000x magnification, B=3000x magnification, C=5000x magnification, D=8000x magnification, E=10000x magnification. Purple, red, green, light blue, orange arrowheads refer to a higher degree of cell attachment, plate artifact, membrane deterioration, crystals, and blackening effect, respectively. The same types of samples were prepared for both osmium HMDS (left) and no osmium HMDS (right) techniques by an accelerating voltage of 10~20 kV in the same working distance 10 mm.
The healthy cervical cells prepared using the osmium, and no osmium techniques are presented in Figure 3. The FE-SEM images of the healthy cells were presented in several different magnifications (i.e., 1000x, 3000x, 5000x, 8000x, and 10000x magnification). Based on the FE-SEM images, the morphological effects of the cervical cell were compared between the osmium and no osmium techniques. In terms of cell-surface interaction 5, there was a higher degree of cell attachment to the tissue in the sample of no osmium HMDS technique compared to the sample of osmium HMDS technique as presented in images with 1000-3000 magnification referred by the purple arrowhead in Figures 3A and 3B respectively. The cells on the osmium-HMDS technique samples were not attached to the tissue. The tissue that was not attached to the cells existed as the plate artifacts for the osmium HMDS technique, as presented in Figure 3A and referred by the red arrowhead. The membrane deterioration was detected in the osmium HMDS technique referred by the green arrowhead.
D
D
Meanwhile, the crystals of the cells were formed in the normal cervical cell prepared by the osmium HMDS technique referred by the light blue arrowhead in Figures 3B to 3E. The crystals of the cells were absent from the normal cell prepared by no osmium HMDS technique, as shown in Figures 3B to 3E. When compared to the images from the no osmium technique, images of the osmium technique showed morphological blackening of the cell specimen as presented clearly at 8000x (Figure 3D) and 10000x magnification (Figure 3E) (i.e., red circles referred by light orange arrowhead).
A
A
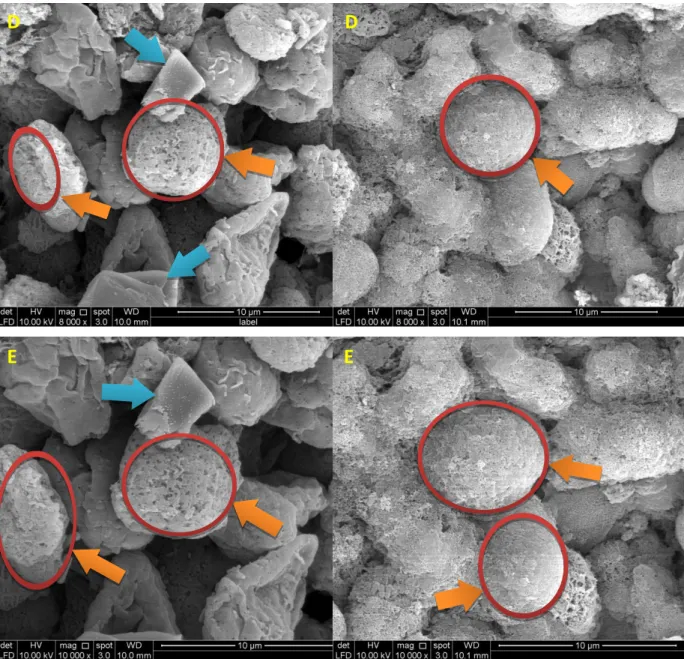
Fig. 4.Comparison of abnormal specimen images for osmium HMDS (left) versus no osmium HMDS (right) techniques
C
C
D
D
Note: A=1000x magnification, B=3000x magnification, C=5000x magnification, D=8000x magnification, E=10000x magnification. Purple, red, green, light blue, and orange arrows refer to the degree of cell attachment, plate artifact, membrane deterioration, crystals, and blackening effect, respectively. The same types of samples were prepared for both osmium HMDS (left) and no osmium HMDS (right) techniques by an accelerating voltage of 10~20 kV in the same working distance 10 mm.
In the abnormal cervical cells, there was a higher degree of attachment to the abnormal cell to the tissue in the sample for the no osmium HMDS technique, as shown in images with 1000-3000x magnification compared to the osmium HMDS technique as referred by purple arrowhead presented in Figures 4A and 4B. The tissue that was not attached to the cells appeared as plate artifacts in the specimen of the osmium HMDS technique, as shown in Figure 4A, referred by a red arrowhead. The membrane cell deterioration detected was referred by the green arrowhead, as presented in Figures 4C to 4E. By referring to the light blue arrowhead in Figures 4B to 4E, the crystals of cells existed in the cells prepared by the osmium HMDS technique. The blackening effect of the osmium technique is presented in Figures 4D and 4E on the cells referred by the red circles and orange arrowhead.
B. Energy-dispersive X-ray
These are organic elements in the cells detected at low energy voltages. This study has found the Carbon (C), Nitrogen (N), Oxygen (O), Sodium (Na), Magnesium (Mg), Calcium (Ca), Copper (Cu), Aluminum (Al), Silicon (Si), Yttrium (Y), Zinc (Zn), Chlorine (Cl), Iron (Fe), Potassium (K), and Titanium (Ti) elements in the cervical cells by using the FE-SEM/EDX technique. As presented in our previous study, there were several elements not detected for all samples [9]. In this study, Cu, Al, Si, Y, Zn, Cl, Fe, K, and Ti elements were not detected in 50 to 80% of all used samples and detected only in 0.01 to 0.05% of the used samples. Thus, the elements were ignored and cannot be used for analysis in this study due to the elements being used as features. Also, based on the previous studies, C, N, O, Na, and Ca were used for their analysis [16], [17]. Therefore, only five elements (i.e., carbon, nitrogen, oxygen, sodium, and calcium) were used for comparison to test the capability of our proposed protocols.
The distribution elements on the same cervical samples were detected to be different between samples prepared on the osmium HMDS and no osmium HMDS techniques. Table 1 presents the comparison of the elements in healthy cervical cells for the osmium HMDS and no osmium HMDS techniques. In this study, the comparison of elemental distribution was applied in terms of weight and atomic percentage. The effect of the osmium for the elemental distribution in the sample was analyzed in both standard and abnormal cells.
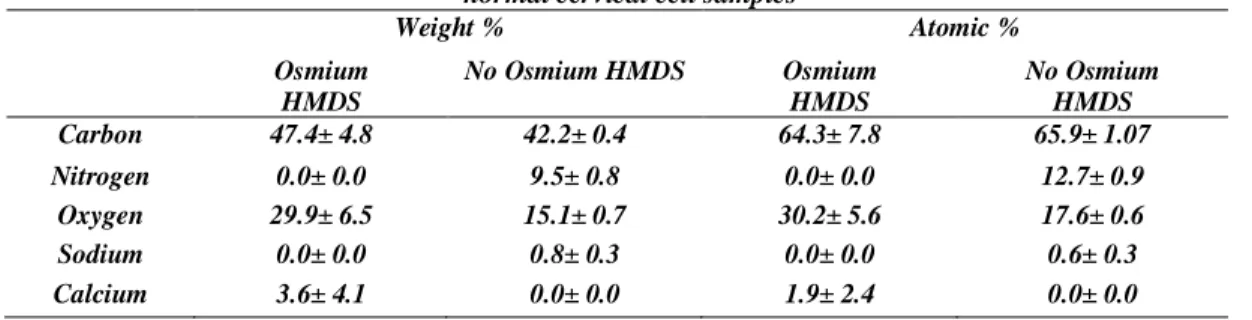
Based on Table 1, the distributions of five elements for ten standard specimens differed significantly between the cells for the osmium HMDS and no osmium HMDS techniques. Meanwhile, in terms of weight percentage, the percentage of carbon and oxygen were significantly higher for the osmium HMDS than no osmium HMDS techniques. However, nitrogen and sodium did not exist in the osmium HMDS technique, whereas all these elements existed in the no osmium HMDS technique. However, the calcium element was detected in the osmium HMDS technique and was not detected in the no osmium HMDS technique. Based on these findings, it can be concluded that for the healthy cervical cells, the existences of the nitrogen and sodium elements were corrupted, and the calcium element was detected in the osmium HMDS technique for both weight and atomic percentage terms.
Table 1: Comparison of elemental distribution for osmium HMDS and no osmium HMDS for 10 normal cervical cell samples
Weight % Atomic %
Osmium HMDS
No Osmium HMDS Osmium
HMDS
No Osmium HMDS
Carbon 47.4± 4.8 42.2± 0.4 64.3± 7.8 65.9± 1.07
Nitrogen 0.0± 0.0 9.5± 0.8 0.0± 0.0 12.7± 0.9
Oxygen 29.9± 6.5 15.1± 0.7 30.2± 5.6 17.6± 0.6
Sodium 0.0± 0.0 0.8± 0.3 0.0± 0.0 0.6± 0.3
As tabulated in Table 2, the same elements also existed in different portions of weight and atomic percentage for ten abnormal cell samples. The trend of the results was quite similar to the standard samples. Carbon and oxygen elements in the osmium HMDS technique appeared higher than the elements in no osmium HMDS technique. Meanwhile, nitrogen and sodium elements were not detected in the osmium HMDS technique. The calcium element was detected in the osmium HMDS technique. Therefore, by using the osmium HMDS technique, the existence of the nitrogen and sodium elements was also corrupted, and the calcium element was detected in the abnormal cervical cells for both weight and atomic percentage terms.
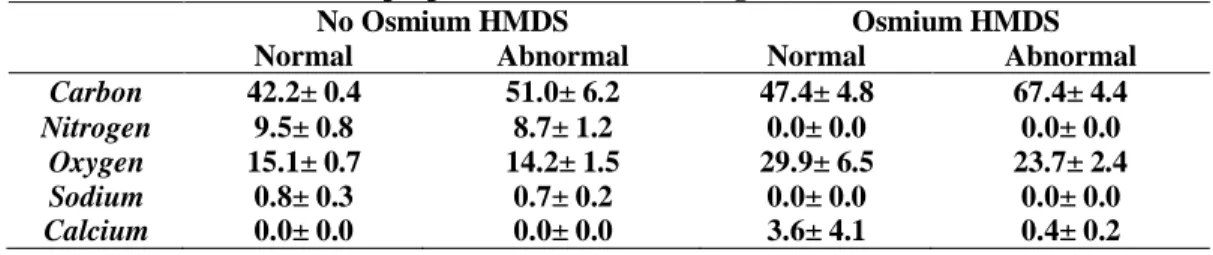
For further detailed analysis, the comparison of elemental distribution in normal and abnormal cervical cell samples was carried out to examine the effect of osmium in the sample preparation techniques. Based on Table 3, for the no osmium HMDS technique, four elements (i.e., carbon, nitrogen, oxygen, and sodium) were detected in both standard and abnormal cervical cells. However, for the osmium HMDS technique, three elements were detected (i.e., carbon, oxygen, and calcium) in the ordinary and abnormal samples. Based on Tables 1, 2, and 3, the existence of the nitrogen and sodium elements was only detected in the no osmium HMDS techniques. Meanwhile, the existence of calcium element was only detected in the osmium HMDS technique.
C. Fourier transform infrared spectroscopy
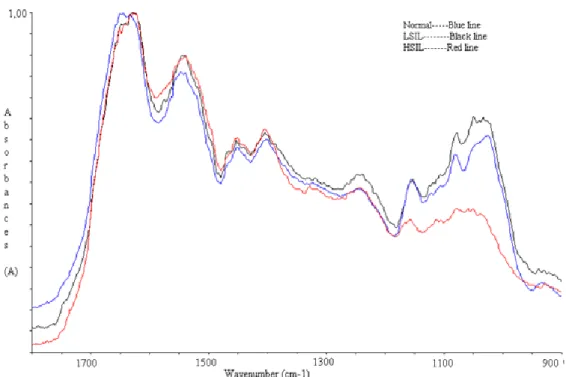
The results of the FTIR analysis for cervical cells in normal and abnormal cases are presented in Figure 5. Based on Figure 5, C=O, C=C, C=N, and N=O at the frequency of 1900-1650 cm-1, 1780-1650 cm-1, 1700-1430 cm-1 existed in different values as spectral features for the reasonable and abnormal cervical cells. It showed typical spectral features of a glycogen-rich with healthy 1151, 1078, and 1028 cm-1 bands due to coupled C–O and C–C stretching and C–O–H deformations motions of glycogen. The standard cervical cell samples were presented by the blue lines, and the abnormal cervical cell samples (i.e., LSIL and HSIL) were presented by the black and the red lines. As stated in the previous study, based on the absorbance, the intensity peak values, corrected area under the peak values, and shift of the frequency value for the detected peak were used as features in the previous research to differentiate between the normal and abnormal cervical cells [18], [19].
Table 3: Comparison of elemental distribution in normal and abnormal cervical cell samples for examining the effect of osmium and no osmium techniques in sample
preparation in terms of weight (%)
No Osmium HMDS Osmium HMDS
Normal Abnormal Normal Abnormal
Carbon 42.2± 0.4 51.0± 6.2 47.4± 4.8 67.4± 4.4
Nitrogen 9.5± 0.8 8.7± 1.2 0.0± 0.0 0.0± 0.0
Oxygen 15.1± 0.7 14.2± 1.5 29.9± 6.5 23.7± 2.4
Sodium 0.8± 0.3 0.7± 0.2 0.0± 0.0 0.0± 0.0
Calcium 0.0± 0.0 0.0± 0.0 3.6± 4.1 0.4± 0.2
Table 2: Comparison of elemental distribution for osmium HMDS and no osmium HMDS for 10 abnormal cervical cell samples
Weight % Atomic %
Osmium HMDS No Osmium HMDS
Osmium HMDS
No Osmium HMDS
Carbon 67.4± 4.4 51.0± 6.2 78.3± 1.0 73.9± 7.3
Nitrogen 0.0± 0.0 8.7± 1.2 0.0± 0.0 10.9± 1.2
Oxygen 23.7± 2.4 14.2± 1.5 20.6± 1.1 15.5± 1.6
Sodium 0.0± 0.0 0.7± 0.2 0.0± 0.0 0.5± 0.1
IV. Discussions
Both the osmium HMDS and no osmium HMDS techniques can provide morphological and elemental characteristics of the standard and abnormal cervical cells' performances in terms of qualitative and quantitative results. Although the osmium HMDS technique has produced excellent results of the cervical cells in the morphological and elemental characteristics, the limitations of the osmium HMDS technique, as presented in our previous study [9], could be reduced by no osmium HMDS technique as presented in Section 3.1. Plate artifacts and undetected elements still appeared and occurred in the osmium HMDS technique.
After the proposed protocol had been applied by avoiding osmium tetroxide in the sample preparation technique, possible results were obtained in this chapter. The morphological characteristics of cell deterioration (i.e., different degrees of cell attachment, plate artifacts, membrane cell deterioration, crystals of the cell, and the existence of blackened specimen) were evaluated for the reasonable and abnormal cells images presented in Figures 3 and 4. Both standard and abnormal cervical cells attached to the tissue. Thus the topological structure can be shown clearly. Due to a high degree of cell attachment, plate artifacts did not form [8]. The membrane cell deterioration and crystals of cells were not found in the prepared specimen. The cells have no blackening effect in the prepared specimens. Meanwhile, for the osmium HMDS technique, lower degrees of cell attachment for both techniques were caused by osmium tetroxide. Unattached cells to the tissue were probably produced due to the chemical reaction of osmium with a tissue. Thus, this incident produced plate artifacts from the drying portion of the tissue as a sign of the cell deterioration. The existence of the membrane cell deterioration was detected due to the broken lipid content in the cells. The broken and eroded lipid content from the membrane cell was caused by osmium tetroxide [8]. The crystals of the cells can happen due to the hardening of the cells. The blackened specimens were produced in normal and abnormal cells. As stated previously, the blackening of specimens was avoided in stem cell research [8], [13]. They have avoided using the osmium tetroxide on the specimens. Thus, it can be concluded that the morphological characteristics of cell deterioration were caused by osmium tetroxide. Therefore, the no osmium HMDS technique produced better and effective results to be applied in both normal and abnormal cervical cells protocol in terms of morphological characteristics.
Figure 5: FTIR analysis of normal and abnormal cervical cells spectra to validate the elemental distributions of the FE-SEM/EDX results
As presented in the previous section, the elemental distribution of the cervical cells found in this study consists of C, N, O, Na, and Ca elements at the energy voltage regions of 0 keV to 10 keV. The results showed that the normal and abnormal cells had C, N, O, and Na elements in the no osmium HMDS technique, whereas Ca appeared in the osmium HMDS technique. As stated in other relevant researches, the presence of C, O, and N elements are mainly due to the presence of cholesterol and protein concentrations [16]. The presence of Na and Ca elements in the cervical cell samples are due to glucose in the cytoplasm of cervical cells [17]. The composition of the Na element in the cytoplasm was higher than the content in the nucleus of the cells. The Ca element in the cytoplasm was lower than in the nucleus [17]. Meanwhile, the membrane cell (i.e., on the high side layer of the cytoplasm) broke when the osmium tetroxide was applied to the specimen. Thus, these conditions probably caused the detection of Ca element in the cytoplasm due to the broken membrane layer. Therefore, the existence of calcium in the osmium HMDS technique was probably mediated by osmium tetroxide. Osmium tetroxide is characterized by the blackening of lipid content in the cells with subsequent loss of membrane potential [8]. Thus, the Ca element increased, and N and Na elements decreased and were lost from the cells [17]. Based on Table 3, in the osmium HMDS technique, Ca element in the ordinary and abnormal cells were detected. C, N, O, and Na elements have been detected for no osmium HMDS technique. Therefore, in this study, it is believed that Ca element was formed due to the presence of osmium tetroxide in cervical cells, which caused the loss of membrane potential.
Based on Table 3, by using the no osmium HMDS technique, the carbon content was higher in the abnormal than normal cervical cell samples. Meanwhile, nitrogen, oxygen, and sodium elements were higher in the normal cell samples than abnormal cell samples. As a preliminary investigation, the carbon, nitrogen, oxygen, and sodium elements can be used to characterize the normal and abnormal samples.
Thus, based on these conditions, the no osmium HMDS technique is better than the osmium HMDS technique in terms of elemental characteristics. The possible elements contained in the cervical cells can appear simultaneously using the no osmium HMDS technique. These elements might be used as cervical cell characteristics between normal and abnormal cervical samples. Meanwhile, by applying the osmium HMDS technique, the accuracy of the sample characteristics is doubted due to additional elements formed using osmium tetroxide.
The accuracy of cervical cell elements in the previous elemental distribution analysis by FE-SEM/EDX technique has been supported by the FTIR analysis with the presence of C=O, C=C, C=N and N=O in the protein region at the frequency of 1900-1650 cm-1, 1780-1650 cm-1, 1700-1430 cm-1, respectively as shown in Figure 5. In the glycogen/nucleic acid region at 1200-1000 cm-1, FTIR detected glycogen-rich with strong 1151, 1078, and 1028 cm-1 bands due to coupled C–O and C–C stretching, and C–O–H deformations motions of glycogen in the normal cervical cells. These facts have been proven in previous studies [20], [21]. It means that the detected C, N, and O elements in the cervical cells prepared by applying the no osmium HMDS technique using FE-SEM/EDX are true and similar to FTIR results. Meanwhile, the osmium HMDS technique failed to detect the existence of the N element in the cervical cells. Thus, the no osmium HMDS technique can be claimed as a better sample preparation technique for cervical cells either for normal or abnormal cells. In addition, the total processing time when the no osmium HMDS technique was applied was shorter than the other techniques (3 and 5 hours, respectively), as presented in Figure 1. Therefore, it can be applied for sample preparation techniques for further use in our study.
For the suggestion to researchers for the future study, the proposed sample preparation protocol is expected to be applied to other epithelial cells in the human body and can be used to characterize the normal and abnormal cells. The use of the proposed protocol in a wide scope of human cells can be conducted for further study.
V. Conclusions
The enhancement of imaging results and detection of elemental distribution of normal and abnormal cervical samples under the FE-SEM/EDX application was achieved better by using a proposed than published protocol. The proposed protocol has shown the good quality of morphological characteristics as presented in the FE-SEM images, good capability of detecting elemental distribution in cervical cells, and shorter processing time. Therefore, the proposed
protocol can be determined as an effective technique for the cervical cells FE-SEM/EDX analysis, which is safer, as well as rapid and cost-effective. The effectiveness of the sample preparation technique is important to be applied as a fundamental step in the development of a cervical cancer screening tool.
Conflict of Interest
There is no conflict of interest. Acknowledgment
Thank you for Universitas Muhammadiyah Yogyakarta and Universitas Abdurrab in supporting the research and University of Malaya allowing me to collect the data in the past
References
[1] Rubina S, Amita M, Kedar KD, Bharat R, Krishna CM: Raman spectroscopic study on classification of cervical cell specimens. Vibrational Spectroscopy 2013, 68:115-21.
[2] Congiu T, Schembri L, Tozzi M, Guasti L, Maio RC, Cosentino M, Marino F: Scanning electron microscopy examination of endothelium morphology in human carotid plaques. Micron 2010, 41:532-6. [3] Rekhi B, Patil B, Deodhar KK, Maheshwari A, Kerkar RA, Gupta S, Tongaonkar HB, Shrivastava SK:
Spectrum of neuroendocrine carcinomas of the uterine cervix, including histopathologic features, terminology, immunohistochemical profile, and clinical outcomes in a series of 50 cases from a single institution in India. Ann Diagn Pathol 2013, 17:1-9.
[4] Wang X, Zheng B, Zhang RR, Li S, Chen X, Mulvihill JJ, Lu X, Pang H, Liu H: Automated analysis of Fluorescent in situ Hybridization (FISH) labeled genetic biomarkers in assisting cervical cancer diagnosis. Technology in Cancer Research and Treatment 2010, 9:231-42.
[5] Roach P, Eglin D, Rohde K, Perry CC: Modern biomaterials: a review—bulk properties and implications of surface modifications. Journal of Materials Science: Materials in Medicine 2007, 18:1263-77.
[6] Ali SHR: Advanced nanomeasuring techniques for surface characterization. ISRN Optics 2012, 2012. [7] Béarat HA: Imaging Organic and Biological Materials with Low Voltage Scanning Electron Microscopy.
Application Note, 2012.
[8] Parameswaran S, Verma RS: Scanning electron microscopy preparation protocol for differentiated stem cells. Analytical biochemistry 2011, 416:186-90.
[9] Jusman Y, Ng SC, Abu Osman NA: Investigation of CPD and HMDS sample preparation techniques for cervical cells in developing computer aided screening system based on FE-SEM/EDX. Sci World J 2014.
[10] Joy DC, Joy CS: Low voltage scanning electron microscopy. Micron 1996, 27:247-63.
[11] Frank L, Hovorka M, Konvalina I, Mikmeková Š, Müllerová I: Very low energy scanning electron microscopy. Nuclear Instruments and Methods in Physics Research Section A: Accelerators, Spectrometers, Detectors and Associated Equipment 2011, 645:46-54.
[12] Doughty MJ, Bergmanson JPG, Blocker Y: Impact of glutaraldehyde versus glutaraldehyde-formaldehyde fixative on cell organization in fish corneal epithelium. Tissue and Cell 1995, 27:701-12. [13] Voigt T, Dauber W: The transillumination possibility of imidazole-osmium postfixed tissue and its
consequences for the handling of tissue samples. Microscopy and microanalysis 2005, 11:42-5.
[14] Elftman H: Effects of fixation in lipoid histochemistry. Journal of Histochemistry & Cytochemistry 1958, 6:317-21.
[15] Johansson BL, Larsson A, Ocklind A, Öhrlund Å: Characterization of air plasma‐treated polymer surfaces by ESCA and contact angle measurements for optimization of surface stability and cell growth. Journal of applied polymer science 2002, 86:2618-25.
[16] Chang HH, Cheng CL, Huang PJ, Lin SY: Application of scanning electron microscopy and X-ray microanalysis: FE-SEM, ESEM-EDS, and EDS mapping for studying the characteristics of topographical microstructure and elemental mapping of human cardiac calcified deposition. Analytical and bioanalytical chemistry 2014, 406:359-66.
[17] Taylor CP, Weber ML, Gaughan CL, Lehning EJ, LoPachin RM: Oxygen/glucose deprivation in hippocampal slices: altered intraneuronal elemental composition predicts structural and functional damage. The Journal of neuroscience 1999, 19:619-29.
[18] El-Tawil SG, Adnan R, Muhamed ZN, Othman NH: Comparative study between Pap smear cytology and FTIR spectroscopy: A new tool for screening for cervical cancer. Pathology 2008, 40:600-3.
[19] Jusman Y, Sulaiman SN, Isa NAM, Yusoff IA, Othman NH, Adnan R, Zaki A: Capability of New Features from FTIR Spectral of Cervical Cells for Cervical Precancerous Diagnostic System Using MLP Networks. Proc Tencon 2009 2009, 1-4:1574-9.
[20] Wood BR, Chiriboga L, Yee H, Quinn MA, McNaughton D, Diem M: Fourier transform infrared (FTIR) spectral mapping of the cervical transformation zone, and dysplastic squamous epithelium. Gynecologic Oncology 2004, 93:59-68.
[21] Chilakapati M, Sockalingum G, Vidyasagar M, Manfait M, Fernanades D, Vadhiraja B, Maheedhar K: An overview on applications of optical spectroscopy in cervical cancers. Journal of Cancer Research and Therapeutics 2008, 4:26-36.