ISSN-L: 2501 - 1235 Available on-line at: www.oapub.org/edu
Copyright © The Author(s). All Rights Reserved.
doi: 10.5281/zenodo.3401705 Volume 5 │ Issue 11 │ 2019
REASONS AND EXPECTATIONS OF 15-24 YEARS OLD
INDIVIDUALS WITH VISUAL DISABILITY STARTING SPORTS
İbrahim Dalbudaki Dr., Isparta University of Applied Science,
Atabey Vocational School Turkey
Abstract:
This study was conducted on a total of 139 visually impaired athletes with different visual acuity, 15-18 aged, to define their reasons for starting sports and expectations from sports. The principle of voluntariness was taken into consideration. According to the participants’ gender, disability status, branches of sports, marital status, age groups, education levels, level of income, and visual acuity, the analysis on the reasons and expectations of individuals with visual disability starting sports between the ages of 15-18 were analyzed. “The Scale of Reasons for Starting Sports and Expectations from Sports” was used as a data collection tool in the study. In this study in which analysis on reasons of starting sports and expectations from sports were done; SPSS 22.00 program, used in quantitative study, was used in this study, the data are summarized by giving percentage and frequency tables. In this study, Cronbach Alpha reliability coefficient of the scale was found to be 0.857. In conclusion, in this study, the reasons for starting sports and expectations from sports of 15-18 aged individuals with a visual disability were analyzed. In this sense, this study is important in terms of examining the effects of sports on disabled people and attracting attention to other individuals with disabilities. In addition, it is recommended that a new study should be carried out to evaluate the reasons for determining the reasons for starting sports and expectations from sports of other individuals with disabilities.
Keywords: 15-18 aged individuals with visual disability, athlete, reasons for starting sports, expectations from sports
1. Introduction
As long as people live together with different characteristics, there will be roles that people have to undertake, depending on many factors in society. It is called a disability to an individual's inability to fulfill these roles due to his or her status. People who are
negatively different from their peers and who draw the attention of the environment due to these deficiencies are called people with disabilities. People with disabilities form 10% of the world population (Özer, 2001). This corresponds to an average of 500 million people (Barnes, 1998). In today’s world, this rate is approximately 15% (WHO, 2016). In his studies, Hargreaves (2000) reported this ratio as around 14% in Turkey. There are more than 161 million people with visual disability in the world. Among these individuals, 124 million have low visual acuity and 34 million are blind (WHO, 2013). According to the Turkey Disability Survey (Turkey Disability Survey, 2002), "individuals with visual handicap" constitute 0,60's% of the population. Although there are many definitions and classifications related to individuals with a visual disability, the rate of loss in vision is used as a base. According to the accepted definition in both international and national literature; after all possible corrections, if the person's visual acuity is lower than 20/200, or even less than 20 (, despite the field of vision corrective lenses, they are called individuals with visual disability (Özida, 1999; Turnbull et al., 2004; Özyürek, 1995).
group of competing adults (Yiğit et al., 2017). IBSA has identified three classes in an international competition for individuals with partially visual disability or blind athletes (IBSA, 2006). Each class applies sports that can be done by the individuals with visual disability. These are;
B1. They do not see completely, they can perceive the light but they cannot recognize the shape of the hand from any distance.
B2. Although they can perceive hand, visual acuity is less than 20/600 and visual acuity is below 50 in visual environment.
B3. Visual angles are 5-200. They have visual acuity power of 20/600, 60/600 (IBSA, 2006).
Sports is the easiest way for people with disabilities to communicate with the society physically, psychologically and socially (Akdenk et al., 1997). Participating in sportive activities, acting, exercising regardless of the disability status increases the desire of people with disabilities to live. Through sports, people with disabilities can solve their loneliness, share their problems with others, learn to share friendship, learn to make common decisions, get discipline, socialize, learn to dominate, discover and develop their abilities, have positive feelings towards themselves, love life, accept success and failure to ensure that the individual continues to live (Dalbudak, 2012). Considering the concepts of human rights and equality of opportunity in the context of democracy, it is the most natural rights of individuals with disability to benefit from sports training like other normal individuals and equal opportunities should be created in this field (Atay, 1995).
The aim of this study is to determine the reasons athletes with visual disability between the ages of 15-18 for starting sports and the expectations from the sports. With this study, it was determined the reasons for visually impaired people and their expectations for sports. It is very important for the development and spread of sport and the fact that people with visual disability have independent movement and that their independence in daily life activities is due to sport.
2. Material Method
2.1. Study Group
The study group consisted of 81 male and 58 female, a total of 139 individuals with different visual acuity who are between 15-18 ages. The principle of voluntariness was taken into consideration in participation.
2.2. Collection of the Data
In the second part; to determine the reasons for individuals with visual disability to start doing sports and their expectations from sport, “The Reasons of Athletes Tending to Branch of Athletics and Expectations (Şimşek, 2005).”, “Turkish Athletes’ Expectations from Sports and the Reasons Prompting them to Sports (Sunay & Saracaloğlu, 2003).’’, and “The Factors that Effect Elite Female and Male Volleyball Players to Start Doing Sports in Turkey (Bayraktar &Sunay, 2004) were used. The Scale of Reasons for Starting Sports and Expectations from Sports (SRSSE) is a 5-item Likert scale. In the scale, for each item; the participants are asked to mark one of the options of 1-“None”, “2-“Low”, 3-“Moderate”, 4-“High”, 5-“Too high”. The score given for each item is taken as a basis.
2.3. Analysis of the Data
Each of the items in the scale is independent. Therefore, the average or total score of the scores given to the scale items was not taken. Instead, the average and standard deviations of each item in itself were used. Besides this, T-test, ANOVA tests, and frequency tests were used. The obtained data was analyzed in SPSS 20.0 packaged program. The Cronbach’s Alpha reliability coefficiency of the scale was found as 0,857.
3. Findings
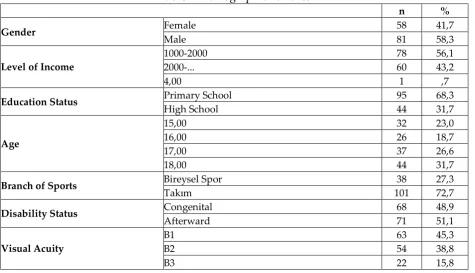
When the participants were examined in terms of demographic characteristics, the following findings were reached.
Table 1: Demographic Features
n %
Gender Female 58 41,7
Male 81 58,3
Level of Income
1000-2000 78 56,1
2000-... 60 43,2
4,00 1 ,7
Education Status Primary School 95 68,3
High School 44 31,7
Age
15,00 32 23,0
16,00 26 18,7
17,00 37 26,6
18,00 44 31,7
Branch of Sports Bireysel Spor 38 27,3
Takım 101 72,7
Disability Status Congenital 68 48,9
Afterward 71 51,1
Visual Acuity
B1 63 45,3
B2 54 38,8
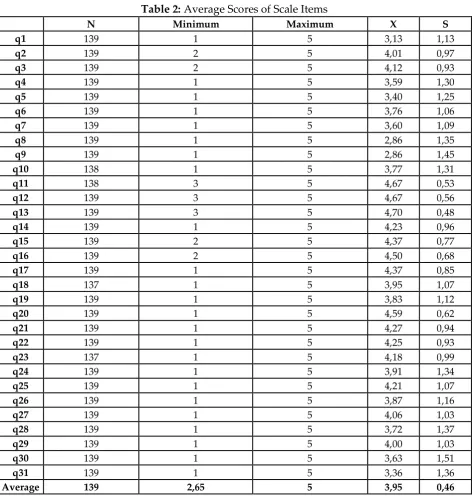
Table 2: Average Scores of Scale Items
N Minimum Maximum X S
q1 139 1 5 3,13 1,13
q2 139 2 5 4,01 0,97
q3 139 2 5 4,12 0,93
q4 139 1 5 3,59 1,30
q5 139 1 5 3,40 1,25
q6 139 1 5 3,76 1,06
q7 139 1 5 3,60 1,09
q8 139 1 5 2,86 1,35
q9 139 1 5 2,86 1,45
q10 138 1 5 3,77 1,31
q11 138 3 5 4,67 0,53
q12 139 3 5 4,67 0,56
q13 139 3 5 4,70 0,48
q14 139 1 5 4,23 0,96
q15 139 2 5 4,37 0,77
q16 139 2 5 4,50 0,68
q17 139 1 5 4,37 0,85
q18 137 1 5 3,95 1,07
q19 139 1 5 3,83 1,12
q20 139 1 5 4,59 0,62
q21 139 1 5 4,27 0,94
q22 139 1 5 4,25 0,93
q23 137 1 5 4,18 0,99
q24 139 1 5 3,91 1,34
q25 139 1 5 4,21 1,07
q26 139 1 5 3,87 1,16
q27 139 1 5 4,06 1,03
q28 139 1 5 3,72 1,37
q29 139 1 5 4,00 1,03
q30 139 1 5 3,63 1,51
q31 139 1 5 3,36 1,36
Average 139 2,65 5 3,95 0,46
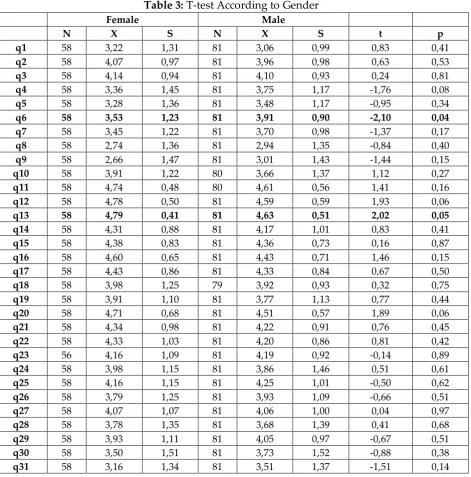
Table 3: T-test According to Gender
Female Male
N X S N X S t p
q1 58 3,22 1,31 81 3,06 0,99 0,83 0,41
q2 58 4,07 0,97 81 3,96 0,98 0,63 0,53
q3 58 4,14 0,94 81 4,10 0,93 0,24 0,81
q4 58 3,36 1,45 81 3,75 1,17 -1,76 0,08
q5 58 3,28 1,36 81 3,48 1,17 -0,95 0,34
q6 58 3,53 1,23 81 3,91 0,90 -2,10 0,04
q7 58 3,45 1,22 81 3,70 0,98 -1,37 0,17
q8 58 2,74 1,36 81 2,94 1,35 -0,84 0,40
q9 58 2,66 1,47 81 3,01 1,43 -1,44 0,15
q10 58 3,91 1,22 80 3,66 1,37 1,12 0,27
q11 58 4,74 0,48 80 4,61 0,56 1,41 0,16
q12 58 4,78 0,50 81 4,59 0,59 1,93 0,06
q13 58 4,79 0,41 81 4,63 0,51 2,02 0,05
q14 58 4,31 0,88 81 4,17 1,01 0,83 0,41
q15 58 4,38 0,83 81 4,36 0,73 0,16 0,87
q16 58 4,60 0,65 81 4,43 0,71 1,46 0,15
q17 58 4,43 0,86 81 4,33 0,84 0,67 0,50
q18 58 3,98 1,25 79 3,92 0,93 0,32 0,75
q19 58 3,91 1,10 81 3,77 1,13 0,77 0,44
q20 58 4,71 0,68 81 4,51 0,57 1,89 0,06
q21 58 4,34 0,98 81 4,22 0,91 0,76 0,45
q22 58 4,33 1,03 81 4,20 0,86 0,81 0,42
q23 56 4,16 1,09 81 4,19 0,92 -0,14 0,89
q24 58 3,98 1,15 81 3,86 1,46 0,51 0,61
q25 58 4,16 1,15 81 4,25 1,01 -0,50 0,62
q26 58 3,79 1,25 81 3,93 1,09 -0,66 0,51
q27 58 4,07 1,07 81 4,06 1,00 0,04 0,97
q28 58 3,78 1,35 81 3,68 1,39 0,41 0,68
q29 58 3,93 1,11 81 4,05 0,97 -0,67 0,51
q30 58 3,50 1,51 81 3,73 1,52 -0,88 0,38
q31 58 3,16 1,34 81 3,51 1,37 -1,51 0,14
As a result of the T test according to gender, a significant difference was found in q6 (t = -2,100, p <0,05) and q13 (t = 2,017, p <0,05) items. In S6, the score is higher in men; and in q13, the score is higher in women.
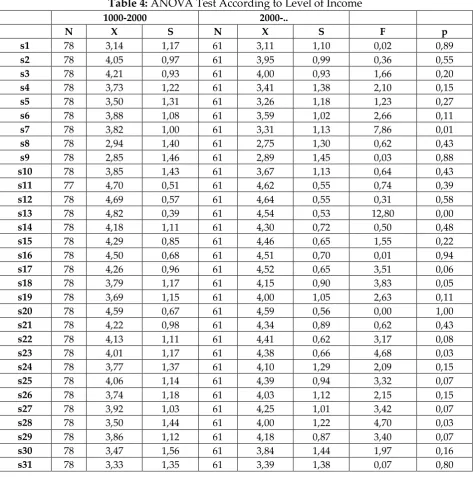
Table 4: ANOVA Test According to Level of Income 1000-2000 2000-..
N X S N X S F p
s1 78 3,14 1,17 61 3,11 1,10 0,02 0,89
s2 78 4,05 0,97 61 3,95 0,99 0,36 0,55
s3 78 4,21 0,93 61 4,00 0,93 1,66 0,20
s4 78 3,73 1,22 61 3,41 1,38 2,10 0,15
s5 78 3,50 1,31 61 3,26 1,18 1,23 0,27
s6 78 3,88 1,08 61 3,59 1,02 2,66 0,11
s7 78 3,82 1,00 61 3,31 1,13 7,86 0,01
s8 78 2,94 1,40 61 2,75 1,30 0,62 0,43
s9 78 2,85 1,46 61 2,89 1,45 0,03 0,88
s10 78 3,85 1,43 61 3,67 1,13 0,64 0,43
s11 77 4,70 0,51 61 4,62 0,55 0,74 0,39
s12 78 4,69 0,57 61 4,64 0,55 0,31 0,58
s13 78 4,82 0,39 61 4,54 0,53 12,80 0,00
s14 78 4,18 1,11 61 4,30 0,72 0,50 0,48
s15 78 4,29 0,85 61 4,46 0,65 1,55 0,22
s16 78 4,50 0,68 61 4,51 0,70 0,01 0,94
s17 78 4,26 0,96 61 4,52 0,65 3,51 0,06
s18 78 3,79 1,17 61 4,15 0,90 3,83 0,05
s19 78 3,69 1,15 61 4,00 1,05 2,63 0,11
s20 78 4,59 0,67 61 4,59 0,56 0,00 1,00
s21 78 4,22 0,98 61 4,34 0,89 0,62 0,43
s22 78 4,13 1,11 61 4,41 0,62 3,17 0,08
s23 78 4,01 1,17 61 4,38 0,66 4,68 0,03
s24 78 3,77 1,37 61 4,10 1,29 2,09 0,15
s25 78 4,06 1,14 61 4,39 0,94 3,32 0,07
s26 78 3,74 1,18 61 4,03 1,12 2,15 0,15
s27 78 3,92 1,03 61 4,25 1,01 3,42 0,07
s28 78 3,50 1,44 61 4,00 1,22 4,70 0,03
s29 78 3,86 1,12 61 4,18 0,87 3,40 0,07
s30 78 3,47 1,56 61 3,84 1,44 1,97 0,16
s31 78 3,33 1,35 61 3,39 1,38 0,07 0,80
When the ANOVA test results were analyzed according to level of income, it was found that there was a significant difference according to level of income in q7 (F= 7,862, p<0,05), q13(F= 12,797, p<0,05), and q28 (F= 4,699, p<0,05). It was stated that the individuals who have 1000-2000 level of income have been found higher in q7 and q13, the ones with 2000- level of income have been found higher in q28.
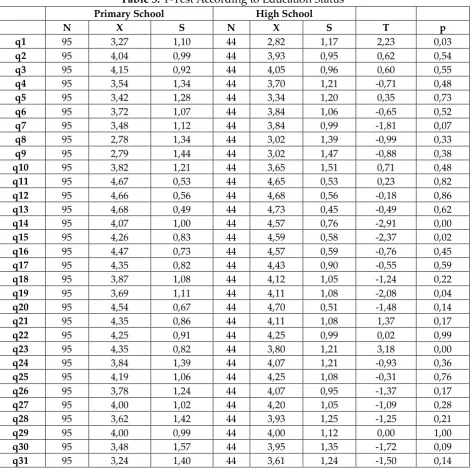
Table 5: T-Test According to Education Status Primary School High School
N X S N X S T p
q1 95 3,27 1,10 44 2,82 1,17 2,23 0,03
q2 95 4,04 0,99 44 3,93 0,95 0,62 0,54
q3 95 4,15 0,92 44 4,05 0,96 0,60 0,55
q4 95 3,54 1,34 44 3,70 1,21 -0,71 0,48
q5 95 3,42 1,28 44 3,34 1,20 0,35 0,73
q6 95 3,72 1,07 44 3,84 1,06 -0,65 0,52
q7 95 3,48 1,12 44 3,84 0,99 -1,81 0,07
q8 95 2,78 1,34 44 3,02 1,39 -0,99 0,33
q9 95 2,79 1,44 44 3,02 1,47 -0,88 0,38
q10 95 3,82 1,21 44 3,65 1,51 0,71 0,48
q11 95 4,67 0,53 44 4,65 0,53 0,23 0,82
q12 95 4,66 0,56 44 4,68 0,56 -0,18 0,86
q13 95 4,68 0,49 44 4,73 0,45 -0,49 0,62
q14 95 4,07 1,00 44 4,57 0,76 -2,91 0,00
q15 95 4,26 0,83 44 4,59 0,58 -2,37 0,02
q16 95 4,47 0,73 44 4,57 0,59 -0,76 0,45
q17 95 4,35 0,82 44 4,43 0,90 -0,55 0,59
q18 95 3,87 1,08 44 4,12 1,05 -1,24 0,22
q19 95 3,69 1,11 44 4,11 1,08 -2,08 0,04
q20 95 4,54 0,67 44 4,70 0,51 -1,48 0,14
q21 95 4,35 0,86 44 4,11 1,08 1,37 0,17
q22 95 4,25 0,91 44 4,25 0,99 0,02 0,99
q23 95 4,35 0,82 44 3,80 1,21 3,18 0,00
q24 95 3,84 1,39 44 4,07 1,21 -0,93 0,36
q25 95 4,19 1,06 44 4,25 1,08 -0,31 0,76
q26 95 3,78 1,24 44 4,07 0,95 -1,37 0,17
q27 95 4,00 1,02 44 4,20 1,05 -1,09 0,28
q28 95 3,62 1,42 44 3,93 1,25 -1,25 0,21
q29 95 4,00 0,99 44 4,00 1,12 0,00 1,00
q30 95 3,48 1,57 44 3,95 1,35 -1,72 0,09
q31 95 3,24 1,40 44 3,61 1,24 -1,50 0,14
When the T-test results were analyzed according to Education Status, it was found that there was a significant difference in q1 (t=-2,233, p<0,05), q14(t=-2,906, p<0,05), q15(t=-2,366, p<0,05), q19(t=-2,083, p<0,05), and q23(t=3,184, p<0,05). While the primary school students’ scores are higher in Q1 and Q23; in the other questions, high school students’ scores have been found higher.
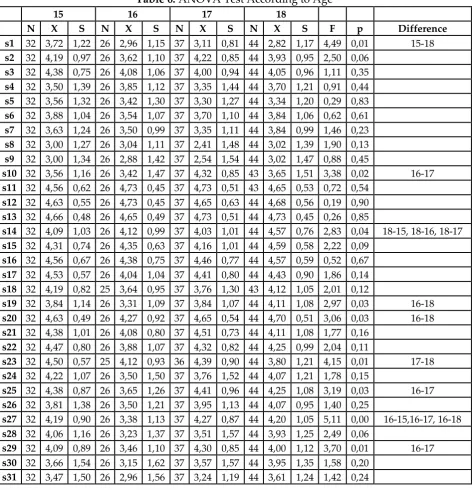
Table 6: ANOVA Test According to Age
15 16 17 18
N X S N X S N X S N X S F p Difference s1 32 3,72 1,22 26 2,96 1,15 37 3,11 0,81 44 2,82 1,17 4,49 0,01 15-18
s2 32 4,19 0,97 26 3,62 1,10 37 4,22 0,85 44 3,93 0,95 2,50 0,06
s3 32 4,38 0,75 26 4,08 1,06 37 4,00 0,94 44 4,05 0,96 1,11 0,35
s4 32 3,50 1,39 26 3,85 1,12 37 3,35 1,44 44 3,70 1,21 0,91 0,44
s5 32 3,56 1,32 26 3,42 1,30 37 3,30 1,27 44 3,34 1,20 0,29 0,83
s6 32 3,88 1,04 26 3,54 1,07 37 3,70 1,10 44 3,84 1,06 0,62 0,61
s7 32 3,63 1,24 26 3,50 0,99 37 3,35 1,11 44 3,84 0,99 1,46 0,23
s8 32 3,00 1,27 26 3,04 1,11 37 2,41 1,48 44 3,02 1,39 1,90 0,13
s9 32 3,00 1,34 26 2,88 1,42 37 2,54 1,54 44 3,02 1,47 0,88 0,45
s10 32 3,56 1,16 26 3,42 1,47 37 4,32 0,85 43 3,65 1,51 3,38 0,02 16-17
s11 32 4,56 0,62 26 4,73 0,45 37 4,73 0,51 43 4,65 0,53 0,72 0,54
s12 32 4,63 0,55 26 4,73 0,45 37 4,65 0,63 44 4,68 0,56 0,19 0,90
s13 32 4,66 0,48 26 4,65 0,49 37 4,73 0,51 44 4,73 0,45 0,26 0,85
s14 32 4,09 1,03 26 4,12 0,99 37 4,03 1,01 44 4,57 0,76 2,83 0,04 18-15, 18-16, 18-17
s15 32 4,31 0,74 26 4,35 0,63 37 4,16 1,01 44 4,59 0,58 2,22 0,09
s16 32 4,56 0,67 26 4,38 0,75 37 4,46 0,77 44 4,57 0,59 0,52 0,67
s17 32 4,53 0,57 26 4,04 1,04 37 4,41 0,80 44 4,43 0,90 1,86 0,14
s18 32 4,19 0,82 25 3,64 0,95 37 3,76 1,30 43 4,12 1,05 2,01 0,12
s19 32 3,84 1,14 26 3,31 1,09 37 3,84 1,07 44 4,11 1,08 2,97 0,03 16-18
s20 32 4,63 0,49 26 4,27 0,92 37 4,65 0,54 44 4,70 0,51 3,06 0,03 16-18
s21 32 4,38 1,01 26 4,08 0,80 37 4,51 0,73 44 4,11 1,08 1,77 0,16
s22 32 4,47 0,80 26 3,88 1,07 37 4,32 0,82 44 4,25 0,99 2,04 0,11
s23 32 4,50 0,57 25 4,12 0,93 36 4,39 0,90 44 3,80 1,21 4,15 0,01 17-18
s24 32 4,22 1,07 26 3,50 1,50 37 3,76 1,52 44 4,07 1,21 1,78 0,15
s25 32 4,38 0,87 26 3,65 1,26 37 4,41 0,96 44 4,25 1,08 3,19 0,03 16-17
s26 32 3,81 1,38 26 3,50 1,21 37 3,95 1,13 44 4,07 0,95 1,40 0,25
s27 32 4,19 0,90 26 3,38 1,13 37 4,27 0,87 44 4,20 1,05 5,11 0,00 16-15,16-17, 16-18
s28 32 4,06 1,16 26 3,23 1,37 37 3,51 1,57 44 3,93 1,25 2,49 0,06
s29 32 4,09 0,89 26 3,46 1,10 37 4,30 0,85 44 4,00 1,12 3,70 0,01 16-17
s30 32 3,66 1,54 26 3,15 1,62 37 3,57 1,57 44 3,95 1,35 1,58 0,20
s31 32 3,47 1,50 26 2,96 1,56 37 3,24 1,19 44 3,61 1,24 1,42 0,24
When the ANOVA test results were analyzed according to age, it was found that there was a significant difference in q1 (F=4,49, p<0,05), q10 (F=3,38, p<0,05), q14 (F=2,83, p<0,05), q19 (F=2,97, p<0,05), q20 (F=3,06, p<0,05), q23 (F=4,15, p<0,05), q25 (F=3,19, p<0,05), q27 (F=5,11, p<0,05) ve q29 (F= 3,70, p<0,05). In the result of the PostHoc Tests which were done to determine in which groups the differentiation occurred, it was found that there was a significant difference in q1 15-18, q10 16-17, q14 15, 16, 18-17, q19 16-18, q20 16-18, q23 17-18, q25 16-18-17, q27 16-15,16-18-17, 16-18, and in q29 between 16-17 ages.
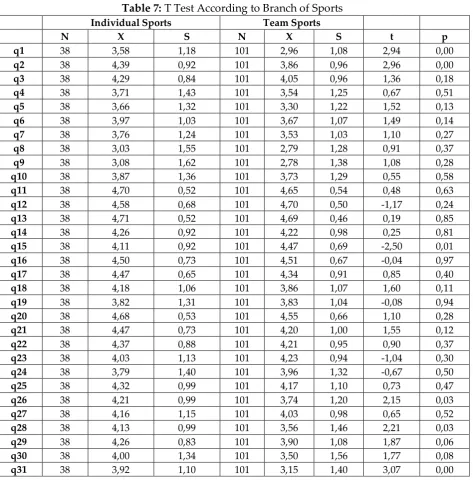
Table 7: T Test According to Branch of Sports Individual Sports Team Sports
N X S N X S t p
q1 38 3,58 1,18 101 2,96 1,08 2,94 0,00
q2 38 4,39 0,92 101 3,86 0,96 2,96 0,00
q3 38 4,29 0,84 101 4,05 0,96 1,36 0,18
q4 38 3,71 1,43 101 3,54 1,25 0,67 0,51
q5 38 3,66 1,32 101 3,30 1,22 1,52 0,13
q6 38 3,97 1,03 101 3,67 1,07 1,49 0,14
q7 38 3,76 1,24 101 3,53 1,03 1,10 0,27
q8 38 3,03 1,55 101 2,79 1,28 0,91 0,37
q9 38 3,08 1,62 101 2,78 1,38 1,08 0,28
q10 38 3,87 1,36 101 3,73 1,29 0,55 0,58
q11 38 4,70 0,52 101 4,65 0,54 0,48 0,63
q12 38 4,58 0,68 101 4,70 0,50 -1,17 0,24
q13 38 4,71 0,52 101 4,69 0,46 0,19 0,85
q14 38 4,26 0,92 101 4,22 0,98 0,25 0,81
q15 38 4,11 0,92 101 4,47 0,69 -2,50 0,01
q16 38 4,50 0,73 101 4,51 0,67 -0,04 0,97
q17 38 4,47 0,65 101 4,34 0,91 0,85 0,40
q18 38 4,18 1,06 101 3,86 1,07 1,60 0,11
q19 38 3,82 1,31 101 3,83 1,04 -0,08 0,94
q20 38 4,68 0,53 101 4,55 0,66 1,10 0,28
q21 38 4,47 0,73 101 4,20 1,00 1,55 0,12
q22 38 4,37 0,88 101 4,21 0,95 0,90 0,37
q23 38 4,03 1,13 101 4,23 0,94 -1,04 0,30
q24 38 3,79 1,40 101 3,96 1,32 -0,67 0,50
q25 38 4,32 0,99 101 4,17 1,10 0,73 0,47
q26 38 4,21 0,99 101 3,74 1,20 2,15 0,03
q27 38 4,16 1,15 101 4,03 0,98 0,65 0,52
q28 38 4,13 0,99 101 3,56 1,46 2,21 0,03
q29 38 4,26 0,83 101 3,90 1,08 1,87 0,06
q30 38 4,00 1,34 101 3,50 1,56 1,77 0,08
q31 38 3,92 1,10 101 3,15 1,40 3,07 0,00
When T-test results were analyzed according to branches of sports, it was found that there was a significant difference in q1 (t=2,94, p<0,05), q2 (t=2,96 p<0,05), q15 (t=-2,50 p<0,05), q26 (t=2,15 p<0,05), q28 (t=2,21 p<0,05), and q31(t=3,07 p<0,05). In q15, it was found that while the scores of team sports doers were higher, in the other items, individual sports doers had higher scores.
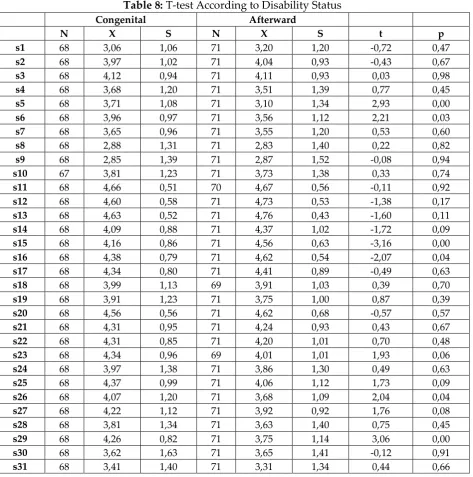
Table 8: T-test According to Disability Status Congenital Afterward
N X S N X S t p
s1 68 3,06 1,06 71 3,20 1,20 -0,72 0,47
s2 68 3,97 1,02 71 4,04 0,93 -0,43 0,67
s3 68 4,12 0,94 71 4,11 0,93 0,03 0,98
s4 68 3,68 1,20 71 3,51 1,39 0,77 0,45
s5 68 3,71 1,08 71 3,10 1,34 2,93 0,00
s6 68 3,96 0,97 71 3,56 1,12 2,21 0,03
s7 68 3,65 0,96 71 3,55 1,20 0,53 0,60
s8 68 2,88 1,31 71 2,83 1,40 0,22 0,82
s9 68 2,85 1,39 71 2,87 1,52 -0,08 0,94
s10 67 3,81 1,23 71 3,73 1,38 0,33 0,74
s11 68 4,66 0,51 70 4,67 0,56 -0,11 0,92
s12 68 4,60 0,58 71 4,73 0,53 -1,38 0,17
s13 68 4,63 0,52 71 4,76 0,43 -1,60 0,11
s14 68 4,09 0,88 71 4,37 1,02 -1,72 0,09
s15 68 4,16 0,86 71 4,56 0,63 -3,16 0,00
s16 68 4,38 0,79 71 4,62 0,54 -2,07 0,04
s17 68 4,34 0,80 71 4,41 0,89 -0,49 0,63
s18 68 3,99 1,13 69 3,91 1,03 0,39 0,70
s19 68 3,91 1,23 71 3,75 1,00 0,87 0,39
s20 68 4,56 0,56 71 4,62 0,68 -0,57 0,57
s21 68 4,31 0,95 71 4,24 0,93 0,43 0,67
s22 68 4,31 0,85 71 4,20 1,01 0,70 0,48
s23 68 4,34 0,96 69 4,01 1,01 1,93 0,06
s24 68 3,97 1,38 71 3,86 1,30 0,49 0,63
s25 68 4,37 0,99 71 4,06 1,12 1,73 0,09
s26 68 4,07 1,20 71 3,68 1,09 2,04 0,04
s27 68 4,22 1,12 71 3,92 0,92 1,76 0,08
s28 68 3,81 1,34 71 3,63 1,40 0,75 0,45
s29 68 4,26 0,82 71 3,75 1,14 3,06 0,00
s30 68 3,62 1,63 71 3,65 1,41 -0,12 0,91
s31 68 3,41 1,40 71 3,31 1,34 0,44 0,66
When T-test results were analyzed according to Disability Status, it was found that there was a significant difference in q5 (t=2,93, p<0,05), q6 (t=2,21, p<0,05), q15 (t=-3,16, p<0,05), q16 (t=-2,07, p<0,05), q26 (t=2,04, p<0,05), and q29 (t=3,06, p<0,05). While individuals with congenital disability had higher scores in Q5, q6, q26, and q29; individuals with afterward disability had higher scores in q15 and q16.
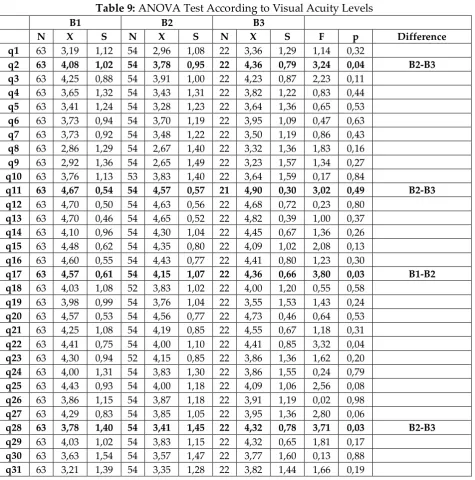
Table 9: ANOVA Test According to Visual Acuity Levels
B1 B2 B3
N X S N X S N X S F p Difference q1 63 3,19 1,12 54 2,96 1,08 22 3,36 1,29 1,14 0,32
q2 63 4,08 1,02 54 3,78 0,95 22 4,36 0,79 3,24 0,04 B2-B3 q3 63 4,25 0,88 54 3,91 1,00 22 4,23 0,87 2,23 0,11
q4 63 3,65 1,32 54 3,43 1,31 22 3,82 1,22 0,83 0,44
q5 63 3,41 1,24 54 3,28 1,23 22 3,64 1,36 0,65 0,53
q6 63 3,73 0,94 54 3,70 1,19 22 3,95 1,09 0,47 0,63
q7 63 3,73 0,92 54 3,48 1,22 22 3,50 1,19 0,86 0,43
q8 63 2,86 1,29 54 2,67 1,40 22 3,32 1,36 1,83 0,16
q9 63 2,92 1,36 54 2,65 1,49 22 3,23 1,57 1,34 0,27
q10 63 3,76 1,13 53 3,83 1,40 22 3,64 1,59 0,17 0,84
q11 63 4,67 0,54 54 4,57 0,57 21 4,90 0,30 3,02 0,49 B2-B3 q12 63 4,70 0,50 54 4,63 0,56 22 4,68 0,72 0,23 0,80
q13 63 4,70 0,46 54 4,65 0,52 22 4,82 0,39 1,00 0,37
q14 63 4,10 0,96 54 4,30 1,04 22 4,45 0,67 1,36 0,26
q15 63 4,48 0,62 54 4,35 0,80 22 4,09 1,02 2,08 0,13
q16 63 4,60 0,55 54 4,43 0,77 22 4,41 0,80 1,23 0,30
q17 63 4,57 0,61 54 4,15 1,07 22 4,36 0,66 3,80 0,03 B1-B2 q18 63 4,03 1,08 52 3,83 1,02 22 4,00 1,20 0,55 0,58
q19 63 3,98 0,99 54 3,76 1,04 22 3,55 1,53 1,43 0,24
q20 63 4,57 0,53 54 4,56 0,77 22 4,73 0,46 0,64 0,53
q21 63 4,25 1,08 54 4,19 0,85 22 4,55 0,67 1,18 0,31
q22 63 4,41 0,75 54 4,00 1,10 22 4,41 0,85 3,32 0,04
q23 63 4,30 0,94 52 4,15 0,85 22 3,86 1,36 1,62 0,20
q24 63 4,00 1,31 54 3,83 1,30 22 3,86 1,55 0,24 0,79
q25 63 4,43 0,93 54 4,00 1,18 22 4,09 1,06 2,56 0,08
q26 63 3,86 1,15 54 3,87 1,18 22 3,91 1,19 0,02 0,98
q27 63 4,29 0,83 54 3,85 1,05 22 3,95 1,36 2,80 0,06
q28 63 3,78 1,40 54 3,41 1,45 22 4,32 0,78 3,71 0,03 B2-B3 q29 63 4,03 1,02 54 3,83 1,15 22 4,32 0,65 1,81 0,17
q30 63 3,63 1,54 54 3,57 1,47 22 3,77 1,60 0,13 0,88
q31 63 3,21 1,39 54 3,35 1,28 22 3,82 1,44 1,66 0,19
When ANOVA test results were analyzed according to visual acuity levels, it was found that there was a significant difference in items of q2 (F=3,24, p<0,05), q11 (F=3,02, p<0,05), q17 (F=3,80, p<0,05), and q28 (F=3,71, p<0,05). In the result of the PostHoc Tests which were done to determine in which groups the differentiation occurred, it was found that there was a significant difference in Q2, Q11, and Q28 between B2-B3; in Q17 between B1-B2.
4. Discussion and Result
education. 38 of them are individual, 101 are in the team sports branch. 32 of the participants are 15, 26 are 16, 37 are 17, and 44 of them are 18 years old. 68 of them have congenital, and 71 of them have afterward visual disability. 63 of them have B1, 54 individuals have B2, and 22 of them have B3 visual acuity.
In T-test results of the scale T test according to gender, a significant difference was found in q6 (t = -2,100, p <0,05) and q13 (t = 2,017, p <0,05). In the 6th item of the scale item, it was found that the effect of friends and peers on the onset of sports is higher in women than that of males, and in the 13th question, women’s being healthy scores are higher than males. This study does not show similarity with the results of the studies conducted by Bayraktar and Sunay (2007), and Şimşek and Gökdemir (2006). No significant difference was found between the other items of the scale. Thus, it can be understood that reasons of starting sports and expectations are different. Also, as, we think that its different from the conducted studies have resulted from the fact that individuals with a visual disability have different expectations and their disabilities.
When ANOVA test results were analyzed according to the level of income, it was found that there was a significant difference in q7 (F= 7,862, p<0,05), q13(F= 12,797, p<0,05), and q28 (F= 4,699, p<0,05). In q7 and q13, individuals with 1000-2000 income level have been found higher, and in s28, individuals with 2000- income level have been found higher. The effect of an immediate vicinity coach in starting sports, item 7 in the scale, have been found higher in individuals with 1000-2000 level of income; being healthy through doing sports, item 13 in the scale, have been found higher in 1000-2000 level of income. Being a coach, in item 28 in the scale, have been found higher in 2000 and above income level. No significant difference was found in the other items of the scale. It is seen that the expectations of the individuals with disability in different level of income have changed. When the level of income of the individuals with visual disability changes, it is seen that their reasons for starting sports and their expectations have changed.
When ANOVA Test results were analyzed according to age, it was found that there was a significant difference in q1 (F=4,49, p<0,05), q10 (F=3,38, p<0,05), q14 (F=2,83, p<0,05), q19 (F=2,97, p<0,05), q20 (F=3,06, p<0,05), q23 (F=4,15, p<0,05), q25 (F=3,19, p<0,05), q27 (F=5,11, p<0,05), and q29 (F=3,70, p<0,05). As a result of Post-Hoc tests to determine in which of these groups the differentiation occurred; it was stated that there was a significant difference between 15-18 ages in q1, 16-17 in q10, 18-15, 16-18, 18-17 in q14, 16-18 in q19, 16-18 in q20, 17-18 in q23, 16-17 in q25, 16-15, 16-17, 16-18 in q27, and between 16-17 ages in q29.
A significant difference was found according to age groups in the 1st item of the scale- mother, father, and siblings’ effect on tending to sports, 10th item-physical education and sports teachers’ effect on starting sports, 14th item- finding true happiness in sports, 19th item- extending income level, 20th item- being healthy and protecting health, 23th item- having a good physical appearance, 25th item- receiving education in the level of universities related to sports, 27th item- having a earthily comfortable life, and 29th item- joining a friend group easily. No significant difference was found according to other items of the scale according to age groups. Thus, we can say that individuals with different age groups have similar reasons for starting sports and expectations. It can be said that individuals with a visual disability have different expectations in different ages, the age has an effect on emotions and thoughts; which may have resulted from the reasons for starting sports and their expectations are different.
When T-test results were analyzed according to Branches of Sports, it was found that there was a significant difference in q1 (t=2,94, p<0,05), q2 (t=2,96 p<0,05), q15 (t=-2,50 p<0,05), q26 (t=2,15 p<0,05), q28 (t=2,21 p<0,05), and q31(t=3,07 p<0,05). It was stated that individuals doing team sports had a higher score in Q15, in the other items, it was seen that individual sports doers’ scores were higher. The 1st item of the scale- mother, father, and siblings’ effect on tending to sports, 2nd item- the effect of the desire to be a national team athlete, 26th item- maintaining relationships with the environment as a popular sports doer, 28th item- being a coach, and 31th item- the effect of school sports facility and equipment canalizing to sports have been found higher in individual sports doers. 15th item in the scale- being aware of the positive contribution of the sports has been found higher in team sports doers. Some of the results of Şimşek and Gökdemir (2006)’s study support our study. No significant difference was found in other items of the scale between individuals with a visual disability who do individual or team sports. Accordingly, we can say that the reasons for starting sports and expectations of the team and individual sports doers are similar. We can state that some items of the reasons for starting sports and expectations’ of individuals doing individual and team sports being different may have resulted from their desires.
found that individuals with afterward disability had higher scores in q15 and q16. The scores were higher in individuals with congenital visual disability in 5th item of the scale- the effect of the environment on starting sports, 6th item- the effect of friends and peers on starting sports, 26th item- maintaining relationships with the environment as a popular sports doer, and 29th item- joining a friend group easily. The scores were higher in individuals with afterward disability in the 15th item in the scale, being aware of the positive contributions of the sports, 16th item- seeing new countries. There was no significant difference between individuals’ having congenital and afterward visual disability among other scale items.
The individual's having congenital or afterward disability affects the items of the scale. Thus, individuals’ having congenital or afterward disability, their reasons for starting sports and their expectations are similar in certain items and are different in some of the items.
When ANOVA Test results were analyzed according to visual acuity level, it was seen that there was a significant difference in q2 (F=3,24, p<0,05), q11 (F=3,02, p<0,05), q17 (F=3,80, p<0,05), and q28 (F=3,71, p<0,05). In the result of the PostHoc Tests which were done to determine in which groups the differentiation occurred, it was found that there was a significant difference between B2-B3 in q2, q11, and q28; and between B1-B2 in q17. In these items; 2nd item- the effect of the desire to be a national team athlete on starting sports, 11th item- loving sports, 28th item- being a coach, no significant difference was found according to o B2-B3 visual acuity levels. In the 17th item- making use of spare times through doing sports, there was a significant difference according to B1- B2 visual acuity levels. Among other items of the scale, no significant difference was found according to B1-B2-B3 visual acuity levels. As visual acuity levels change, we see that the reasons for starting sports and expectations of the individuals with a disability differ in the scale items. Even though individuals with a visual disability have different visual acuity levels, we can say that they have different reasons and expectations, and other items are similar. Although the visual degrees of individuals with a visual disability are different, as there is no significant difference in reasons for starting sports and expectations, we can say that emotions and thoughts are the same.
The experiences obtained through movements are not an aim in themselves; but they are a basic tool that is continuous and effective in growth and development (Kınalı, 2003). The positive effect of sports includes individuals with disabilities in the society, as well as their physical and mental development and enables them to establish better relations within the society (Savucu et al., 2006). Physical education and sporting activities enable individuals with disabilities to control their feelings such as aggression, anger, and jealousy, which arise as a natural consequence of their disabilities and the attitude of the society towards them (Kınalı, 2003). This can be said that sports is very important for the development and spread of sports for individuals with disabilities.
evaluate the reasons and expectations of athletes with visual disability and other individuals with disabilities on how to start doing sport.
References
Akdenk, M, & Ağaoğlu, S. A., & İmamoğlu, O. (1995). Türkiye’de Engelliler İçin Uygulamalı Spor Eğitimi Modeli.
Atay, M. (1995). Engelli Bireylerde Benlik Gelişiminde Spor Etkinliklerinin Önemi, Uluslararası Engellilerde Spor Eğitimi Sempozyumu, G.S.G.M. Spor Eğitimi Daire Başkanlığı, Antalya
Aracı, H. (2001), Öğretmen ve Öğrenciler için Okullarda Beden Eğitimi, Nobel Yayınevi, (6-7).
Barnes, C. (1998). The social model of disability: A sociological phenomenon ignored by sociologists. London: Cassell.
Bayraktar, B., & Suna, H. (2007). Türkiye’de Elit Bayan ve Erkek Voleybolcuların Spora Başlamasına Etki Eden Unsurlar ve Spordan Beklentileri, Spormetre Beden Eğitimi ve Spor Bilimleri Dergisi, (63-72).
Bayraktar, B., & Sunay, H. (2004). Elit Bayan ve Erkek Voleybolcuların Voleybol Sporuna Yönlenmelerine Neden Olan Unsurlar İle Beklentileri. 8. Uluslararası Spor Bilimleri Kongresi Kitapçığı, (78), Antalya.
Dalbudak, İ. (2012). 13-15 Yaş Arası Görme Engelli Sporcuların Stres ve Saldırganlık Düzeylerinin İncelenmesi, Ege Üniversitesi, Sağlık Bilimler Enstitüsü, Sporda Psiko-Sosyal Alanlar Anabilim Dalı, Yüksek Lisans Tezi, (103-104). İzmir.
Ergun, N., & Algun, C., & Dolunay, N. (1990). Engellilerde Spor Yaklaşımı, Spor Şurası Bildirileri, Gençlik ve Spor Genel Müd . Yayınları, Ankara.
IBSA. (2006). Capable of Everything. International Blind Sports Federation, Madrid, Spain, (35-59).
Hargreaves, J. (2000). Heroines of sport: The politics of difference and identity. London: Routledge.
Kabasakal, K. (2007). Zihinsel Engellilik, Zihinsel, Ruhsal, Duygusal Engellilik,
Lokomotif Medya, Konya.
Kınalı, G. (2003). Zihin Engellilerde Beden - Resim -Müzik Eğitimi, Farklı Gelişen Çocuklar, (Ed: Kulaksızoğlu A.), Epsilon Yayınları, İstanbul.
Savucu, Y., & Sirmen, B., & İnal, S., & Karahan, M., & Erdemir, İ. (2006). Zihinsel Engelli Bireylerde Basketbol Antrenmanının Fiziksel Uygunluk Üzerine Etkilerinin Belirlenmesi, Fırat Üniversitesi Sağlık Bilimleri Dergisi, 20(2) .
Şimşek, D., Gökdemir, K. (2006). “Ortaöğretimde Atletizm Yapan Sporcu Öğrencilerin Atletizm Branşına Yönelme Nedenleri ve Beklentileri, Spormetre Beden Eğitimi ve Spor Bilimleri Dergisi, (3) 83-90.
Özoğlu, S. C. (1997). Spor Psikolojisi ve Gelişmeler, I. Uluslararası Spor Psikolojisi Sempozyumu, Bağırgan Yayımevi, (Vol. 52).
Özürlüler İdaresi Başkanlığı (ÖZİDA), (1999). 1. Özürlüler Şurası: Çağdas Toplum, Çağdaş Yaşam ve Özürlüler Komisyon Raporları ve Genel Kurul Görüşmeleri. T.C. Başbakanlık Özürlüler İdaresi Başkanlığı, Ankara.
Özürlüler İdaresi Başkanlığı (ÖZİDA), Devlet İstatistik Enstitüsü Başkanlığı (2002).
Türkiye Özürlüler Araştırması – Turkey Disability Survey. 21(4). Ankara: Devlet İstatistik Enstitüsü.
Özyürek, M., (1995). Görme Yetersizliği Olan Çocuğu Bağımsızlığa Hazırlamak İçin Ana-Baba Rehberi. Başbakanlık Aile Araştırma Kurumu Yayınları, Ankara.
Sunay, H., & Saracaloğlu, S. (2003). Türk Sporcusunun Spordan Beklentileri İle Spora Yönelten Unsurlar’’ Ankara Üniversitesi Beden Eğitimi ve Spor Yüksekokulu Spormetre Beden Eğitimi Ve Spor Bilimleri Dergisi, (43).
Şimşek, D.(2005). Orta Öğretimde Atletizm Yapan Sporcu Öğrencilerin Atletizm Branşına Yönelme Nedenleri ve Beklentileri’’, Gazi Üniversitesi Eğitim Bilimleri Enstitüsü Beden Eğitimi ve Spor Öğretmenliği Anabilim Dalı Yüksek Lisans Tezi.
Turnbull, H. R. & Turnbull, A., & Shank, M., & Smith, S. J. (2004). Exceptional Lives Special Education in Today’s Schools. Pearson Press, Boston.
World Healt Organization (WHO). 2013). Visual impairment and blindness.
http://www.who.int/mediacentre/factsheets/fs282/en.
World Healt Organization (WHO). (2016). Disability and health. Retrieved from
Creative Commons licensing terms