Published by Science and Education Publishing DOI:10.12691/ajfn-8-3-1
Evaluation of Calorie Content of an All-natural Cane
Sugar and Botanical Extract Sweetener:
Studies in Wistar Rats
Sajan P.G.1,*,Rohith T.1,Martin Tower2,Prathap H.D.1
1
R&D Division, Trulit Herbals, Vishweshwaranagar, Mysuru-570008, India 2
Dendera Natural Health LLC, 6750 N, Fort Lauderdale, FL 33309, USA *Corresponding author: trulitherbals@gmail.com
Received July 19, 2020; Revised August 21, 2020; Accepted August 30, 2020
Abstract
The purpose of the study was to evaluate the caloric content and biochemical effects of an all-natural cane sugar/botanical extract sweetener in comparison to reference glucose in Wistar rats. A total of 24 male Wistar rats aged 6-7 weeks, weighing 148-188 grams, free from disease, and possessing a functional health status were chosen for the study. The animals were divided into four sets and allocated to different treatment groups using a randomized block design. For the study, the test and reference substances were administered orally at approximately one-hour intervals from Day 8 until the end of the treatment period. A greater than 50% reduction (58.7%) of liver adenosine triphosphate (ATP) levels (a proxy for caloric content) was observed for the test item (TI) treatment group compared to the reference glucose group. In the preliminary oral glucose tolerance test (OGTT), treatment with TI at a dose of 5.8 g/kg bodyweight considerably decreased the normal post-prandial rise in serum glucose levels. Other biochemical parameters such as cholesterol, triglycerides, LDL, and VLDL also decreased in the test item high dose group as compared to the normal control (NC).The current study confirms a significant reduction in calories (>50%) and blood glucose levels in Wistar rats when cane sugar is combined with a formulation of botanical extracts. Based on these results, we feel that all-natural TI has potential as a reduced-calorie, low glycemic index (GI) alternative to standard sucrose and can be a valuable dietary aid in the fight against the global obesity epidemic and its associated metabolic disorders.Keywords: diabetes, calorie, Glycemic index, liver ATP, Wistar rats
Cite This Article:
Sajan P.G.,Rohith T., Martin Tower,and Prathap H.D., “Evaluation of Calorie Content of an All-natural Cane Sugar and Botanical Extract Sweetener: Studies in Wistar Rats.” American Journal of Food and Nutrition, vol. 8, no. 3 (2020): 54-60. doi: 10.12691/ajfn-8-3-1.1. Introduction
Obesity has become one of the most significant current health care issues, with 39% of adults categorized as overweight or obese, thereby increasing comorbidity and lowering life expectancy [1,2]. It is a major contributing factor in many chronic medical conditions, including cardiovascular disease, diabetes, and cancer [3]. Although the development of obesity is multicausal, the main factor is always a positive energy balance [4]. Such positive energy balance results from an intake of energy from foods or beverages (calories), which exceeds the energy expenditure (including basal metabolism, thermogenesis, or physical activity) [4,5,6]. Today, Americans consume 150-300 more calories per day than they did 30 years ago, and sweetened beverages account for 50% of this increase
[7,8].
A high intake of added sugar is associated with an excess calorie intake, which will increase body fat if not compensated for by energy expenditure [9]. Sugar or
sucrose cannot easily be replaced by other nutrients in solid or liquid foods to reduce calorie content without affecting functional properties. If sucrose is replaced with other carbohydrates, the taste may be negatively affected while the caloric value will not substantially change. However, the replacement may still affect blood glucose levels [10]. If replaced by fat, the calorie content of solid foods will likely increase. In beverages, sucrose can be replaced by non-nutritive sweeteners, resulting in reduced energy content.
In contrast, in solid foods, it is challenging to reduce sucrose levels without changing technical properties and taste. Besides its sweetness, sucrose is key for bulk and texture, as well as for flavour formation. Currently, no commercially available sweetener exists that adequately duplicates the functional properties and taste of sucrose
Diabetes is rapidly emerging as a worldwide health epidemic in the 21st century. The increase in diabetes cases has paralleled the dramatic increase in worldwide obesity and insulin resistance [21,22]. This increase has prompted researchers to explore potential nutritional causes. Over consumption of sugars, primarily sucrose, has been targeted as a primary factor in diabetes [16]. However, its relationship with type-2 diabetes is still not fully understood. Research into the connection between sugar consumption and type-2 diabetes is ongoing. Whereas most doctors argue that sucrose alone does not trigger diabetes, there is compelling evidence to suggest that the consumption of low GI and/or low-calorie foods minimizes large fluctuations in blood glucose levels [23,24]. It is hypothesized that Low GI foods affect weight control by promoting satiety and fat oxidation at the expense of carbohydrate oxidation
[25].
Novel research has been carried out to prepare a reduced-calorie cane sugar product with the benefits of five botanicals. The test product used in the present study is cane sugar blended with a colorless, odorless, and tasteless solution prepared from aqueous extracts of five botanicals. The study’s objective was to evaluate the effect of herbal sweetener on liver ATP (adenosine triphosphate) or caloric content and metabolic markers in Wistar rats.
2. Materials and Methods
This study was undertaken by Vipragen Biosciences Pvt. Ltd, Mysore, Karnataka, India, with protocol number VBPL-P019/19. The Institutional Animal Ethics Committee (IAEC) approved all methods and procedures for the study. The experiments were conducted as per the Committee for the Purpose of Control and Supervision of Experiments on Animals (CPCSEA) guidelines for the conduct of scientific experiments on animals, Ministry of Environment & Forests (Animal Welfare Division) Government of India, June 2007.
2.1. Preparation of Test Item (TI) All Natural
Cane Sugar
A novel herbal extraction technology has been developed by using five herbs that is 100% water based. The proprietary process extracts desired materials from the five herbs over a semi-continuous process. The process of extraction requires precise control of temperature and processing conditions for optimal extraction of desired molecular values of efficacious materials. The herbal extract slurry is filtered seven times in a batch filtration step using multilayer cotton fibre filters. The final product after the seven stage filtration process will be a clear herbal solution. The water based herbal solution, crystal clear water without turbidity. Finally, all the solution is mixed in a specific ratio and diluted. After conditioning the solution a day, the mixture is again filtered. All natural cane sugar is manufactured by using a proprietary process wherein regular white sugar is reprocessed with the herbal solution.
2.2. Experimental Animals
A total of 24 male Wistar rats aged 6-7 weeks, weighing 148-188 grams, free from diseases, and with functional health status, were chosen for calorie determination. The Wistar rats were purchased from a CPCSEA-registered animal provider. The animals were housed under standard laboratory conditions, air-conditioned with adequate fresh air supply (10-15 Air changes per hour), room temperature 22 ± 3°C, relative humidity 30-70%, with cycles of 12 hours of light and 12 hours of dark in sequence. The animals were housed three per cage in standard polycarbonate cages. The cages were fitted with stainless steel mesh top grill having facilities for holding pellet feed and a drinking water bottle.
2.3. Study Design
The animals were divided into four groups, as presented in Table 1. Grouping of animals was done by the method of bodyweight (BW) stratification and randomization manually. Animals were allocated to different treatment groups using randomized block design, and it was ensured that there was no statistically significant difference in the body weight between the treatment groups. The animals from group G1 were designated as the NC. Only the feed vehicle was orally administered. In Group G2, the reference item (RI) was mixed with the vehicle and dosed per oral (PO). Groups G3 and G4 were test item (TI) doses, where low and high doses, respectively, of the TI were mixed with the vehicle and dosed orally.
Table 1. Group Details of the Main Study
Groups Dose Groups Doses
(g/kg) Route
Duration (in days)
No. of animals/group
G1 Vehicle 0.0 P.O
17
6
G2 Reference item -
Glucose 10.0 P.O 6
G3 TI Low dose 4.0 P.O 6
G4 TI High dose 10.0 P.O 6
Total number of animals 24
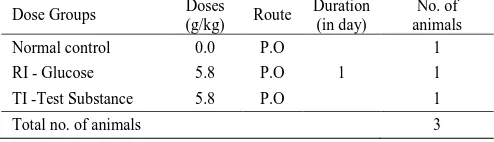
A total of 3 male Wistar rats were chosen for the preliminary OGTT. Animal number 1 was an NC where only the vehicle was orally administered. Animal number 2 was designated RI glucose, and animal number 3, TI and both were dosed PO with a dose volume of 10 mL/kg BW. All animals were fasted overnight. The RI and TI were administered through the oral (gavage) route. The assignment of animals is presented in Table 2.
Table 2. Group Details of the Preliminary Study - OGTT
Dose Groups Doses
(g/kg) Route
Duration (in day)
No. of animals
Normal control 0.0 P.O
1
1
RI - Glucose 5.8 P.O 1
TI -Test Substance 5.8 P.O 1
Total no. of animals 3
approximately 1 hour from day eight until the end of the treatment period. The animals were treated daily with TI/RI for 17 days. For the preliminary study, TI/RI was administered orally at 20.0 mL/kg/bw once.
2.4. In-life Observations and Measurements
The animals were observed twice daily and once during holidays for morbidity and mortality for the duration of the study period. All the animals were observed for TI treatment-related clinical signs of toxicity. The animals were observed for adverse effects on the respiratory, cardiovascular, gastrointestinal, and nervous systems. All animal bodyweights were recorded every two days during the treatment period. The quantity of feed consumption was also measured every two days. The amounts of feed offered and remaining were recorded for each cage, and feed intakes (g/rat/day) were calculated.
Fasting blood samples were collected on days 1, 8, and 18. The blood samples were collected after overnight fasting from the retro-orbital sinus under isoflurane-oxygen anaesthesia. Fasting glucose was estimated on days 1 and 8 using a biochemical analyzer and on days 11 and 18 with a glucometer by using a drop of blood from the tail vein. The clinical chemistry parameters calculated at the end of the study period were fasting glucose, glycated haemoglobin (HbA1c), total cholesterol (CHO), triglycerides (TRI), high-density lipoproteins (HDL), low-density lipoproteins (LDL) and very-low-density lipoproteins (VLDL).
2.5. Liver ATP Estimation
Animals were sacrificed by isoflurane-oxygen euthanasia. Livers were collected, weighed, flash frozen in liquid nitrogen and subjected to tissue ATP estimation using a Kit Method (Kit: BioVision Inc. Catalog #K354-100; ATP colorimetric Assay). Tissue samples were homogenized and centrifuged ice cold at 15,000×G for 2 minutes and supernatant was collected. The reaction mix was then added to each well containing the ATP standard and test samples and incubated at room temperature for 30 minutes, protected from light. The optical density reading was measured at 570 nm in a micro-plate reader. Tissue ATP levels were calculated for each animal and the mean value and standard deviation was tabulated for each group. The % change was calculated with respect to the vehicle treatment group.
2.6. Necropsy
Throughout the study period, no unscheduled deaths of animals were observed. All the animals were euthanized using an overdose of isoflurane at the conclusion of both preliminary and primary studies. The rats from the primary study were subjected to a complete necropsy examination, which included an evaluation of external and internal gross necropsy observations. The gross pathological examination was made and recorded. All animals in the study were subjected to a full, detailed gross necropsy, including careful examination of the body’s external surface. This examination included all orifices of the cranial, thoracic, and abdominal cavities and their contents. Organs such as adipose tissue, brain, heart, kidneys, liver, pancreas, and spleen from the main study were washed with phosphate-buffered saline, and weights were recorded.
2.7. Statistical Analysis
Statistical analyses were performed using GraphPad Prism software version 7.04. Data for each group of animals were subjected to a one-way analysis of variance (one-way ANOVA). Data is expressed as mean ± standard deviation (SD). All analyses and comparisons were evaluated at the 5% (P≤0.05) level.
3. Results
3.1. Clinical Observation and Mortality
There was no treatment-related mortality or clinical signs of toxicity observed during the study in any of the treated or control groups. None of the rats showed signs of toxicity in their skin, fur, eyes, salivation, behaviour, or sleep.
3.2. Body and Organ Weight
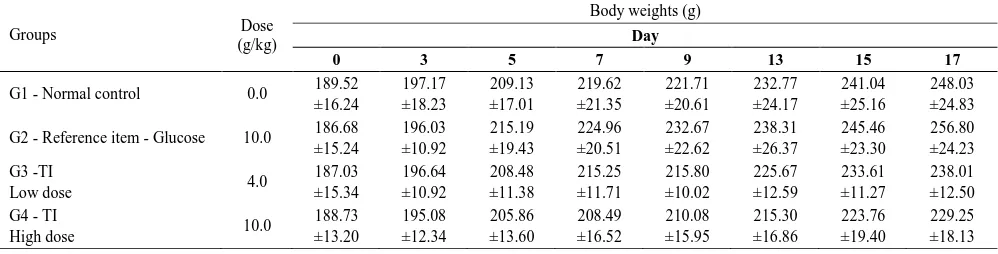
Bodyweight gains in the TI groups were comparable to that of the NC. The TI groups showed a decrease compared to both the NC and RI. In the TI groups, bodyweight varied throughout the study due to individual rat behaviour, but all rats exhibited a net decrease in bodyweight over time. The relative weight of each organ recorded at necropsy in the treatment groups did not show a significant difference (p > 0.05) compared to the NC. The bodyweights and organ weights of rats are presented in Table 3 & Table 4, respectively.
Table 3. Summary of Body Weights
Groups Dose
(g/kg)
Body weights (g) Day
0 3 5 7 9 13 15 17
G1 - Normal control 0.0 189.52
±16.24 197.17 ±18.23 209.13 ±17.01 219.62 ±21.35 221.71 ±20.61 232.77 ±24.17 241.04 ±25.16 248.03 ±24.83
G2 - Reference item - Glucose 10.0 186.68
±15.24 196.03 ±10.92 215.19 ±19.43 224.96 ±20.51 232.67 ±22.62 238.31 ±26.37 245.46 ±23.30 256.80 ±24.23 G3 -TI
Low dose 4.0
187.03 ±15.34 196.64 ±10.92 208.48 ±11.38 215.25 ±11.71 215.80 ±10.02 225.67 ±12.59 233.61 ±11.27 238.01 ±12.50 G4 - TI
High dose 10.0
188.73 ±13.20 195.08 ±12.34 205.86 ±13.60 208.49 ±16.52 210.08 ±15.95 215.30 ±16.86 223.76 ±19.40 229.25 ±18.13
Table 4. Summary of Organ Weights
Groups Dose (g/kg) Organ weights (g)
Liver Kidney Spleen Adipose Heart Pancreas Brain
G1 - Normal control 0.0 7.89±0.72 1.84±0.23 0.78±0.28 1.81±0.99 0.92±0.05 0.64±0.42 1.74±0.07
G2 - Reference item - Glucose 10.0 6.90±1.51 1.62±0.26 0.75±0.30 1.77±0.35 0.77±0.09 0.48±0.17 1.66±0.16
G3 - TI Low dose 4.0 7.68±1.05 1.71±0.26 0.790±.14 1.21±0.31 0.81±0.11 0.63±0.27 1.83±0.08
G4 - TI High dose 10.0 6.41±1.04 1.61±0.21 0.60±0.06 1.53±0.44 0.83±0.08 0.59±0.22 1.73±0.08
n=6; Values are in Mean±SD; p>0.05, * - significance with respect to G1, # - significance with respect to G2.
Table 5. Summary of fasting glucose levels
Groups Dose (g/kg) Glucose values (mg/dL)
Day 01 Day 10 Day 17
G1 - Normal control 0.0 73.51±9.20 86.67±8.08 75.00±11.68
G2 - Reference item - Glucose 10.0 72.02±16.25 80.33±9.50 76.67±7.23
G3 - TI Low dose 4.0 73.50±7.41 73.33±6.66 75.83±12.09
G4 - TI High dose 10.0 77.28±5.65 82.00±6.81 70.50±12.08
n=6; Values are in Mean±SD; p>0.05.
Table 6. Summary of biochemical parameters
Groups Dose (g/kg)
Biochemical parameters CHO
mg/dL
TRI mg/dL
HDL mg/dL
LDL mg/dL
VLDL mg/dL
HbA1c %
G1 - Normal control 0.0 72.34±7.33 73.18±16.35 13.05±1.91 9.00±1.60 14.64±3.27 5.98±1.58
G2 - Reference item - Glucose 10.0 55.50±7.58 82.35±23.81 11.52±2.17 6.74±2.02 16.43±4.71 6.87±1.70
G3 - TI Low dose 4.0 56.56±7.17 75.90±19.44 11.92±1.36 6.01±0.90 14.92±3.65 5.45±2.54
G4 - TI High dose 10.0 59.23±14.31 64.25±30.10 12.95±2.73 4.94±0.95 13.52±4.98 5.17±0.69
n=6; Values are in Mean±SD; p>0.05.
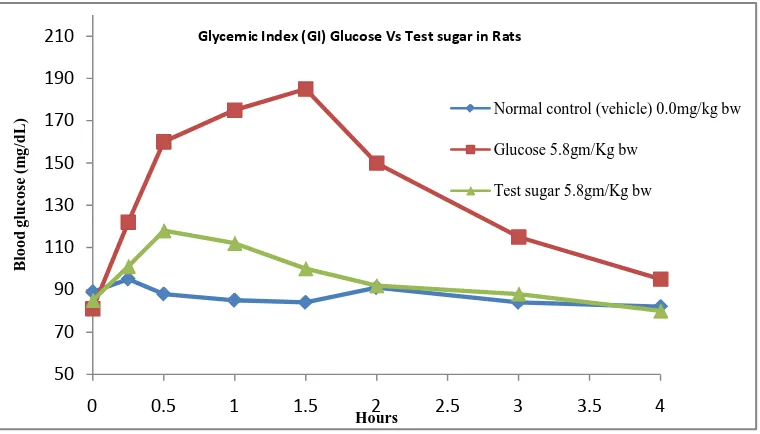
Table 7. Summary of OGTT study
Dose Blood Glucose values (mg/dL) of OGTT test
0.0 hr 0.25 hr 0.5 hr 1.0 hr 1.5 hr 2.0 hr 3.0 hr 4.0 hr
NC 89 103 81 83 84 96 81 79
RI - Glucose (5.8 g/kg) 81 122 160 175 185 150 115 95
TI - (5.8 g/kg) 85 101 118 112 100 92 88 80
3.3. Clinical Pathology
For the main study animals, fasting glucose was measured on day 1 (pre-treatment), day 10 (treatment), and day 17 (post-treatment). The results showed that the TI-high dose treated rats are comparable with the NC as well as with the RI. It was interesting to note that parameters such as cholesterol, triglycerides, LDL and VLDL were significantly decreased in TI-high dose treated rats when compared to the NC and RI. The HDL result was comparable with the normal control, whereas significant decreases were observed in the HbA1c levels of both TI groups in comparison with the RI. The summary of fasting glucose levels and biochemical parameters are presented in Table 5 & Table 6, respectively.
In the OGTT study, the blood glucose values of the TI group were comparable to the NC from 0.0 hr to post-treatment up to 4.0 hr. However, there was a considerable reduction of blood glucose in the TI group compared with the RI. After 1.0 hr, blood glucose was 175mg/dL in the RI group, whereas it was 112mg/dL in the TI group. The maximum blood glucose value in the RI group was 185mg/dL, compared with 118mg/dL in the TI group. The reduction in blood glucose values in TI-treated
rats is attributed to the effect of the potent herbal extract formulation. The glucose values are presented in Table 7.
3.4. Liver Samples for ATP Analysis (Caloric
Content)
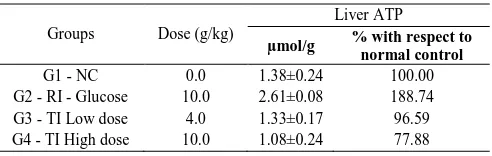
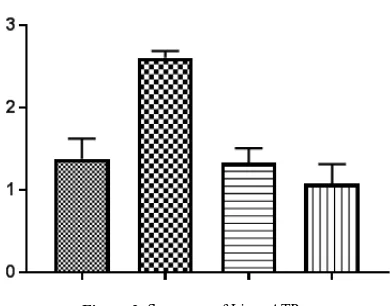
Liver ATP levels (caloric content) in both TI groups were comparable to the NC, whereas the RI group showed significantly higher ATP levels (caloric content). It is interesting to note that greater than 50% of reduction in liver ATP in the TC High dose group as compared to the RI. These results suggest that rats consuming high carbohydrate TI do not experience an increase in glucose level due to the influence of the botanical ingredients. A summary of liver ATP values is presented in Table 8.
Table 8. Summary of liver ATP
Groups Dose (g/kg)
Liver ATP
µmol/g % with respect to
normal control
G1 - NC 0.0 1.38±0.24 100.00
G2 - RI - Glucose 10.0 2.61±0.08 188.74
G3 - TI Low dose 4.0 1.33±0.17 96.59
G4 - TI High dose 10.0 1.08±0.24 77.88
4. Discussion
The present study investigated the effects of test item (TI) on liver ATP, glucose profile, and other biochemical markers throughout the postprandial periods in Wistar rats. The TI is all-natural cane sugar (sucrose) blended with botanical extracts and is a nutritive source of carbohydrates and energy.
In the preliminary OGTT study, the blood glucose values of TI were comparable to a NC from 0.0 hr to post-treatment up to 4.0 hr. In the OGTT, TI treatment at a dose of 5.8 g/kg body weight significantly suppressed the rise of blood glucose by inhibiting the activity of disaccharides in the small intestine of rats. We observed an approximately 70% inhibition of the rise in blood glucose levels after TI treatment compared with the RI. Several studies have reported that plant extracts inhibited the activity of α-glucosidase [24,25,26]. Glucosidase is an enzyme required for the metabolism of non-absorbable oligosaccharides into absorbable monosaccharides in the small intestine. Photochemical screening test results showed that the botanical ingredients in TI contain saponins, flavonoids, polyphenols and antioxidants. These compounds are known to reduce the risk of diabetes, increasing tyrosine phosphorylation activity and by decreasing phosphatase-mediated insulin receptor inactivation, peripheral glucose utilization and stimulate insulin release and potentiate the effects of insulin [26,27].They may also be responsible for the lack of a rise in blood glucose levels in TI-treated rats. Therefore, the glycemic control exerted by TI can be attributable to α-glucosidase inhibition. Additionally, the ingredients integrate insulin signalling with mitochondrial function, thus improving hepatic metabolism during insulin resistance and metabolic syndrome [28]. By adenosine monophosphate-activated protein kinase activation, it decreases the blood sugar and cholesterol level, and maintains blood pressure [29,30]. The glycemic profiles for glucose and TI are graphically presented in Figure 1.
The second significant finding came by comparing the liver ATP levels of glucose-treated and TI-treated rats. The study showed a significant decrease in liver ATP
levels (>50%, caloric content) in Wistar rats treated with TI compared to those treated with glucose. ATP is an energy-carrying molecule found in the cells of all living things. Sucrose is catabolized to glucose and fructose in the small intestine with the help of the enzyme sucrase. Glucose is metabolized into pyruvate through glycolysis in the cytoplasm, and pyruvate is wholly oxidized to generate ATP through the tricarboxylic acid (TCA) cycle and oxidative phosphorylation in the mitochondria. Fructose metabolism occurs entirely in the liver. Through a complicated process called fructolysis, fructose undergoes several chemical and structural changes with the help of aldolase B, an enzyme in the liver. In the RI group, the ATP measured is 2.61µmol/g, whereas, in the NC, it is 1.38µmol/g. However, in the TI group, the ATP measured is 1.08µmol/g. The reduction of ATP in this group is due to either incomplete digestion of TI in the intestine or by not being fully absorbed in the blood. The botanical ingredients blended with cane sugar were capable of inhibiting sucrose digestion. Consequently, the calories were also reduced in TI-treated rats. The herbal solution contains a unique blend of bioactive components including saponins, flavonoids, polyphenols and antioxidants. This may be attributed to the fact that TI digestibility decreased as bioactive components present in it. Because of TI resist digestion and absorption, it may or may not undergo microbial fermentation in the large intestine. These mechanisms appear to decrease nutrient absorption, therefore, decreasing metabolizable energy. The summary of liver ATP data is presented in Figure 2.
A further finding of our study was a decrease in body weight (8%) in the TI group after the 17-day trial in comparison with the RI group. The present study showed a significant decrease in triglycerides, total cholesterol, and LDL-cholesterol in TI high dose treated rats. These decreases might be due to an increase in insulin, which caused an increased activity of lipoprotein lipase and a decreased activity of hormone-sensitive lipase [31]. Collectively, these data supported the reduction in liver ATP in TI treated rats. Further research is necessary to understand the mechanism of calorie reduction and glycemic index in humans.
Figure 1. Graphical representation of OGTT
50 70 90 110 130 150 170 190 210
0 0.5 1 1.5 2 2.5 3 3.5 4
B
lo
o
d
g
lu
co
se
(
m
g
/d
L
)
Hours
Glycemic Index (GI) Glucose Vs Test sugar in Rats
Normal control (vehicle) 0.0mg/kg bw
Glucose 5.8gm/Kg bw
Figure 2. Summary of Liver ATP
5. Conclusions
In this study, the metabolic effects of consumption of an all-natural, cane sugar/botanical extract sweetener (TI) was evaluated in male Wistar rats. The preliminary finding of this study is a greater than 50% (58.7%) decrease in ATP levels (caloric content) in the TI treatment groups as compared to the reference item glucose. The study also showed decreases in serum glucose, cholesterol, triglycerides, LDL, VLDL, and HDL levels. The daily consumption of the TI for 17 days did not cause any adverse effects during the study period. The OGTT test was well tolerated and blood glucose levels returned to baseline post-treatment. Based on these results, we feel that this all-natural sweetener has potential as a reduced-calorie, low GI alternative to standard sucrose and can be a valuable dietary aid in the fight against the global obesity epidemic and its associated metabolic disorders. Further study is therefore required to test its effects on both healthy humans and those with metabolic disorders such as Type 2 Diabetes.
Acknowledgements
The authors would like to express thanks to Kumaraswamy MV and Vipragen Biosciences Pvt. Ltd, Mysore, Karnataka, India, and all the participants involved in the study and data acquisition.
Conflicts of Interest
The authors declare that they have no conflict of interest.
Abbreviations
ATP: Adenosine Triphosphate (ATP) BW: Body Weight
CHO: Total Cholesterol
CPCSEA: Committee for the Purpose of Control and Supervision of Experiments on Animals GI: Glycemic Index
HbA1c: Glycated Haemoglobin HDL: High Density Lipoproteins
IAEC: Institutional Animal Ethics Committee LDL: Low Density Lipoproteins
NC: Normal Control
OGTT: Preliminary Oral Glucose Tolerance Test PO: Per Oral
RI: Reference Item TI: Test Item TRI: Triglycerides
VLDL: Very Low Density Lipoproteins
References
[1] World Health Organization Obesity and Overweight. Fact Sheet,
2008. Available:
http://www.who.int/news-room/fact-sheets/detail/obesity-and-overweight.
[2] McNamara, J.M., Houston, A.I., Higginson, A.D., “Costs of
foraging predispose animals to obesity-related mortality when
food is constantly abundant”. PLoS One, Vol. 10(11): e0141811,
2015.
[3] Johnson, R.J., Sánchez-Lozada, L.G., Andrews, P., Lanaspa, M.A.,
“Perspective: a historical and scientific perspective of sugar and its
relation with obesity and diabetes”. Advance Nutrition, vol. 8,
412-22, 2017.
[4] Kramer, C.K., Zinman, B., Retnakaran, R., “Are metabolically
healthy overweight and obesity benign conditions?: a systematic
review and meta-analysis”. Annals of Internal Medicine, vol. 159,
758-769, 2013.
[5] Spiegelman, B.M., Flier, J.S., “Obesity and the regulation of
energy balance”. Cell, vol. 104, 531-543, 2001.
[6] Hummel, E., Witting, F., Schneide,r K., Gebhardt, N.,
Hoffmann, I., “The complex interaction of causing and resulting factors of overweight/obesity. Increasing the understanding of the problem and deducing requirements for prevention strategies”. Wissensschaft & Forschung, vol. 60, 2-7, 2012.
[7] Briefel, R.R., Johnson, C.L., “Secular trends in dietary intake in
the United States”. Annual Review of Nutrition, vol. 24, 401-31,
2004.
[8] Nielsen, S.J., Siega-Riz, A.M., Popkin, B.M., “Trends in energy
intake in U.S. between 1977 and 1966: Similar shifts seen across
age groups”. Obesity Research, vol. 10, no. 5, 370-378, 2002.
[9] Morenga, L.T., Mallard, S., Mann, J., “Dietary sugars and body
weight: systematic review and meta-analyses of randomised
controlled trials and cohort studies”. BMJ Clincial Research, vol.
346:e7492, 2013.
[10] Atkinson, F.S., Foster-Powell, K., Brand-Miller, J.C., “International
tables of glycemic index and glycemic load values”. Diabetes
Care, vol. 31, 2281-3, 2008.
[11] Rippe, J.M., Angelopoulos, T.J., “Sucrose, high-fructose corn
syrup, and fructose, their metabolism and potential health effects:
what do we really know?”. Advance Nutrition, vol. 4, 236-245,
2013.
[12] Kahn, R., Sievenpiper, J.L., “Dietary sugar and body weight: have
we reached a crisis in the epidemic of obesity and diabetes? We have, but the pox on sugar is overwrought and overworked”.
Diabetes Care, vol. 37, 957-62, 2014.
[13] Havel, P.J., “Dietary fructose: implications for dysregulation of
energy homeostasis and lipid/carbohydrate metabolism”. Nutrition
Reviews, 63, 133-57, 2005.
[14] Stanhope, K.L., Have, l P., “Endocrine and metabolic effects of
consuming beverages sweetened with fructose, glucose, sucrose or
high-fructose corn syrup”. American Journal of Clinical Nutrition,
vol. 8, 1733S-1737S, 2008
[15] Malik, V.S., Sculze, M.B., Hu F.B., “Intake of sugar-sweetened
beverages and weight gain: a systematic review”. American
Journal of Clinical Nutrition, vol. 84, no. 2, 274-288, 2006.
[16] Malik, V.S., Willett, W.C., Hu F.B., “Sugar-sweetened beverages
and BMI in children and adolescents: reanalyses of a meta
analysis”. American Journal of Clinical Nutrition, vol. 89, no. 1,
438-439, 2009. 2009; 89(1): 438-439.
[17] Montonen, J., Jarvinen, R., Knekt, P., Heliovaara, M., Reunanen,
and glucose predict type 2 diabetes occurrence”. Journal of Nutirion vol. 137, no. 6, 1447-1454, 2007.
[18] Matthias, B.S, Joann, E.M., David, S.L., Graham, A.C., Meir, J.S.,
Walter, C.W., Frank, B.H., “Sugar-sweetened beverages, weight gain, and incidence of type 2 diabetes in young and middle-aged
women”. Journal of Americal Medical Association, vol. 292,
927-934, 2004.
[19] John, P.B., “Dietary fructose and metabolic syndrome and
diabetes”. Journal of Nutrition, vol. 139, no. 6, 1263S-1268S,
2009.
[20] Anastasia, S., Kieron, R., B Robert, A. B., “Metabolic and
behavioural effects of sucrose and fructose/glucose drinks in the
rat”. European Journal of Nutrition, vol. 51, 445-454, 2012.
[21] Defronzo, R.A., “Banting Lecture: from the triumvirate to the
ominous octet: a new paradigm for the treatment of type 2 diabetes
mellitus”. Diabetes, vol. 58, 773-95, 2009.
[22] Nolan, C.J., Damm, P., Prentki, M., “Type 2 diabetes across
generations: from pathophysiology to prevention and
management”. Lancet, vol.378, 169-81, 2011.
[23] Corkey, B.E., “Banting Lecture: Hyperinsulinemia: cause or
consequence?”. Diabetes vol. 61, 4-13, 2012.
[24] Kaur, B., Ranawana, V., The, A.L., Henry, C.J.K., “The impact of
a low glycemic index (GI) breakfast and snack on daily blood glucose profiles and food intake in young Chinese adult males”. Journal of Clinical & Translational Endocrinolgy, vol. 2, no. 3, 92-98, 2015.
[25] Miller, J.B., Hayne, S., Petocz, P., Colagiuri, S., “Low-glycemic
index diets in the management of diabetes: a meta-analysis of
randomized controlled trials”. Diabetes Care, vol. 26, no.8,
2261-2267, 2003.
[26] Brand-Miller, J.C., Holt, S.H.A., Pawlak, D.B., McMillan, J.,
“Glycemic index and obesity”. American Journal of Clinical
Nutrition, vol. 76, no. 1, 281-285, 2002.
[27] Zhang, Y., Li, X., Zou, D., Liu, W., Yang, J., Zhu, N., Huo, L.,
Wang, M., Hong, J., Wu, P., Ren, G., Ning, G., “Treatment of type 2 diabetes and dyslipidemia with the natural plant alkaloid
berberine”. Journal of Clinical Endocrinology & Metabolism, vol.
93, no. 7, 2559-2565, 2008.
[28] Yin, J., Xing, H., Ye J., “Efficacy of berberine in patients with
type 2 diabetes mellitus”. Metabolism, vol. 57, no. 5, 712-717,
2008.
[29] Cheng, Z., Guo, S., Copps, K., Dong, K.X., Kollipara, R., Rodgers,
J.T., “Foxo1 integrates insulin signalling with mitochondrial
function in the liver”. Nature medicine, vol. 15, no. 11, 1307-1311,
2009.
[30] Ming Zhang, Li Chen, “Berberine in type 2 diabetes therapy: a
new perspective for an old antidiarrheal drug?:. Acta
Pharmaceutica Sinica B, vol. 2, bno. 4, 379-386, 2012.
[31] Daisy, P., Eliza, J., Farook, K.A.M., “A novel dihydroxy
gymnemic triacetate isolated from Gymnemasylvestre possessing normoglycemic and hypolipidemic activity on STZ-induced
diabetic rats”. Journal of Ethnopharmacolgy, vol. 126, 339-344,
2009.