Published by Science and Education Publishing DOI:10.12691/jbe-7-1-1
Can the IPO Price Limit Policy
Affect Investor Disposition Effect?
Xindong Zhang, Wenqiang Zhao*
School of Economics and Management, Shanxi University, Taiyuan, China *Corresponding author: 454420361@qq.com
Received November 04, 2019; Revised December 15, 2019; Accepted December 21, 2019
Abstract
After China began to implement the maximum increase limit policy on the first day of IPO, it had aprofound impact on investor behavior. This article uses the public information of the IPO market from 2006 to 2012 and 2014 to 2018 to start with the transaction volume and turnover rate, study the impact of policies on the industry, test the effect of investor disposition effects on this basis, and attempt to attribute the impact. The research results show that the policy has a greater impact on high-yield industries. Investors dominated by small-cap stocks have a weaker disposition effect, while investors dominated by large-cap stocks still have irrational disposition effects. Therefore, the increase limit policy can weaken the investor's disposition effect to a certain extent and decline its speculative effect.
Keywords
: investor behavior, increase limit, disposition effectCite This Article:
Xindong Zhang, and Wenqiang Zhao, “Can the IPO Price Limit Policy Affect InvestorDisposition Effect?” Journal of Behavioural Economics, Finance, Entrepreneurship, Accounting and Transport, vol. 7, no. 1 (2019): 1-9. doi: 10.12691/jbe-7-1-1.
1. Introduction
On January 12, 2019, Xinghai Fang, Vice Chairman of the China Securities Regulatory Commission, said at the 23rd China Capital Market Forum: "There is a 44% limit on the first day of listing of new shares, and the price rose 44% on the first day. The price without trading volume is an inaccurate price. The price is unreasonable due to artificial restrictions, and there is no trading volume in the past few days, which is very unreasonable and restricts trading. The first-day daily limit board has to be studied. I personally think it should be cancelled. "This proposal has caused heated discussions in the market. The more common response is that there are many disadvantages in setting limits on the first day of listing of new shares, and it should be considered for cancellation. Earlier, the original intention of limiting the rise and fall of the stock on the first day of the stock market was to combat excessive speculation in the process of issuing new shares and reduce the IPO underpricing rate. This incident dates back to the end of 2012. The China Securities Regulatory Commission carried out a wide range of financial inspections and suspended the review of the IPO. Before the new round of new shares was issued on November 30, 2013, in order to strengthen the restrictions on new speculation The Securities Regulatory Commission issued the "Opinions on Further Promoting the Reform of the New Share Issuance System", discussing that the stock exchange should further improve the opening price formation mechanism on the first day of listing of new
shares and the initial trading mechanism for new shares, and establish a first listing day suspension mechanism based on the issue price of new shares. In December 2013, the Shanghai and Shenzhen Stock Exchanges both issued a new policy to supervise the initial trading of new shares, which further restricted new speculation, including the limit of daily limit on the first day. The highest increase on the first day was 44% of the issue price of new shares. The IPO restarted in January 2014. Once the largest increase of the initial public offering of shares on the first day of listing and the temporary suspension of trading system were implemented, the new shares generally rose 44% for the first day. The next day began to compete for the number of consecutive daily limits. This obvious change in market response will inevitably affect investor behavior. This deviation in psychological expectations will affect investor sentiment and cause irrational behavior of investors.
and expected rational behavior. The disposition effect is an important phenomenon in behavioral finance theoretical research. An irrational behavior of investors in the securities market is described by Shefrin and Statman
[1] was proposed for the first time, manifested as investors in the disposition When it comes to stocks, the tendency to sell profitable stocks and continue to hold money-losing stocks is the so-called "sell win and hold lose" effect. The basic purpose is to maximize returns while delaying losses. Shefrin et al. inspired by Prospect Theory writed by Kahneman and Tversky [2], the reason for the disposition effect is attributed to the psychology of the investor. The investor avoids the realization of the loss in order to avoid the regret caused by the loss, because once the loss is realized, the investor's judgment is wrong Investors are eager to achieve profit, in order to prove that their investment is correct, which reflects the investor's psychological certainty of profit and aversion to loss. This is consistent with the conclusions put forward by the prospect theory. In the prospect theory, investors rely on the S-type value function based on the reference point to evaluate the returns. The performance is shown in the income stage, and the graph is concave. In the loss stage, the picture is convex. This shows that investors are risk averse when gaining, and risk seeking when losing. Shefrin et al. constructed a "statistical variable for the buying and selling cycle time" by studying the data on the day of purchasing mutual funds from 1961 to 1981, taking into account psychological accounts, regret aversion, self-control, and taxation, discovered the investor's tendency to rush to achieve profit and avoid losses.
This article believes that the limit-of-growth policy will inevitably bring different market responses. Behavioral finance believes that emotion is an important factor affecting investor behavior, and market situation is an important factor affecting investor sentiment. Therefore, policies will affect investors to make rational Irrational behavior. Individual investors are the main body in China's securities market and the basis for the survival and development of China's securities market. Individual investors have a low level of rationality and their behavior is susceptible to their inherent cognitive biases and market policies. Including market policy in the study of investor behavior, it is proved that the difference in market policy is the reason for the change in disposition effect, which shows that market policy has a certain effect on investor behavior, and it is one of the reasons to a certain extent that investors adopt a certain transaction behavior. Disposition effect is an important reason for many investors, especially individual investors, to win less and lose more. Research on this will help to grasp the behavioral characteristics and laws of investors, and provide good suggestions for improving the rationality of investors. This paper draws on the theory, model and analysis framework of behavioral finance, and uses the stock market transaction data of the A-share IPO listed from January 2006 to December 2018 to test the issues that we are concerned about the implementation of the post-2014 growth limit policy. The impact of policies on investor disposition effects was analyzed, and corresponding empirical analysis was performed. The structure of the rest of this article is as follows: the second part is a literature review, the third part is the research
design, the fourth part is the empirical results and analysis, and the fifth part is the research conclusions and research limitations.
2. Literature Review
Since Shefrin and Statman discovered the disposition effect, a large number of scholars have begun to study methods that can measure the extent of the disposition effect, and test whether there is a disposition effect from the perspective of individuals and markets. To study the disposition effect of individual investors, the most classic is Odean [3], using a large discount brokerage company in the United States from 1987 to 1993 to study the transaction of a total of 10,000 accounts. He proposed an index to measure the degree of disposition effect, that is, the difference between the actual profit ratio and the actual loss ratio. By comparing the selling price of the stock with its average selling price, he calculated the book return and the book loss. There is a strong trend of selling profits and holding losses, and this behavioral motivation cannot be explained by rational reasons such as rebalancing the investment portfolio, reducing transaction costs, and reversing expectations. For tax avoidance reasons, US stock investors sold more loss-making stocks in December, so the disposition effect was less pronounced in December. Since then, scholars have mostly used this “selling ratio” measurement method to measure the disposition effect on the basis of obtaining individual investor transaction records.
However, if the account information and transaction records of individual investors cannot be obtained, it will be difficult to study whether individual investors have a disposition effect, and the acquisition of records involves personal privacy. Therefore, some scholars have begun to test the disposition effect by observing the changes in the entire stock market from the perspective of the market. Ferris et al. [4] examined the relationship between volume at a given point in time and volume that occurred in the past at different stock prices, using CRSP listed 30 stocks with the smallest equity value from December 1981 to January 1985 have been empirically tested for the disposition effect and reached a supportive conclusion. These stocks were selected because small company stocks may show high volatility in yields, and small companies are more likely to be held by taxpayers. Visaltanachoti et al. [5]
used the number of shares outstanding, trading volume, and trading day in the public data of the Chinese stock market to construct a formula for the average annual holding period of stocks testing the disposition effect by examining the relationship between stock holding periods and returns. They found that the two are negatively correlated, indicating that individual investors in A shares have a strong disposition effect. Liu and Chen [6]
impact of disposition effects on asset returns, risks, and volatility. When investors show a trend toward disposition effects, stock returns and volatility decline. Therefore, this paper draws on the research methods of many scholars to study the investment behavior of investors from the trading volume and turnover rate of the stock market.
In addition, the reference point for investors in investment decisions is not fixed, it will change as the psychological account changes. Because investors face very different risk attitudes in the face of profit and loss, changes in reference points will inevitably affect investors' future investment decisions. Frazzini [8] used the data held by US mutual funds to construct a new reference point for stock purchase prices, and found that the disposition effect did not respond sufficiently to news, leading to the predictability of stock returns. Kaustia [9]
found that when the current price and the purchase price of the stock are the same, the stock is most likely to be sold. When the price increases or decreases relative to the purchase price, the willingness to sell the stock decreases. Woo and Pollack [10] found that investors evaluate gains and losses based on the average price of a stock, which is a weighted average of the prices of securities held at the beginning of a purchase. Grinblatt and Keloharju [11]
studied the trading behavior of investors by analyzing the trading data of the Finnish stock market from 1995 to 1996, and found that if the stock has a high positive return recently and the stock price is also in the month High, then the possibility of the stock being sold increases, and as investors' book losses in holding the stock increase, their holding propensity increases.
Numerous literatures have studied the individual investors' reference points from the perspective of individual investors. And if we look at the impact of policies from the perspective of the overall market, we believe that the impact of policy should be on the macro side rather than the micro side, so we use the industry as the benchmark, and according to the industry classification of the CSRC, the industry benefits The average of the rate of return is compared with the average of the full sample rate to define industries with high and low returns. In the whole market, it is categorized into industry effects, and then studies the impact on different industries under policy constraints, while reflecting the bias of investor psychology and behavior.
It can be seen from the above literature that scholars' research results on the reference price of investor gains and losses are different. Since the initial public offering of shares, investors buy at the same price, that is, the issue price, which provides research for convenient. Kaustia
[12] studied the volume of US IPO transactions from 1980 to 1996 and found the existence of disposition effects. However, the issue price is not the reference price of any IPO. If the price is lower than the issue price, investors will face a dilemma because they do not want to face losses immediately, and investors usually use stop loss to avoid this dilemma. When the IPO price is higher than the issue price, the transaction volume increases, and when the market price of the stock is lower than the issue price for the first time, the transaction volume also increases. Brown et al. [13] studied the investment behavior of Australian investors in newly listed stocks and found that
traders with larger investments are often affected by fewer disposition effects, which are in the first two weeks of profit (loss) performance is most obvious, and the "private money" effect can alleviate the disposition effect. Similarly, Szyska and Zielonka [14] studied the volume-price relationship after the IPO and found that when the first trading day is a positive return, the stock turnover rate is higher, and vice versa. Sani et al. [15] studied the profit quality of Malaysian IPO companies as the research object, and examined the impact of the suspension of listing systems and institutional holdings on the EQ behavior of IPO companies. Chien-Feng Huang et al. [16] studied the impact of the differences in fundamentals of listed companies on the performance of stock prices after listing and the disposition effect on the Taiwan market. Scholars study investor's disposition effect from the perspective of IPO, mostly from the perspective of market. This article considers that disposition effect is the stress response of investors after market changes. Therefore, studying the overall market changes is an important factor to grasp the changes in investor decisions. Verify whether there is a disposition effect, because most investors will first pay attention to the broad market gains in the market panel when investing in stocks, and compare and analyze with the previous broad market trends to configure the buying and selling of their own shares.
By understanding the financial market, which includes government-issued policies, investors can understand the impact of financial decisions and appropriately reduce this impact. This requires individual investors to make a conscious decision. The actual market conditions are very different from the ideal market conditions. Reducing the disposition effect may reduce the uneven changes in stock prices and improve the efficiency of the stock market. Although mere knowledge of the effects of disposition cannot completely reduce its impact, it can help reduce potential impacts that may occur in the future. This shows that all investors need to be well coordinated and balanced before investing in any securities. When making investment decisions in the stock market, deliberate consideration can be given to disposition effects. If the changes in the stock market are viewed from a broader perspective, the solution to the behavioral problems can be properly addressed. In the long run, this could have a positive impact. There is also a lot of literature that divides the sample interval according to the time when the policy was proposed when selecting the sample. It can be seen that the proposal of the policy not only has a certain impact on the operation of the market, but investors will also consider the policy factors when making decisions change their investment behavior. The government’s original intention is to prevent new stocks from being speculated and reduce speculation by investors. On the other hand, it also restricts the operation of the stock market. Therefore, its real effects need to be further studied.
of national policies on the market and then affects investor behavior, showing the importance of policies to restrict investor speculation. This article starts with industry classification, and constructs a benchmark from the perspective of the overall market, so as to observe the effectiveness of the policy at a macro level and have a better attribution basis for the disposition effect.
3. Research Design
3.1. Sample Selection and Data Sources
It can be seen from the history of China's new stock issuance that the Securities and Futures Commission suspended the A-share IPO for one year from May 2005 to 2006 to carry out share reform. It also stopped the IPO from November 16, 2012 to December 2013 to examine and approve the reform of the IPO system. So we divided the research sample into two parts, the first part of the time span is from 2006 to 2012, and the second part of the time span is from 2014 to 2018. We obtained the market data of China's stock market through the Wind database. After excluding stocks with severely missing data, there were a total of 2256 stocks listed on the Shanghai and Shenzhen stock markets during the sample period, including the listing date, opening price, closing price, trading volume, total equity, price-earnings ratio, turnover ratio and industry classification; also obtained basic data of related companies from its database, including company age, return on net assets, total asset turnover ratio, asset-liability ratio and total asset growth rate.
The foregoing analysis shows that the characteristics of IPO stocks are that investors have the same purchase price, that is, the issue price, so investors are more concerned about the price change of the stock on the first day. They will compare the stock's performance in the market with their own expectations. The resulting gap will cause their behavioral deviations. So this article first studies the performance of the stocks of listed companies on the first day. However, according to the actual market situation after China's IPO limit increase policy was issued, it can be seen that the new stocks once generally showed a 44% increase on the first day, and began to compete for the number of consecutive daily limits. From 2014 to the end of 2018, A-shares issued a total of 1117 new shares, of which 1064 stocks had daily limit on the first day, the proportion was as high as 95.26%. Previously, from 2012 to 2013, only 33 of the 157 new listed companies rose by more than 44% on the first day, a ratio of only 21.02%. Another 42 listed companies closed on the first day below the issue price, showing a breakthrough phenomenon. It was 26.75%. We believe that the establishment of a daily limit board will directly affect the expectations of investors to new shares, thereby changing the market situation. Some retail investors often consider selling or continuing holding after opening the daily limit board. If the policy can have a good inhibitory effect on new stock speculation, then we will add the research date to the first day to open the daily limit board, that is, to set up a proxy variable for the company's listing date, including the first day of listing and one day after the daily limit, Let's
explore whether the increase limit policy can weaken investors' disposition effect.
3.2. Research Variable Definition and
Measurement
The explained variables in this article are the turnover rate and trading volume. When individual investors make buying and selling decisions, the most direct manifestation in the market is the change in trading volume and turnover rate. Many literatures also find that these two variables can be very good It reflects the investment behavior of investors, so changes in turnover rate and transaction volume can more accurately reflect the psychological and behavioral deviations of investors after the policy.
The explanatory variables are three dummy variables. Since the policy was implemented after 2014, Post2014 stated that the company's listing time was set to 1 after 2014 and 0 before 2014. The disposition effect has two aspects: profit and loss. We set the industry average return rate to be higher than the full sample mean value to 1 and the other to 0 to distinguish high-yield industries from low-yield industries. In addition, taking the general average to exaggerate the impact of small-cap stocks, we have added a weighted average based on the weight of the total market value of the listed company. Therefore, the subsequent models use the dummy variables of weighted average and general average to discuss together to consider the possible heterogeneity in the disposition effect of large-cap stock investors and small-cap stock investors. Similarly, we set the company's industry weighted rate of return to be higher than the full sample average of 1, otherwise it is 0. Elena Ranguelova [17]
analyzed the daily transaction records of 78,000 customers of a brokerage company for more than 6 years and found that the relationship between the company's size and the disposition effect was monotonous. Disposition effects are mainly concentrated in large stocks, and stocks of small-scale companies with a market value below 40% show anti-disposal effects, that is, investors hold their winners and realize their losers. It can be seen that the size of the company will have an impact on investor behavior.
3.3. Descriptive Statistics
We have processed the transaction volume and total equity data. On the one hand, the data is converted into units of 100 million shares in order to ensure the dimension of the coefficients. On the other hand, the result is a natural logarithm of the source data. From Table 1, it can be seen that, considering the weighting, the industry with a weighted average greater than the overall reached 93%, and among the results that are generally worth, only 22% higher than the average, in other words, the two may have behavioral heterogeneity, this can be reflected in the later results. In other respects, Post2014 showed that the number of listed companies around 2014 was basically the same, and the average number of listed companies increased slightly after 2014 years.
The setting of high mean in this article refers to "industries higher than the full sample mean", not
individual enterprises. When designing the model, it is also more inclined to consider industry effects rather than the impact of individual companies, so 1 and 0 above the mean variable are for all industries. The industries with a high general average and the industries with a high weighted average are shown in Table 2 and Table 3, respectively. It can be seen that the industries with a high general average also belong to the industries with a high weighted average. Since the weighted average increases the impact of large-cap stocks, it is like industries with large capital investment and large-scale companies, such as the transportation industry and the construction industry, appear in industries with a high weighted average. We believe that these industries with a high general average or weighted average will be more susceptible to policy influences, which will cause changes in investors' investment strategies and weaken the irrational behavior of disposition effects.
Table 1. Descriptive Statistics (T=2006-2018, NT=2256)
Variable Mean Standard Deviation Minimun Maximun
Turnover 35.956 37.480 0.004 95.920
Deal 0.301 1.868 -7.282 41.732
Ldeal -0.315 8.098 -11.596 12.942
Post2014 0.495 0.500 0 1
Abovemean 0.226 0.418 0 1
Wabovemean 0.926 0.261 0 1
Total 115.265 1831.098 0.00004 80456.020
Ltotal 6.794 6.325 -0.916 20.506
Age 12.820 5.687 0 56
PE 33.694 21.677 6.080 556.250
TAT 1.019 0.548 0.022 5.405
ROE 26.381 12.704 1.524 117.876
DAR 45.166 18.037 1.779 98.203
TAGR 26.927 34.821 -41.472 510.379
Table 2. Industries with high general averages and distribution
Industry Firm Percentage Cumulative Percentage
Information Transmission, Software and Information Technology Services 257 50.49 50.49
Agriculture, forestry, animal husbandry and fishery 19 3.73 54.22
Real estate 13 2.55 56.78
Culture, sports and entertainment 48 9.43 66.21
Production and supply of electricity, gas and water 28 5.50 71.71
Social services 105 20.63 92.34
Miscellaneous 4 0.79 93.12
mining industry 35 6.88 100.00
Total 509 100.00
Table 3. Industries with high weighted averages and distribution
Industry Firm Percentage Cumulative Percentage
Transportation and warehousing 21 1.00 1.00
Information Transmission, Software and Information Technology Services 257 12.30 13.30
Agriculture, forestry, animal husbandry and fishery 19 0.91 14.21
Manufacturing 1,511 72.30 86.51
Building 64 3.06 89.57
Real estate 13 0.62 90.19
Culture, sports and entertainment 48 2.30 92.49
Production and supply of electricity, gas and water 13 0.62 93.11
Social services 105 5.02 98.13
Miscellaneous 4 0.19 98.33
Mining industry 35 1.67 100.00
Table 4. Correlation Analysis Table
Turnover Deal Ldeal Post2014 Abovemean Wabovemean
Turnover 1.0000
Deal 0.1305*** 1.0000
Ldeal 0.9313*** 0.2075*** 1.0000
Post2014 -0.9306*** -0.1569*** -0.9866*** 1.0000
Abovemean 0.1250*** -0.0001 0.1040*** -0.1060*** 1.0000
Wabovemean 0.0858*** -0.1313*** 0.0361* -0.0757*** 0.0907*** 1.0000
Total 0.0318 0.3871*** 0.0828*** -0.0599*** 0.0367* -0.0581***
Ltotal 0.9153*** 0.2172*** 0.9901*** -0.9871*** 0.1040*** 0.0163
Age -0.3519*** -0.0790*** -0.3652*** 0.3643*** -0.0933*** -0.0658***
PE 0.4628*** 0.0122 0.4859*** -0.5003*** 0.1058*** 0.0645***
TAT 0.1639*** -0.0763*** 0.1661*** -0.1838*** -0.0874*** -0.0426**
ROE 0.3247*** -0.0137 0.3416*** -0.3630*** 0.0331 0.1175***
DAR 0.1484*** 0.1896*** 0.2105*** -0.1614*** -0.0657*** -0.2879***
TAGR 0.1957*** -0.0008 0.2041*** -0.2163*** 0.0504** 0.0222
Note: *P<0.1, **P<0.05, ***P<0.01.
3.4. Correlation Analysis and Variables
In order to better measure the closeness of the correlation between the variables, we listed the Pearson correlation analysis in Table 4. Due to the limited space, the variables in the horizontal row only list the independent and dependent variables. We mainly look at the first three columns. The first is the relationship between the dependent variables. It can be seen that there is a strong correlation between the turnover rate and the transaction volume and the logarithm of the transaction volume. In other words, the increase in the turnover rate corresponds to the increase in the percentage of the transaction volume, which is intuitive. In contrast, the correlation between the absolute value of the transaction volume and the logarithmic value is relatively poor.
Then there is the relationship of the three independent variables to the dependent variable. First of all, after looking at 2014, we can see that the turnover rate and trading volume and its logarithm have a strong or even linear correlation with the year, which means that the trading volume and turnover rate have decreased significantly after 2014. For high ordinary averages, it can be seen that the correlation between the absolute value of the transaction volume is very poor, and the other two have correlations, but the correlation coefficient is not high. The weighted mean is the same, the correlation is not high, but it shows heterogeneity-you can see that the correlation to the turnover rate is positive, and the correlation to the transaction volume is negative. Looking at total equity again, we can see that the relationship between total equity and the three independent variables is basically positive, while the turnover rate and the absolute value of total equity have no correlation. The total equity logarithm shows a high positive correlation with the turnover rate and transaction volume, while the company age has a negative correlation. On the contrary, the P/E ratio shows a significant positive correlation, which may be because the lower the multiplier, the higher the value, and the greater the tendency to change hands and trade.
Looking at some variables related to the fundamentals, the return on net assets has a positive effect on the turnover rate and the logarithm of transaction volume,
while the total asset turnover rate and corporate growth rate have similar effects. In contrast, the leverage ratio, that is, the total asset-liability ratio, is positively related to the three explained variables. Most of the related analyses are intuitive. The leverage effect will bring about a stronger capital market circulation, and the increase in profit will cause a certain degree of disposition effect, leading to an increase in turnover and transaction volume, and total asset turnover rate has a similar effect.
3.5. Empirical Model
First, we explored the impact of policies on the market after 2014 in terms of turnover rates, which affected investor disposition effects, and examined the relationship between investor behavior and industries with higher than average returns. This article also adds the interaction terms of post-2014 dummy variables and dummy variables above the mean in the model, where the explanatory variables are the high general mean and the high weighted mean, respectively. The specific model is as follows,
1 2
3
2014 2014
i i i i
i i i
Turnover Post Abovemean
Post Abovemean Z
α β β
β γ ε
= + +
+ ∗ + + (1)
1 2
3
2014
2014 .
i i i i
i i i
Turnover Post Wabovemean
Post Wabovemean Z
α β β
β γ ε
= + +
+ ∗ + + (2)
Second, we tested the effects of policies on industry effects from the perspective of transaction volume, and then the effects of investor disposition effect. The study of each dependent variable includes high general mean and high weighted mean, the specific models are as follows:
1 2
3
2014 2014
i i i i
i i i
Deal Post Abovemean
Post Abovemean Z
α β β
β γ ε
= + +
+ ∗ + + (3)
1 2
3
2014 2014
i i i i
i i i
Deal Post Wabovemean
Post Wabovemean Z
α β β
β γ ε
= + +
+ ∗ + + (4)
4. Empirical Test and Result Analysis
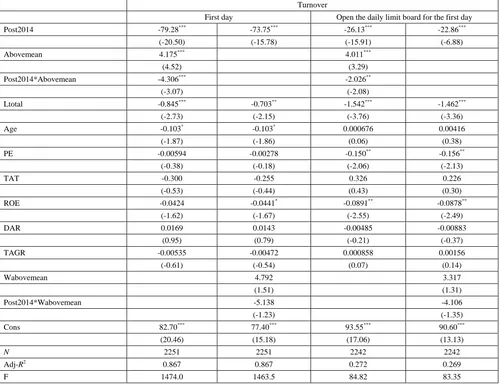
First of all, Table 5 reports the results of the turnover rate. It can be seen that in terms of the original item effect, the stock turnover rate after 2014 has been significantly reduced. This is due to policy restrictions, which has affected the IPO underpricing rate and caused a downturn in the market atmosphere and a decline in turnover. Industries with high general averages and high weighted averages have high turnover rates. Investors are interested in high-yielding stocks and have frequent transactions. This is intuitive. The main point is that the interaction term of the average is significantly negative. Whether it is the first day or the first day of opening the daily limit board, it means that the stocks listed after 2014 have higher returns in the industry where they are more affected by the policy. The investment behavior of small-cap stock investors has reduced the turnover rate. This shows that high-return industries will be more constrained by policies. Before the policy was implemented, investors invested in high-yield stocks and were more inclined to sell rather than continue to hold when they made a profit. There was a certain degree of disposition effect. In order to curb this speculative behavior of investors, the increase limit has reduced the turnover rate of stocks in high-return industries, thereby weakening the disposition effect of investors.
Looking at the interaction term of the high weighted mean, the regression results of the two dates are negative but not significant, which indicates that the policy has no significant effect on investors with large-cap stocks as the main investment. Large-cap stock investors still have a greater possibility of irrational behavior. At the same time, it can be seen that the R2 of the two is quite different, indicating that the goodness of fit is different. It may be because the leading factors in the past few days are different. With the relevant policies, the effect of speculation has been reduced. No forecasting work is done, so the impact is small. In general, the policy of limiting the increase to a certain extent has restrained the disposition effect of investors mainly investing in small-cap stocks.
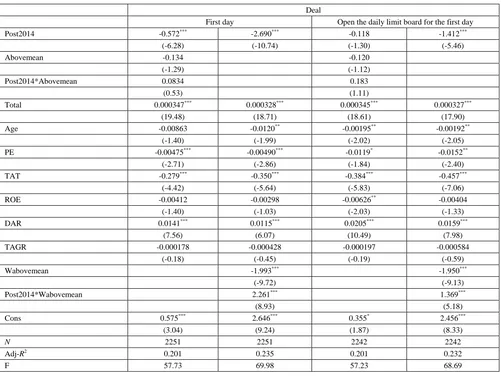
We replaced the explanatory variable in the original model with the trading volume, which was divided into the trading volume on the first day and the trading volume on the first day when the daily limit board was opened. The regression results are shown in Table 6. You can see that the interaction terms of the high average means are not significant, and the interaction terms for the high weighted means are significantly positive, and for large-cap stock investors, investors with high investment returns have a high trading volume, showing a certain degree of disposition effect, indicating that the policy cannot well restrain irrational behavior of stock investors in the broad market.
Table 5. Regression Results of Turnover
Turnover
First day Open the daily limit board for the first day
Post2014 -79.28*** -73.75*** -26.13*** -22.86***
(-20.50) (-15.78) (-15.91) (-6.88)
Abovemean 4.175*** 4.011***
(4.52) (3.29)
Post2014*Abovemean -4.306*** -2.026**
(-3.07) (-2.08)
Ltotal -0.845*** -0.703** -1.542*** -1.462***
(-2.73) (-2.15) (-3.76) (-3.36)
Age -0.103* -0.103* 0.000676 0.00416
(-1.87) (-1.86) (0.06) (0.38)
PE -0.00594 -0.00278 -0.150** -0.156**
(-0.38) (-0.18) (-2.06) (-2.13)
TAT -0.300 -0.255 0.326 0.226
(-0.53) (-0.44) (0.43) (0.30)
ROE -0.0424 -0.0441* -0.0891** -0.0878**
(-1.62) (-1.67) (-2.55) (-2.49)
DAR 0.0169 0.0143 -0.00485 -0.00883
(0.95) (0.79) (-0.21) (-0.37)
TAGR -0.00535 -0.00472 0.000858 0.00156
(-0.61) (-0.54) (0.07) (0.14)
Wabovemean 4.792 3.317
(1.51) (1.31)
Post2014*Wabovemean -5.138 -4.106
(-1.23) (-1.35)
Cons 82.70*** 77.40*** 93.55*** 90.60***
(20.46) (15.18) (17.06) (13.13)
N 2251 2251 2242 2242
Adj-R2 0.867 0.867 0.272 0.269
F 1474.0 1463.5 84.82 83.35
Table 6. Regression Results of Trading Volume
Deal
First day Open the daily limit board for the first day
Post2014 -0.572*** -2.690*** -0.118 -1.412***
(-6.28) (-10.74) (-1.30) (-5.46)
Abovemean -0.134 -0.120
(-1.29) (-1.12)
Post2014*Abovemean 0.0834 0.183
(0.53) (1.11)
Total 0.000347*** 0.000328*** 0.000345*** 0.000327***
(19.48) (18.71) (18.61) (17.90)
Age -0.00863 -0.0120** -0.00195** -0.00192**
(-1.40) (-1.99) (-2.02) (-2.05)
PE -0.00475*** -0.00490*** -0.0119* -0.0152**
(-2.71) (-2.86) (-1.84) (-2.40)
TAT -0.279*** -0.350*** -0.384*** -0.457***
(-4.42) (-5.64) (-5.83) (-7.06)
ROE -0.00412 -0.00298 -0.00626** -0.00404
(-1.40) (-1.03) (-2.03) (-1.33)
DAR 0.0141*** 0.0115*** 0.0205*** 0.0159***
(7.56) (6.07) (10.49) (7.98)
TAGR -0.000178 -0.000428 -0.000197 -0.000584
(-0.18) (-0.45) (-0.19) (-0.59)
Wabovemean -1.993*** -1.950***
(-9.72) (-9.13)
Post2014*Wabovemean 2.261*** 1.369***
(8.93) (5.18)
Cons 0.575*** 2.646*** 0.355* 2.456***
(3.04) (9.24) (1.87) (8.33)
N 2251 2251 2242 2242
Adj-R2 0.201 0.235 0.201 0.232
F 57.73 69.98 57.23 68.69
Note: The values in brackets are t. *,**,and *** are significant at the levels of 10%,5%,and 1%, respectively.
After comparing the two models, it is found that, compared with small-cap stock investors, large-cap stock investors have weaker decision-making in terms of turnover rate, while trading volume-related decisions are stronger, and small-cap stock investors are the opposite. The increase limit policy has a restraining effect on the disposition effect of small-cap stock investors in the short-term IPO, while investors with large-cap stocks show a certain degree of disposition effect, and speculation is more serious. To sum up, investors of two different investment styles have different concerns in their respective investment fields, so policies have different effects on their investment behavior.
5. Conclusion
This article uses market transaction data on the first day and the first day of opening the daily limit board of IPO company stocks around 2014. Based on the industry's average rate of return, it is observed whether the industry with a high rate of return is affected by the first-day limit increase policy, and then reflects on investors behavior, in the end, we want to know whether this policy can affect the disposition effect of investors. The empirical test results show that the 44% increase limit policy on the first day of the IPO can well suppress the disposition effect of investors with small-cap stocks as the mainstay. They
industry financial characteristics, and investors investing in these industries, whether their speculative behaviors and disposal effects have an impact on their own returns and the returns of the company or industry and worth exploring.
Because this article only selects the two initial dates of the IPO company's listing, it is impossible to know the long-term effect of the increase limit policy on the company or investors. Regarding the effect of investor disposition effect, there are two aspects of selling profit and holding loss, but this article only discusses one aspect, which cannot be compared well. On the whole, restricting the increase of the first day of listing of new shares has well regulated the behavior of investors, reduced speculation to a certain extent, is conducive to the healthy operation of the A-share market, and has improved the overall quality of investors.
Acknowledgements
We gratefully acknowledge the support of the National Social Science Foundation of China (grant number 15BJY164).
References
[1] Shefrin H, Statman M. The disposition to sell winners too early and ride losers too long: Theory and evidence. Journal of Finance, 1985, (40), 777-791.
[2] Kahanneman D, Tversky A. Prospect theory: an analysis of decision under risk. Econometrica, 1979, 46 (2): 171-185.
[3] Odean T. Are investors reluctant to realize their losses. Journal of Finance, 1998, 53(5): 1755-1798.
[4] Ferris, Stephen, Robert H and Anil M. Predicting contemporary volume with historic volume at differential price levels: Evidence supporting the disposition effect. Journal of Finance. 1988, 43.
[5] Visaltanachoti N, Luo H. Holding periods, illiquidity and disposition effect in the Chinese stock markets. Applied Financial Economics, 2007, (17): 1265 -1274.
[6] Duan L, Shou C. Disposition Effects and Investor Overconfidence: Evidence from Trading Volume in China Stock Market. International Conference on Wireless Communications. 2008.
[7] Goetzmann, W.N. and Massa, M. Disposition matters: volume, volatility, and price impact of a behavioral bias. The Journal of Trading, 2008, Vol. 3 No. 2, pp. 68-90.
[8] Frazzini A. The Disposition Effect and Under -Reaction to News. Working Paper, Yale International Centre of Finance No. 04-24, 2005.
[9] Kaustia, M. Prospect theory and the disposition effect. Journal of Financial and Quantitative Analysis, 2010, Vol. 45 No. 3, pp. 791-812.
[10] Woo, J. and Pollack, I, Economic and statistical significance of disposition effect and momentum in the US stock market, Working Paper, pp. 1-28, 2014.
[11] Grinblatt M, Keloharju M. What Makes Investors Trade? Journal of Finance, 2000, 55(5): 2017-2069.
[12] Kaustia M. Market-wide impact of the disposition effect: evidence from IPO trading volume. Journal of Financial Markets, 2004, Vol. 7 No. 2, pp. 207-235.
[13] Brown P, Chapple N and Rosa R. The reach of the disposition effect: Large sample evidence across investor classes. International Review of Finance, 2006, (6): 1-2. 43-78.
[14] Szyszka A, Zielonka P. The disposition effect demonstrated on IPO trading volume [R]. Working Paper, Poznan University of Economics. 2007.
[15] Sani H, Bany A, Hairul S and Siti Z. Earning Quality of Malaysian IPO firms: The Effect of Share Moratorium Provision and Institutional Ownership. Procedia Economics and Finance, 2016, 35: 107-116.
[16] Chien-Feng Huang, Chih-Hsiang Chang, Li-Min Kuoa, Tsung-Nan Hsieha. The disposition effect, price performance and fundamentals of IPOs: Evidence from Taiwan. Investment Analysts Journal, 2017.
[17] Elena Ranguelova. Disposition Effect and Firm Size: New Evidence on Individual Investor Trading Activity. Working Paper, Harvard University, 2001.