Global dyssynchrony correlates with
compromised left ventricular filling and stroke
volume but not with ejection fraction or QRS
duration in HFpEF
pranvera Ibrahimi Md
1,2, gani Bajraktari Md, phd
1,2, Ibadete Bytyçi Md
1, Artan Ahmeti Md
1,
Arlind Batalli Md
1, Haki Jashari Md
2, shpend elezi Md, phd
1,
Michael y. Henein Md, phd
21 Clinic of Cardiology and Angiology, University Clinical Centre of Kosova, Pishtinë, Republic of Kosovo 2 Department of Public Health and Clinical Medicine, Umeå University and Heart Centre, Umeå, Sweden
Introduction
Heart failure (HF) remains a major public health hazard worldwide, with its increasing incidence1, 2. It has now been
established that almost 50% of HF patients present with typical signs and symptoms but preserved left ventricular (lV) ejection fraction (eF) (HFpeF)3. Furthermore, HFpeF has been
shown to share similar mortality to that of HFreF4 urging the
need for serious identification of stringent treatment polices. Randomized clinical trials have succeeded in establishing the important role of pharmacological treatment of HF with reduced eF, but they failed to do so in patients with HFpeF5-7 suggesting
the lack of clear understanding of the pathophysiology of the syndrome as well as various mechanisms for symptom development. likewise, cardiac resynchronization therapy (CRt) has proved successful in improving HFreF patient’s symptoms and survival8-10, particularly in those with clear evidence for
electrical and mechanical dyssynchrony. However, respective management in HFpeF has not been proved significantly effective. Furthermore, markers of global lV dyssynchrony e.g. tei index and total isovolumic time (t-IVt) have previously
been shown sensitive in identifying HFreF patients likely to benefit from CRt11-15, but have not been studied in HFpeF. the
aim of this study therefore was to assess the role of global lV dyssynchrony in explaining symptoms in HFpeF which might guide to better treatment strategy.
Methods
Study population
we studied 55 symptomatic HFpeF patients (age 60±9 years, NyHA class II-IV; lV eF ≥45%) and 24 age and gender matched controls. patients were referred to the Clinic of Cardiology, university Clinical Centre of Kosovo, between January 2009 and April 2011. At the time of the study all patients were on optimum cardiac medications, optimized at least 2 weeks prior to enrollment, based on patient’s symptoms and renal function: 78% were receiving ACe inhibitors or ARB, 64% ß-blockers and 36% spironolactone. patients with more than mild mitral regurgitation, more than mild renal failure, chronic obstructive pulmonary disease (Copd) or those with recent acute coronary
Abstract
Background and Aim: Mechanical global left ventricular (lV) dyssynchrony reflected as prolonged total isovolumic time (t-IVt) has been introduced as a potential mechanism behind compromised stroke volume in heart failure (HF). It has also been shown to be superior to other markers of dyssynchrony in predicting response to cardiac resynchronization therapy (CRt), but its application in HF with preserved ejection fraction (HFpeF) remains unknown. the aim of this study was to assess the role of t-IVt in explaining symptoms in HFpeF.
Methods: In 55 symptomatic HFpeF patients (age 60±9 years, NyHA class II-IV; lV eF ≥45%) and 24 age and gender matched controls, a complete doppler echocardiographic study was performed including mitral annulus peak systolic excursion (MApse) and myocardial velocities as well as lV filling, outflow tract velocity time integral (VtI) and stroke volume measurements. global lV dyssynchrony was assessed by t-IVt [in s/min; calculated as: 60 - (total ejection time + total filling time)], tei index (t-IVt/ejection time) and pre-ejection time difference between lV and RV.
Results: patients had reduced lateral and septal MApse (p=0.009 and p=0.01, respectively) lower lateral and septal s’ (p=0.002 and p=0.04, respectively) and e’ (p<0.001, for both) velocities and higher e/e’ ratio (p=0.01) compared to controls. they also had longer t-IVt (p<0.001), higher tei index (p=0.04), but similar pre-ejection time difference and lVeF to controls. t-IVt correlated with lV filling time (r=0.44, p<0.001), stroke volume (r=-0.41; p=0.002), MApse (lateral: r=-0.36, p=0.007 and septal: r=-0.31; p=0.02), but not with lV mass index, lVeF, e/e’ ratio or QRs duration.
Conclusion: patients with HFpeF have exaggerated global mechanical dyssynchrony shown by prolonged t-IVt, compared with healthy age and gender matched controls. the relationship between t-IVt, lV filling and stroke volume suggests an association, more important than with ejection fraction or electrical dyssynchrony. these results support the importance of the individualistic approach for optimum HFpeF patient management.
syndrome, stroke or anemia were excluded. patients gave a written informed consent to participate in the study, which was approved by the local ethics Committee.
Data collection
detailed history and clinical assessment were obtained in all patients, in whom routine biochemical tests were also performed including hemoglobin, lipid profile, blood glucose level, and kidney function tests. estimated body mass index (BMI) was calculated from weight and height measurements. waist-hip measurements were also made and waist/hip ratio calculated.
Echocardiographic examination
A single operator performed all echocardiographic examinations using a philips Intelligent e-33 system with a multi-frequency transducer, and harmonic imaging as appropriate. Images were obtained with the patient in the left lateral decubitus position and during quiet expiration. end-systolic and end-diastolic lV dimensions were made from the left parasternal long axis view with the M-mode cursor positioned by the tips of the mitral valve leaflets. lV volumes and eF were calculated from the apical 2 and 4 chamber views using the modified simpson’s method. Ventricular long axis motion was studied by placing the M-mode cursor at the lateral and septal angles of the mitral ring and the lateral angle of the tricuspid ring. total amplitude of mitral and tricuspid annulus peak systolic excursion (MApse and tApse) was measured as previously described16 from peak
inward to peak outward points. lV and right ventricular (RV) long axis myocardial velocities were also studied using doppler myocardial imaging technique, from the apical 4-chamber view. longitudinal velocities were recorded with the sample volume placed at the basal part of lV lateral and septal segments as well as RV free wall. systolic (s’) and early (e’) diastolic myocardial velocities were measured with the gain optimally adjusted, and the mean value of the two was calculated. left atrial diameter was measured from the aortic root recordings with the M-mode cursor positioned at the level of the aortic valve leaflets.
diastolic function of the lV and RV was assessed from filling velocities using spectral pulsed wave doppler technique with the sample volume positioned at the tips of the mitral and tricuspid valve leaflets, respectively, during a brief apnea. peak lV and RV early (e wave), and late (A wave) diastolic velocities were measured and e/A ratios were calculated. the e/e’ ratio was calculated from the transmitral e wave and the mean lateral and septal segments e’ velocities. the isovolumic relaxation time was also measured from aortic valve closure to mitral valve opening, on the pulsed wave doppler recording. lV filling pattern was considered ‘restrictive’ when e/A ratio was >2.0, e wave deceleration time < 140 ms and the left atrium dilated of more than 40 mm in transverse diameter17.
stroke volume (sV) was calculated as the difference between the end-diastolic volume and end-systolic volume. Cardiac output (Co) was calculated by multiplying the sV by heart rate per minute. the cardiac index (CI) was obtained by dividing the Co by the body surface area.
Measurements of LV dyssynchrony
Indirect assessment of lV dyssynchrony was obtained by measuring total isovolumic time (t-IVt), tei Index and lV-RV pre-ejection time delay. total lV filling time was measured from the onset of the e wave to the end of the A wave and
ejection time from the onset to the end of the aortic doppler flow velocity. total isovolumic time (t-IVt) was calculated as 60 - (total ejection time + total filling time) and was expressed in s/ min18. tei index was calculated as the ratio between t-IVt and
ejection time19. lV and RV pre-ejection times were measured as
the time interval between the onset of the q wave and the onset of the aortic and pulmonary forward flow velocities, respectively and the time delay between the two was calculated19.
Mitral regurgitation severity was assessed by colour and continuous wave doppler and was graded as mild, moderate, or severe according to the relative jet area to that of the left atrium as well as the flow velocity profile, in line with the recommendations of the American society of echocardiography20. likewise, tricuspid regurgitation was
assessed by color doppler and continuous-wave doppler. Retrograde trans-tricuspid pressure drop > 35 mmHg was taken as an evidence for pulmonary hypertension 21. All M-mode
and doppler recordings were made at a fast speed of 100 mm/s with a superimposed eCg (lead II).
Statistical analysis
data is presented as mean ± sd or proportions (% of patients). Continuous data was compared using two-tailed unpaired student’s t test and discrete data with Chi-square test. Correlations were tested with pearson coefficients.
Results
Clinical and biochemical data in patients and controls
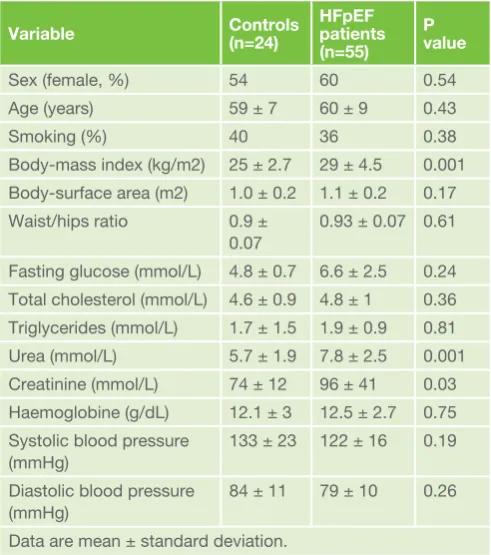
patients did not differ from controls in age, gender or other clinical or biochemical data, except kidney function (patients had higher blood urea and creatinine levels, p=0.001 and p=0.03, respectively) and higher body-mass index (p=0.001, table 1).
Table 1. Comparison of clinical and biochemical data between patient’s groups
Variable Controls(n=24) HFpEF patients (n=55)
P value
sex (female, %) 54 60 0.54
Age (years) 59 ± 7 60 ± 9 0.43
smoking (%) 40 36 0.38
Body-mass index (kg/m2) 25 ± 2.7 29 ± 4.5 0.001 Body-surface area (m2) 1.0 ± 0.2 1.1 ± 0.2 0.17 waist/hips ratio 0.9 ±
0.07
0.93 ± 0.07 0.61
Fasting glucose (mmol/l) 4.8 ± 0.7 6.6 ± 2.5 0.24 total cholesterol (mmol/l) 4.6 ± 0.9 4.8 ± 1 0.36 triglycerides (mmol/l) 1.7 ± 1.5 1.9 ± 0.9 0.81 urea (mmol/l) 5.7 ± 1.9 7.8 ± 2.5 0.001 Creatinine (mmol/l) 74 ± 12 96 ± 41 0.03 Haemoglobine (g/dl) 12.1 ± 3 12.5 ± 2.7 0.75 systolic blood pressure
(mmHg)
133 ± 23 122 ± 16 0.19
diastolic blood pressure (mmHg)
84 ± 11 79 ± 10 0.26
Echocardiographic data in patients and controls
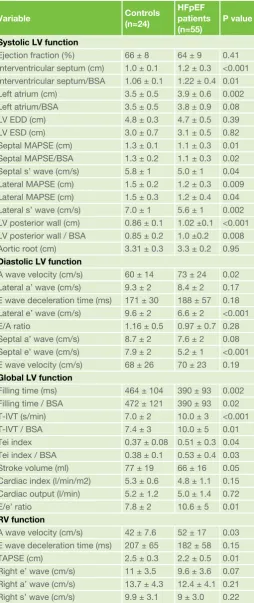
patients had thicker lV walls (p<0.001, for both interventricular septum and posterior wall) and larger left atrium (p=0.002), compared with controls, but the lV dimensions and global function (eF) did not differ between groups (table 2, Figure 1). However, patients had compromised long axis systolic function: lower lateral and septal MApse (p=0.009 and p=0.02, respectively), and lower lateral and septal s’ (p=0.002 and p=0.04, respectively), as well as e/e’ ratio (p=0.01). patients had also disturbed lV diastolic function: lower lateral and septal e’ (p<0.001, for both), and increased A velocity (p=0.02), compared with controls. patients had shorter lV filling time (p=0.002) compared to controls. the lV dyssnchrony indices, showed prolonged t-IVt and high tei index in patients compared with controls (p<0.001 and p=0.04, respectively, table 2, Figure 2). the rest of the doppler echocardiographic indices did not differ between patients and controls. From right ventricular echocardiographic indices, only tApse was reduced (p=0.01) and A velocity was increased (p=0.03) in patients compared with controls (table 2). we corrected all significant differences to body-surface area, but this did not show any additional differences. patient’s QRs duration was significantly broader than controls, 95±24ms vs. 83±11ms, p=0.03.
Correlation of t-IVT with electrical and and
echocardiography indices in patients
t-IVt correlated with MApse (lateral: r=-0.36, p=0.007 and septal: r=-0.31; p=0.02), lV filling time (r=0.44; p<0.001,
Table 2. Comparison of echocardiographic data between patient’s groups
Variable Controls(n=24)
HFpEF patients (n=55)
P value
Systolic LV function
ejection fraction (%) 66 ± 8 64 ± 9 0.41 Interventricular septum (cm) 1.0 ± 0.1 1.2 ± 0.3 <0.001 Interventricular septum/BsA 1.06 ± 0.1 1.22 ± 0.4 0.01 left atrium (cm) 3.5 ± 0.5 3.9 ± 0.6 0.002 left atrium/BsA 3.5 ± 0.5 3.8 ± 0.9 0.08
lV edd (cm) 4.8 ± 0.3 4.7 ± 0.5 0.39
lV esd (cm) 3.0 ± 0.7 3.1 ± 0.5 0.82
septal MApse (cm) 1.3 ± 0.1 1.1 ± 0.3 0.01 septal MApse/BsA 1.3 ± 0.2 1.1 ± 0.3 0.02 septal s’ wave (cm/s) 5.8 ± 1 5.0 ± 1 0.04 lateral MApse (cm) 1.5 ± 0.2 1.2 ± 0.3 0.009 lateral MApse (cm) 1.5 ± 0.3 1.2 ± 0.4 0.04 lateral s’ wave (cm/s) 7.0 ± 1 5.6 ± 1 0.002 lV posterior wall (cm) 0.86 ± 0.1 1.02 ±0.1 <0.001 lV posterior wall / BsA 0.85 ± 0.2 1.0 ±0.2 0.008 Aortic root (cm) 3.31 ± 0.3 3.3 ± 0.2 0.95
Diastolic LV function
A wave velocity (cm/s) 60 ± 14 73 ± 24 0.02 lateral a’ wave (cm/s) 9.3 ± 2 8.4 ± 2 0.17 e wave deceleration time (ms) 171 ± 30 188 ± 57 0.18 lateral e’ wave (cm/s) 9.6 ± 2 6.6 ± 2 <0.001
e/A ratio 1.16 ± 0.5 0.97 ± 0.7 0.28
septal a’ wave (cm/s) 8.7 ± 2 7.6 ± 2 0.08 septal e’ wave (cm/s) 7.9 ± 2 5.2 ± 1 <0.001 e wave velocity (cm/s) 68 ± 26 70 ± 23 0.19
Global LV function
Filling time (ms) 464 ± 104 390 ± 93 0.002 Filling time / BsA 472 ± 121 390 ± 93 0.02 t-IVt (s/min) 7.0 ± 2 10.0 ± 3 <0.001
t-IVt / BsA 7.4 ± 3 10.0 ± 5 0.01
tei index 0.37 ± 0.08 0.51 ± 0.3 0.04
tei index / BsA 0.38 ± 0.1 0.53 ± 0.4 0.03 stroke volume (ml) 77 ± 19 66 ± 16 0.05 Cardiac index (l/min/m2) 5.3 ± 0.6 4.8 ± 1.1 0.15 Cardiac output (l/min) 5.2 ± 1.2 5.0 ± 1.4 0.72
e/e’ ratio 7.8 ± 2 10.6 ± 5 0.01
RV function
A wave velocity (cm/s) 42 ± 7.6 52 ± 17 0.03 e wave deceleration time (ms) 207 ± 65 182 ± 58 0.15
tApse (cm) 2.5 ± 0.3 2.2 ± 0.5 0.01
Right e’ wave (cm/s) 11 ± 3.5 9.6 ± 3.6 0.07 Right a’ wave (cm/s) 13.7 ± 4.3 12.4 ± 4.1 0.21 Right s’ wave (cm/s) 9.9 ± 3.1 9 ± 3.0 0.22
lV: left ventricle; RV: right ventricle; A: atrial diastolic velocity; e: early diastolic filling velocity; edd: end-diastolic dimension; esd: end-systolic dimension; t-IVt: total isovolumic time; IVRt: isovolumic relaxation time; s’: systolic myocardial velocity; e’: early diastolic myocardial velocity; a’: late diastolic myocardial velocity; MApse: mitral annulus peak systolic excursion; tApse: tricuspid annulus peak systolic excursion; BsA: body-surface area.
Figure 1. Comparison of left ventricular (lV) ejection fraction (eF) between controls and patients
Figure 2. Comparison of total isovolumic time (t-IVt) between controls and patients
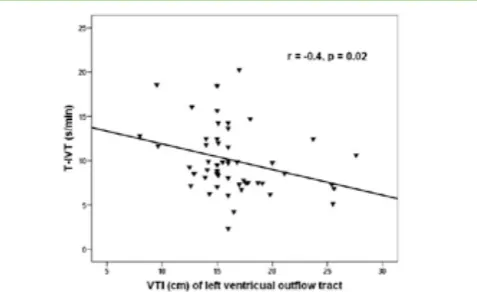
Fig.3), VtI (r=-0.4; p=0.02, Fig.4), and stroke volume (r=-0.41; p=0.002, Fig.5) as well as lA diameter (r=0.298, p=0.03). In contrast, t-IVt did not correlate with lV mass index, cavity dimensions, eF, e/e’ ratio, cardiac output or QRs duration. Nineteen patients had t-IVt > 11.5 s/m (upper normal 95% CI) and 17 had QRs duration >135 ms. ten patients had both abnormalities.
Discussion
Findings: our findings show that in a group of patients with HFpeF, cardiac structure differences with respect to healthy age and gender matched controls were minimal, mainly in the form of myocardial hypertrophy and left atrial enlargement. Cardiac function differences however, were significant with MApse and myocardial s’ wave globally reduced. Also, diastolic function was disturbed with e’ wave globally reduced and e/e’ raised. In addition, markers of global dyssynchrony were significantly abnormal with t-IVt prolonged and tei index raised. t-IVt correlated with MApse, lV filling time and stroke volume and lA diameter. Finally, stroke volume was significantly compromised in the patient’s group compared to controls.
Data interpretation: despite preserved lV ejection fraction our findings show that global subendocardial function in the form of MApse amplitude and velocities was significantly reduced in HFpeF. In addition, there was a mixed pattern of lV filling which suggests modest rise of lA pressure, supported by the lA enlargement and raised e/e’, as well as consistent dyssynchrony manifested by the prolonged t-IVt and high tei index. lV dyssynchrony was not an independent finding but its correlation with lV function parameters, in particular filling time and stoke volume suggests a significant role in compromising both of them. we reserve commenting on the statistical strong relationship between t-IVt and tei index, we found, since the former is a component of the latter.
total isovolumic time reflects the sum of the isovolumic contraction time and isovolumic relaxation time, therefore is considered as a wasted phase in the cardiac cycle when the lV is neither filling nor ejecting. It has been previously shown to correlate with changes in QRs duration22, to predict exercise
capacity23, 24 and mortality in HFreF25. In addition, the longer
t-IVt has been proved as the best predictor of satisfactory clinical response to CRt management of HF11-15. In the current
study, t-IVt did not correlate with QRs duration, but its
relationship with function parameters i.e. compromised lV filling and stroke volume provide a clear explanation for patients’ exertional breathlessness. Compromised lV filling results in suboptimal lA emptying which raises filling pressures, shown by e/e’ and increased lA volume, and consequently causes pulmonary venous hypertension and symptoms. the modest inverse relationship between t-IVt and MApse suggests a potential compensatory mechanism in order to maintain lV stroke volume, and hence a vicious circle of symptoms.
Clinical implications: our findings demonstrate different mechanism for patient’s breathlessness other than delayed depolarization causing dyssynchrony as is the case in HFreF. the modest correlations between t-IVt and filling and stroke volume suggest an intrinsic myocardial dysfunction, even in individual patients, compromising left atrial emptying and consequently stroke volume. the difficulty remains as how
Table 3. Correlations of t-IVt with other echocardiographic parameters
Variable R P value
left atrial diameter 0.298 0.03
lV filling time -0.435 <0.001
lV outflow tract VtI -0.404 0.02
stroke volume -0.41 0.002
left pre-ejection interval 0.529 0.001 pre-ejection time difference -0.417 0.01
lateral MApse -0.358 0.007
septal MApse -0.308 0.02
septal e’ wave -0.274 0.047
lV: left ventricle; VtI: velocity-time integral; e’: early diastolic myocardial velocity; MApse: mitral annulus peak systolic excursion.
Figure 3. Correlation between total isovolumic time (t-IVt) and left ventricular filling time
Figure 4. Correlation between total isovolumic time (t-IVt) and left ventricular outflow tract velocity-time integral
Figure 5. Correlation between total isovolumic time (t-IVt) and left ventricular stroke volume
to better manage these findings. Reducing lA pressure by vasodilators and diuretic should not be on the expense of further reduction in filling and stroke volume. the extent of dyssynchrony that requires electrical (CRt) treatment remains controversial since only less than 20% of patients had
combined electrical and mechanical evidence for dyssynchrony as previously shown26. Applying CRt treatment on the 7 extra
patients with QRs >135 ms remains questionable. Although the measurements we analyzed do not look specific for HFpeF they might be useful in assessing individual patient response to other recommended therapies e.g. beta blockers.
Limitations: the small number of patients we studied weakens generalizing the findings, in view of the known heterogeneity of HFpeF patients27. we did not measure lA pressure objectively
but relied on the well validated measures of estimated left atrial pressure e.g. enlarged cavity and raised e/e’. we did not assess cardiac function at the time of symptom development but deduced our interpretation on the basis of resting findings and prior knowledge of cardiac response to exercise in the setting of HFpeF28.
Conclusion: left ventricular global dyssynchrony correlates inversely with short filling time and compromised stroke volume in HFpeF patients, but not ejection fraction or QRs duration. these findings suggest a potential benefit from CRt, in a minority of symptomatic patients who demonstrate clear evidence for electrical and mechanical dyssynchrony. they also stress the need for critical individualistic approach to achieve optimum management for HFpeF.
Correspondence to: dr. gani Bajraktari, Md, FesC
Clinic of Cardiology and Angiology, university Clinical Centre of Kosova, “Rrethi i spitalit”, p.n., prishtina, Kosovo
tel: + 377 45 800 808
e-mail:[email protected]
References
1. lloyd-Jones d, Adams R, Carnethon M, de simone g, Ferguson tB, Flegal K, et al: American heart association statistics committee and stroke statistics subcommittee. Heart disease and stroke statistics-2009 update: a report from the American heart association statistics committee and stroke statistics subcommittee. Circulation 2009; 119:480-6
2. weir RA, McMurray JJ: epidemiology of heart failure and left ventricular dysfunction after acute myocardial infarction. Curr Heart Fail Rep 2006; 3: 175-80.
3. oh JK, Hatle l, tajik AJ, little wC. diastolic heart failure can be diagnosed by comprehensive two-dimensional and doppler echocardiography. J Am Coll Cardiol 2006; 47: 500-6.
4. lam Cs, donal e, Kraigher-Krainer e, Vasan Rs. epidemiology and clinical course of heart failure with preserved ejection fraction. eur J Heart Fail 2011; 13: 18-28.
5. Anand Is, Rector ts, Cleland Jg, Kuskowski M, McKelvie Rs, persson H, McMurray JJ, Zile MR, Komajda M, Massie BM, Carson pe. prognostic value of baseline plasma amino-terminal pro-brain natriuretic peptide and its interactions with irbesartan treatment effects in patients with heart failure and preserved ejection fraction: findings from the I-pReseRVe trial. Circ Heart Fail 2011; 4: 569-77.
6. Kitzman dw, Hundley wg, Brubaker pH, Morgan tM, Moore JB, stewart Kp, little wC. A randomized double-blind trial of enalapril in older patients with heart failure and preserved ejection fraction: effects on exercise tolerance and arterial distensibility. Circ Heart Fail 2010; 3: 477-85. 7. Conraads VM, Metra M, Kamp o, de Keulenaer gw, pieske B, Zamorano
J, Vardas pe, Böhm M, dei Cas l. effects of the long-term administration of nebivolol on the clinical symptoms, exercise capacity, and left ventricular function of patients with diastolic dysfunction: results of the elANdd study. eur J Heart Fail 2012; 14(2): 219-25.
8. Anand Is, Carson p, galle e, song R, Boehmer J, ghali JK, Jaski B, lindenfeld J, o’Connor C, steinberg Js, leigh J, yong p, Kosorok MR, Feldman AM, deMets d, Bristow MR. Cardiac resynchronization therapy reduces the risk of hospitalizations in patients with advanced heart failure: results from the Comparison of Medical therapy, pacing and defibrillation in Heart Failure (CoMpANIoN) trial. Circulation 2009; 119: 969-77.
9. Cleland Jg, daubert JC, erdmann e, Freemantle N, gras d, Kappenberger l, tavazzi l. longer-term effects of cardiac resynchronization therapy on mortality in heart failure [the CArdiac Resynchronization-Heart Failure (CARe-HF) trial extension phase]. eur Heart J 2006; 27: 1928-32. 10. Moss AJ, Hall wJ, Cannom ds, Klein H, Brown Mw, daubert Jp, estes NA
3rd, Foster e, greenberg H, Higgins sl, pfeffer MA, solomon sd, wilber d, Zareba w; MAdIt-CRt trial Investigators. Cardiac resynchronization therapy for the prevention of heart failure events. N engl J Med 2009; 361: 1329-38.
11. Miyazaki C, Redfield MM, powell Bd, lin gM, Herges RM, Hodge do, et al. dyssynchrony indices to predict response to cardiac resynchronization therapy: a comprehensive prospective single-center study. Circ Heart Fail 2010; 3: 565-73.
12. duncan AM, lim e, Clague J, gibson dg, Henein My. Comparison of segmental and global markers of dyssynchrony in predicting clinical response to cardiac resynchronization. eur Heart J 2006; 27: 2426-32. 13. Verbrugge FH, Verhaert d, grieten l, dupont M, Rivero-Ayerza M, de
Vusser p, Van Herendael H, Reyskens R, Vandervoort p, tang wH, Mullens w. Revisiting diastolic filling time as mechanistic insight for response to cardiac resynchronization therapy. europace 2013; 15: 1747-56. 14. porciani CM, lilli A, Cappelli F, pappone A, perini Ap, pieragnoli p,
Ricciardi g, Rao CM, prinzen Fw, Michelucci A, padeletti l. echo/doppler-derived time intervals are able to predict left ventricular reverse remodeling after cardiacresynchronization therapy. J Cardiovasc Med (Hagerstown) 2010; 11: 157-63.
15. guha K, Mantziari l, sharma R, Mcdonagh tA, gibson d, duncan AM. A reduction in total isovolumic time with cardiac resynchronisation therapy is a predictor of clinical outcomes. Int J Cardiol 2013; 168: 382-7.
16. Höglund C, Alam M, thorstrand C: Atrioventricular valve plane displacement in healthy persons. An echocardiographic study. Acta Medscand 1988; 224: 557-62.
17. Appleton Cp, Hatle lK, popp Rl. Relation of transmitral flow velocity patterns to left ventricular diastolic function: new insights from a combined hemodynamic and doppler echocardiographic study. J Am Coll Cardiol 1988; 12:426–40.
18. duncan AM, Francis dp, Henein My, gibson dg. Importance of left ventricular activation in determining myocardial performance (tei) index: comparison with total isovolumic time. Int J Cardiol 2004; 95:211-7. 19. tei C, ling lH, Hodge do, Bailey KR, oh JK, Rodeheffer RJ, tajik AJ,
seward JB. New index of combined systolic and diastolic myocardial performance: a simple and reproducible measure of cardiac function - a study in normals and dilated cardiomyopathy. J Cardiol 1995; 26: 357-366. 20. Zoghbi wA, enriquez-sarano M, Foster e, grayburn pA, Kraft Cd, levine
RA, Nihoyannopoulos p, otto CM, Quinones MA, Rakowski H, stewart wJ, waggoner A, weissman NJ. American society of echocardiography. Recommendations for evaluation of the severity of native valvular regurgitation with two-dimensional and doppler echocardiography. J Am soc echocardiogr 2003; 16: 777-802.
21. gardin JM, Adams dB, douglas ps, Feigenbaum H, Forst dH, Fraser Ag, grayburn pA, Katz As, Keller AM, Kerber Re, Khandheria BK, Klein Al, lang RM, pierard lA, Quinones MA, schnittger I: American society of echocardiography. Recommendations for a standardized report for adult transthoracic echocardiography: a report from the American society of echocardiography’s Nomenclature and standards Committee and task Force for a standardized echocardiography Report. J Am soc echocardiogr 2002; 15: 275-90.
22. duncan A, Francis d, gibson d, pepper J, Henein M. electromechanical left ventricular resynchronisation by coronary artery bypass surgery. eur J Cardiothorac surg 2004; 26: 711-9.
23. Bajraktari g, elezi s, Berisha V, lindqvist p, Rexhepaj N, Henein My. left ventricular asynchrony and raised filling pressure predict limited exercise performance assessed by 6 minute walk test. Int J Cardiol 2011; 146: 385-9.
24. tay el, gibson d, Inuzuka R, Josen M, Alonso-gonzalez R, giannakoulas g, li w, dimopoulos K, gatzoulis MA. total isovolumic time relates to exercise capacity in patients with transposition of the great arteries late after atrial switch procedures. Cardiol young 2012; 22: 381-9. 25. Bajraktari g, dini Fl, Fontanive p, elezi s, Berisha V, Napoli AM, Ciuti
M, Henein M. Independent and incremental prognostic value of doppler-derived left ventricular total isovolumic time in patients with systolic heart failure. Int J Cardiol 2011; 148: 271-5.
26. Bleeker gB, schalij MJ, Molhoek sg, Verwey HF, Holman eR, Boersma e, steendijk p, Van der wall ee, Bax JJ. Relationship between QRs duration and left ventricular dyssynchrony in patients with end-stage heart failure. J Cardiovasc electrophysiol 2004; 15: 544-9.
27. Zile MR, gottdiener Js, Hetzel sJ, McMurray JJ, Komajda M, McKelvie R, Baicu CF, Massie BM, Carson pe; I-pReseRVe Investigators. prevalence and significance of alterations in cardiac structure and function in patients with heart failure and a preserved ejection fraction. Circulation 2011; 124: 2491-501.