FORLAWRENCELIVERMORENATIONALLABORATORY
OPTIMIZING ELECTROSPUN CERAMIC
NANOFIBER STRENGTH THROUGH TWO-STEP
SINTERING
June 13, 2019
A Senior Project
by
Michael Ross
In Partial Fulfillment
of the Requirements for the Degree
Bachelor of Science, Materials Engineering
California Polytechnic State University, San Luis Obispo
CONTAINS LLNL PROPRIETARY INFORMATION CONTENTS
Contents
1 Abstract 6
2 Introduction 7
2.1 Problem Statement . . . 7
2.2 Stakeholders . . . 7
3 Background 8 3.1 Electrospun Ceramic Nanofibers . . . 8
3.2 Ceramic Nanofiber Strength . . . 13
3.3 Nanocrystalline Sintering . . . 17
3.4 β-Ga2O3Nanostructures . . . 22
4 Methodology 27 4.1 Sample Preparation . . . 27
4.2 Mechanical Testing . . . 28
4.3 Microstructural Characterization . . . 28
5 Results 30 5.1 Mechanical Properties . . . 30
5.2 Microstructural Characteristics . . . 35
6 Discussion 41
7 Conclusions 43
8 Acknowledgements 44
CONTAINS LLNL PROPRIETARY INFORMATION LIST OF FIGURES
List of Figures
1 Schematic drawing of an electrospinning experimetal set-up [6]. . . 9 2 Scanning electron microscope images of (a) polyvinyl alcohol [PVA] nanofibers,
(b) beading structural defects, and (c) an example of a collector drum modifica-tion to achieve fiber alignment [7]. . . 11 3 Crack nucleation and propagation in ceramic materials stressed in compression
[16]. . . 13 4 Load-displacement curves for (a) typically brittle, linear elastic materials, such
as dense ceramics, and (b) "pseudo-plastic" materials, such as high porosity ceramics [15]. . . 14 5 Weibull plot showing probability of survival as a function of fracture stress [16]. 16 6 Densification curve of a powder compact, showing the stages of sintering [24, p.
40]. . . 19 7 The isothermal and two-step sintering profiles, with respective microstructural
evolution from densification and grain growth [26]. . . 20 8 Evolution of fiber (a) with unconstrained grains (b, c) and constrained grains
(b’, c’) [30]. . . 21 9 VESTA simulated a)β-Ga2O3crystal structure and b) X-ray diffraction pattern
[31-33]. Major peaks occur at c) 2θ= 30.4, 31.8, 35.3, and 64.1o
, corresponding to the (4 0 1), (0 0 2), (1 1 1), and (5 1 2) planes, respectively, forβ-Ga2O3calcined at 800 and 1,000o
C [34]. . . 23 10 Comparison of pressure drop between traditional HEPA membranes, polymer
nanofiber membranes, and CNF tubes [47]. . . 24 11 Possible routes for polymorphic gallium (III) oxide synthesis [48]. . . 25 12 The PVP and Ga(NO3)3nanofiber mesh is a) shaped into 15 mm tall and 12
mm diameter tubes, then b) calcined and sintered, forming c) highly deformed
β-Ga2O3specimens. . . 27 13 Mechanical testing experimental setup. . . 28 14 Example output from MATLAB porosity calculations. . . 29 15 CNF fracture modes from fiber damage accumulation and pore crushing
densi-fication. . . 30 16 Isothermally sintered CNF strength fit with a) Weibull distributions and b)
CONTAINS LLNL PROPRIETARY INFORMATION LIST OF FIGURES
17 Two-step sintered CNF strength fit with a) Weibull distributions and b) log-normal distributions. The c) Weibull and d) loglog-normal fits confirm validity of Weibull statistics. . . 32 18 CNF tube strength Weibull plots for a) 1 hour TSS, b) 2 hour TSS, c) 4 hour TSS,
and d) isothermal sintering. . . 33 19 The analysis of variance between medians yielding p-values equal to 0.002,
0.0005, and 0.0045 when the a) 750o
C, 2 hour, b) 875o
C, 2 hour, and c) 875o
C, 4 hour TSS strength distributions were compared to the isothermal sintering strength distribution, respectively. . . 34 20 Surface morphology at 500x maginification of a) isothermally sintered CNFs, b)
the 750oC and c) 875oC 2 hour TSS CNFs, and d) the 4 hour 875oC TSS CNFs. . . 35
21 Representative SEM images at 50,000x maginification of a) isothermally sintered CNFs, b) the 750oC and c) 875oC 2 hour TSS CNFs, and d) the 4 hour 875oC TSS
CNFs. . . 36 22 CNF diffraction pattern with significant peak displacement errors, masking
peak matching withβ-Ga2O3reference pattern. . . 37 23 CNF characteristic strength, with 90% confidence, is inversely proportional to
porosity. . . 38 24 Pore size distribution for the a) isothermally sintered CNFs, b) the 750o
C and c) 875oC 2 hour TSS CNFs, and d) the 4 hour 875oC TSS CNFs. . . 39
CONTAINS LLNL PROPRIETARY INFORMATION LIST OF TABLES
List of Tables
I Electrospinning Process Parameters Influencing Fiber Morphology [7] . . . 10
II Nanostructuredβ-Ga2O3Calcining Conditions From Literature . . . 26
III Heat Treatments forβ-Ga2O3Sintering . . . 27
IV Volume Effects onβ-Ga2O3CNF Isothermal Strength . . . 31
V Two-Step Sinteringβ-Ga2O3CNF Strength . . . 32
VI β-Ga2O3CNF Weibull Parameters . . . 34
VII β-Ga2O3CNF (0 0 2) Crystallite Size . . . 38
VIII β-Ga2O3CNF Porosity Characteristics . . . 40
CONTAINS LLNL PROPRIETARY INFORMATION
1
A
BSTRACT
Two-step sintering (TSS) consists of a high-temperature step and immediate cooling to a sintering temperature for an extended sintering time, where grain growth is suppressed by severe densification during the high-temperature step. TSS is adopted to enhance mechanical properties of electrospun ceramic nanofibers (CNFs), a class of porous ceramics used for environmental remediation, optoelectronics, and filtration. PVP and Ga(NO3)3nanofiber mesh, provided by Lawrence Livermore National Laboratory, was shaped, oxidized, and two-step sintered to form a nanocrystallineβ-Ga2O3CNF tube using a high-temperature step of 1,000oC. Sintering temperatures and times varied from 625oC to 875oC for 1 hour to 4 hours.
A minimum sample size of 26 tubes from each heat treatment were diametrally compressed and compared, with Weibull statistics, to isothermally sintered tubes, treated at 1,000o
C for 1 hour with an average yield strength of 3.36 kPa. CNFs exhibit a pseudo-plastic transition from brittle to cellular stress-strain behavior, resulting from successive brittle fiber failures and pore crushing. TSS successfully strengthens the CNF tubes to an average yield strength of 5.72 kPa with a 2 hour, 875oC sintering. X-ray diffraction (XRD) crystallite measurements
CONTAINS LLNL PROPRIETARY INFORMATION
2
I
NTRODUCTION
Lawrence Livermore National Laboratory has employed a team of student engineers from California Polytechnic State University, San Luis Obispo to facilitate automated or semi-automated tooling for electrospun polymer-ceramic nanofiber mesh manipulation. The tooling forms the mesh into tubes, specified to diameters between 6 and 12 millimeters and a length equal to 15 millimeters. During production, the mesh material consists of a polymer and a ceramic precursor. The mesh must go through a final heat treatment step to decompose present organic matter and oxidize the ceramic precursor to form the ceramic oxide; this is calcination, or heating at an elevated temperature for a specified time in air, and fiber properties are determined by the degree of sintering and the resulting microstructure. This report deals with sintering optimization for the strongest ceramic nanofiber tube given a 12 millimeter diameter, 15 millimeter tall precursor mesh tube.
2.1 Problem Statement
LLNL is sponsoring an investigation into optimizing sintering parameters for strength in electrospun beta gallium (III) oxide [β-Ga2O3] nanofiber tubes from the polymer-ceramic precursor, polyvinylpyrrolidone [PVP] and gallium nitrate [Ga(NO3)3]. Maximum mesh strength will be achieved through defect removal, minimizing grain growth, and maximizing densification. Conclusions will be drawn by statistically modeling strength as a function of sintering temperature and time using Weibull statistics.
2.2 Stakeholders
CONTAINS LLNL PROPRIETARY INFORMATION
3
B
ACKGROUND
Ceramics are inorganic and non-metallic, crystalline materials, characterized by high strength, brittleness, and temperature resistance. Silica [SiO2], or sand, is a ceramic and one of the most abundant materials on Earth. It is the building block of glassy materials and many precious gemstones like quartz, olivine, and garnet. Other non-technical ceramic materials have been used for thousands of years in the form of pottery and other whiteware like porce-lain, while technical ceramics find uses ranging from furnace linings to turbocharger rotors to composite fibers. Technical ceramic fibers are strong, stiff, and corrosion resistant at high temperatures, but suffer from low strain-to-failure due to crystalline imperfections such as pores, impurities, and electrical defects [1]. Many processing techniques exist for producing ceramic fibers with diameters on the micron scale, such as chemical vapor deposition (CVD) for silicon carbide [SiC] integrated circuitry, melt spinning for insulating wool used in petro-chemical and automotive industries, and sol-gel methods for alumina [Al2O3] composite fibers [2-4]. Large diameter ceramic fibers are easily fractured and potentially hazardous when unbound. Safety precautions and exposure limits are set in place when fabricating and characterizing such materials. Electrospinning and subsequent thermal treatment is the simplest procedure for open-cell structured and bounded ceramic nanofiber (CNF) mesh production [5]. With high surface to volume ratios, aspect ratios greater than 1,000, and fiber diameters less than 100 nm, CNFs have unique properties catered to nanoscale engi-neering applications in microelectromechanical systems [MEMS], fluid and gas purification, biological scaffolding, and drug delivery devices [6].
3.1 Electrospun Ceramic Nanofibers
Ceramic materials are refractory, with melting temperatures greater than 1,000oF. To spin
CONTAINS LLNL PROPRIETARY INFORMATION 3.1 Electrospun Ceramic Nanofibers
3.1.1 Processing
Electrospinning is a simple, yet power-intensive and slow process to fabricate nanofiber meshes. An electrospinning apparatus consists of a power supply, a pump dispensing the polymer-solvent-precursor solution, an extruding needle or syringe, and a collector plate or drum (Figure 1).
Figure 1:Schematic drawing of an electrospinning experimetal set-up [6].
An electric potential (∼10s of kV) is applied to a ceramic-polymer-solvent solution, pro-ducing strong molecular repulsion. Using a pump with a flow rate on the order of microliters per hour, solution is drawn out of a syringe tip into an electric field between the grounded or negatively charged collector plate and biased solution. The solvent evaporates from the solution until landing on the collector in fibrous form. The result is a pre-ceramic polymer nanofiber mesh which takes about 8 hours to produce one sheet of material. There are many advantages to electrospinning, mainly the flexibility of synthesizing a variety of different fiber solutions. If the solution is a compatible ceramic-polymer-solvent system and has an ideal viscosity, the solution can be spun. This is especially convenient when designing complex materials that include multiple precursors or dopants [6].
CONTAINS LLNL PROPRIETARY INFORMATION 3.1 Electrospun Ceramic Nanofibers
plays a role in crystallization kinetics of ceramic materials, particularly rare-earth metals [8]. Depending on the polymer, ceramic, and desired performance, different thermal processing is required. The polymer binder is typically decomposed at its glass transition temperature, while ceramic nucleation begins at a lower temperature before measurable coalescence occurs [9, p. 784]. CNFs are advantageous to polymeric nanofibers for particular applications due to their high temperature resistance, crystalline microstructure, and strength.
3.1.2 Structure
The ability to customize fiber structure is a function of solution properties and electro-spinning variables. Relevant electroelectro-spinning parameters are included inTable Ifrom Panda (2007) and references therein, summarizing their effects on fiber morphology.
Table I:Electrospinning Process Parameters Influencing Fiber Morphology [7]
Parameter Influence Solu tion P roper ti
es Polymer Concentration Direct, power law, cubed, and parabolic propor-tion to fiber diameter for different systems Ionic Strength Proportional to charge density, inversely
propor-tional to beading
Solvent Directly related to evaporation and solidification rate
Temperature Inversely proportional to viscosity and beading Viscosity Parabolic relationship to fiber diameter and
spin-ning ability E lec tr ospin ni ng V ari ab les Voltage
Direct effect on bead formation, inversely pro-portional to fiber diameter and surface charge density
Collector Distance
Inversely proportional to bead formation density, electric field strength, and fiber diameter, expo-nentially inversely proportional to volume charge density
Flow Rate
Proportional to electric current and fiber diame-ter, inversely proportional to surface and volume charge density
CONTAINS LLNL PROPRIETARY INFORMATION 3.1 Electrospun Ceramic Nanofibers
(Figure 2). The as-spun fiber diameter, typically on the order of∼100s of nanometers, arises from a balance between surface tension and solution electrostatic repulsion. Electrospun nanofibers are not oriented in a particular direction; however, alignment can be achieved through metal frameworks attached to the collector [7].
(a) (b) (c)
Figure 2:Scanning electron microscope images of (a) polyvinyl alcohol [PVA] nanofibers, (b) beading structural defects, and (c) an example of a collector drum modification to achieve fiber alignment [7].
The isotropic open-celled structure of an electrospun mesh is ideal for many applications; ceramic precursors are evenly spread through the polymer fiber structure, major porosity is observed, and a high surface to volume ratio is achieved.
Upon thermal treatment, electrospun nanofibers undergo severe volumetric shrinkage (∼50-90%) while retaining their porous and fibrous structure. Depending on the original electrospinning conditions, dopant concentration, and subsequent thermal treatment, the possible CNF structures can range from smooth to irregular and hollow to dense [10]. The fiber diameter distribution is reduced upon thermal treatment, and the average fiber diameter is often less than 100 nm.
3.1.3 Properties and Performance
CONTAINS LLNL PROPRIETARY INFORMATION 3.1 Electrospun Ceramic Nanofibers
and smooth muscle cells of electrospun collagen, elastin, and poly(D,L-lactide-co-glycolide) [PLGA] membranes has shown promise for native artery scaffolds in humans and animals [11]. Cellulose membranes are being used as adsorptive materials for protein purification and toxin removal. Surface functionalization with ligands or ceramic ions electrostatically attract pollutants and purify water by removing or recycling trace amounts of heavy metal such as cadmium [Cd], lead [Pb], and arsenic [As] [12]. Polymeric composite nanofibers are used to detect or sense biomolecules and hazardous gases. Nanofiber conductivity is directly propor-tional to the concentration of gas analytes adsorped to its surface. For example, polypyrrole [PPy] fibers functionalized with the protein avidin can detect biotin-labeled molecules, such as DNA, in biosensors. Nanofibers functionalized with semiconducting ceramic oxides are sensitive to toxic gases like ammonia and nitroxide and sense based on measurable changes in material resistivity [12].
CNFs are a growing field in materials science, being used for a wide array of nanoscale engineering applications such as piezo- and ferroelectric devices, thermovoltaic emitters, particulate filtration, transport media, and fuel cells due to their surface to volume ratio, thermal resistivity, and conductivity. Ceramics such as magnesium titanate [MgTiO3], nickel titanate [NiTiO3], and lead zirconate titanate [PZT] are utilized for electronic and power generation applications, while ceramic oxides like zinc oxide [ZnO], zirconia [ZrO], and titania [TiO2] are used widely in sensing, environmental remediation, and electro-optical devices [7]. The ceramic oxides mentioned exhibit photocatalytic properties, advantageous for water purification. When exposed to a particular frequency of light, photocatalysts are electromagnetically excited, producing free electrons that reduce water molecules to hydroxyl radicals [OH-]. The hydroxyl radicals have the capacity to oxidize and destroy organic pollutants adsorped to the CNF surface [13].
CONTAINS LLNL PROPRIETARY INFORMATION 3.2 Ceramic Nanofiber Strength
3.2 Ceramic Nanofiber Strength
The strength of ceramic materials is dependent on the size distribution of microstructural defects, including cracks, pores, and inclusions [16]. Nanofibrous materials are considered open-celled and highly porous, where pores are the major flaw type in the microstructure. The pore size distribution and the porosity within the ceramic nanofiber material will determine its strength [15]. Typically, ceramic materials are linear elastic to failure, where stress and strain are linearly related by the elastic modulus according to Hooke’s law until yielding occurs; however, the microstructure of a CNF mesh will lead to variable stress-strain behaviors. When a brittle, or linear elastic, material is stressed in compression, fracture occurs once the material is crushed when the yield strength is reached and a critical flaw size is reached (Figure 3). The compressive strength of a ceramic is determined by the average flaw size, whereas the tensile strength is determined by the largest flaw size [16].
Figure 3:Crack nucleation and propagation in ceramic materials stressed in compression [16].
CONTAINS LLNL PROPRIETARY INFORMATION 3.2 Ceramic Nanofiber Strength
3.2.1 Porous Ceramic Fracture Mechanics
Pores are a major flaw type in nanofibrous materials. When a crack begins to propagate through a nanofibrous material, the crack will initiate through a fiber. The crack can prop-agate through a polycrystal (i.e. a grain) or an interface between polycrystals (i.e. a grain boundary). Once a crack reaches a major pore, the crack propagation is blunted. The crack is unable to traverse the pore and continue propagating to the next fiber, requiring additional stress to nucleate an additional crack in the next fiber. The pores in a porous ceramic may be modeled as pre-existing cracks and points of stress concentration, which increase the nucleation energy for crack propagation under stress. Thus, unlike typically brittle materials and dense ceramics, CNFs and porous ceramics experience an increase in fracture toughness with increasing strength, as well as exhibit psuedo-plastic stress-strain behaviors at high porosities [17]. As opposed to low porosity ceramics, where a single macrocrack fractures the material, highly porous ceramics fracture from many microcracks that localize to form a macrocrack and pore crushing. CNF meshes behave as cellular materials, where fracture begins in the solid walls between pores and failure occurs due to damage accumulation from multiple fractures [15]. Once a ceramic reaches a threshold porosity (∼50%), the stress-strain behavior transitions from linear elastic to "pseudo-plastic," due to the multiple microcracks and fractures formed during loading (Figure 4).
(a) (b)
Figure 4:Load-displacement curves for (a) typically brittle, linear elastic materials, such as dense ceramics, and (b) "pseudo-plastic" materials, such as high porosity ceramics [15].
CONTAINS LLNL PROPRIETARY INFORMATION 3.2 Ceramic Nanofiber Strength
pores and a distribution of solid media of which mechanical properties are controlled [15, 17]. As porosity increases, the wall thickness between pores decreases, leading to cracking and pore linkage. The sample does not fracture here but fractures after continuous damage accumulation and multiple wall failures, leading to pseudo-plastic fracture behavior. As porosity decreases, wall thickness between pores increases, leading to the formation of cracks large enough for brittle fracture behavior. Nanofiber mechanical properties are also directly influenced by connectivity between fibers; the more fibers that are connected, the more distributed a load will be [17].
3.2.2 Statistical Modeling: The Weibull Distribution
Vacancies in ceramic materials are statistical in nature. Every crystalline material will have an equilibrium concentration of vacancies at a given temperature in order to lower the free energy of the crystal. Each vacancy increases the entropy of the crystal and requires an activation enthalpy of formation. The concentration of vacancies in a crystal is given by an Arrhenius relationship, depending on the Gibbs energy,Gf, the temperature, and the ideal gas
constant,R, inEquation 1. Because ceramic strength is a function of statistically distributed microstructural defects, ceramic strength is variable and modeled by a statistical distribution, known as the Weibull distribution.
cv=exp
µ−G
f
RT
(1)
The Weibull probability distribution relates a specimen’s probability of failure,p, in a given sample size,Vo, with an applied stress,σ(Equation 2). A characteristic stress,σo, is determined as the applied stress at which a specimen in a given sample has a∼37% chance of surviving. The scatter presented in the strength data of a given sample size is represented by the Weibull modulus,m, where a large Weibull modulus means there is less scatter and a small Weibull modulus means there is more scatter.
p(Vo)=1−exp
·
−
µ σ
σo
¶m¸
(2)
CONTAINS LLNL PROPRIETARY INFORMATION 3.2 Ceramic Nanofiber Strength
the characteristic stress (Figure 5). Ductile materials, however, do not follow Weibull statistics because there is not as much statistical scatter in strength data compared to brittle materials.
Figure 5:Weibull plot showing probability of survival as a function of fracture stress [16].
In addition to inherent scatter in strength data, porosity directly influences porous ce-ramic strength scatter. As porosity increases, scatter in strength decreases, corresponding to a larger Weibull modulus [15]. The scatter in ceramic strength data is an insight into the flaw size distribution within the microstructure,.
[talk about other distributions]
3.2.3 Strengthening Mechanisms
Polycrystalline materials are strengthened by minimizing porosity (i.e. maximizing densi-fication), minimizing grain size, and, in the case for fibers, minimizing fiber diameter [16]. CNF meshes will inherently be up to∼90% porous, but the resulting nanofiber diameter and polycrystalline grain size may be controlled through mindful heat treatment.
CONTAINS LLNL PROPRIETARY INFORMATION 3.3 Nanocrystalline Sintering
Grain boundary strengthening is a mechanism for polycrystalline materials. Given by the Hall-Petch relationship inEquation 3, the yield strength of a polycrystalline material,
σy, can be influenced by the inverse square root of the grain size,d, and a material specific constant,k. A small grain size increases the number and volume of grain boundaries, or interfaces between polycrystals, which hinder dislocation motion. Dislocations are a one-dimensional microstructural defect through which materials fracture. Grain boundaries impede the onset of plasticity, increasing the yield strength of a polycrystalline material. Many more dislocations pile up in larger grains, requiring less force to move to another grain. Thus, smaller grains, which can not store many dislocations, require more force for dislocation motion between grains. Porous ceramics with a high volume of grain boundaries and small particle sizes distribute a load much more uniformly than a porous ceramic with few grain boundaries and large grains [20, 21].
σo=σy+
k
p
d (3)
An inverse Hall-Petch relationship has been observed for nanocrystalline materials with grain size is smaller than a threshold diameter below a few tens of nanometers. Grain boundaries no longer strengthen the material as a new yielding mechanism, known as grain boundary sliding, presents itself. With nanocrystalline ceramics, there are many more triple junctions, or points where three adjacent grains meet. Triple junctions are points of high strain between misoriented grains in the microstructure and can lead to the formation of nanocracks, or flaws that can initiate fracture [22]. Proper sintering must be employed to engineer a strong ceramic with appropriate grain size, minimized fiber diameter, and maximized density.
3.3 Nanocrystalline Sintering
CONTAINS LLNL PROPRIETARY INFORMATION 3.3 Nanocrystalline Sintering
melting temperatures of ceramic materials; however, the high surface to volume ratio of nanoparticles results in a reduced material melting temperature. This effect must be taken into account when sintering nanocrystalline materials, leading to reduced sintering times and temperatures [23]. CNFs are typically sintered without pressure to preserve inherent porosity. Densification is a much slower process without applied pressure, but an engineered heat treatment can take advantage of multiple sintering mechanisms to produce a nanofiber mi-crostructure that is adequately dense, with minimally grown grains and without eliminating mesh porosity.
3.3.1 Densification and Grain Growth
Sintering activity is a function of heat treatment time and temperature, where the amount of crystalline coalescence is dependent on mass diffusion given by an Arrhenius relationship inEquation 4, where mass transport rate is determined by the maximal diffusion coefficient,
Do, the activation energy for diffusionEA, the ideal gas constant, and temperature. Diffusion
is the mechanism by which all sintering mechanisms are thermally activated, and its driving force is the gradient of chemical potential energy in the microstructure.
D=Do•exp
µ
−EA
RT
(4)
The driving force for sintering is the reduction of interfacial free energy by replacing grain surfaces with grain boundaries through densification and reducing interfacial grain bound-ary area per volume of grains through grain growth [24]. To strengthen a porous ceramic, maximum densification with minimal grain growth is required. Ceramic densification rate is a function of temperature and grain size (Equation 5). Densification rate,ρ., is enhanced by smaller grain sizes,d, and higher temperatures, as grain boundary diffusion,Dgb, is related to
temperature through the Arrhenius relationship inEquation 4[23].
˙
ρ∝ Dg b
T d4 (5)
CONTAINS LLNL PROPRIETARY INFORMATION 3.3 Nanocrystalline Sintering
grain boundary area. Grain growth can either be normal, meaning the resulting grain size distribution is narrow, or abnormal, where exceptionally large grains grow among many fine grains. Normal grain growth, given byEquation 6, is proportional to the square root of the sintering time, so longer sintering times yield larger grains. Grain growth is also dependent on the initial grain size,do, but to a much lesser extent than the dependence on sintering
time and temperature.
d2−do2∝M t (6)
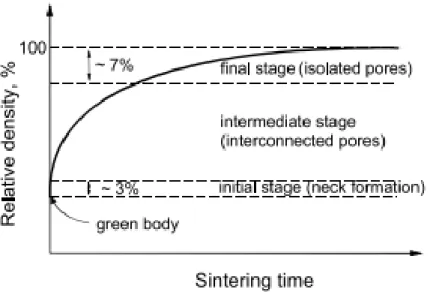
Grain growth works in opposition to densification, since these phenomena are competing in the balance of free energy [9, p. 545]. The densification curve, plotting relative density versus sintering time, illustrates the dominant mechanisms in different stages of sintering Figure 6. The initial and intermediate sintering stages are characterized by rapid densifica-tion, while the final stage is characterized by grain growth. Grain coarsening still occurs in the first sintering stages, but microstructural evolution is dominated by densification.
Figure 6:Densification curve of a powder compact, showing the stages of sintering [24, p. 40].
CONTAINS LLNL PROPRIETARY INFORMATION 3.3 Nanocrystalline Sintering
3.3.2 Isothermal vs. Two-Step Sintering
There are two approaches to sintering ceramic materials in the literature; isothermal sintering and two-step sintering (TSS). The sintering parameters vary for each approach, producing variable microstuctures with subsequent mechanical properties (Figure 7).
Figure 7:The isothermal and two-step sintering profiles, with respective microstructural evolution from densification and grain growth [26].
Isothermal sintering is the convention for ceramic processing, consisting of three process variables; heating rate, sintering temperature, and sintering time. Heating rate is dependent on part geometry and whether crystallization of a new phase occurs. Generally, sintering temperature is greater than the ceramic operating temperature and sintering time is longer than heat-up time. Cooling rate is controlled to prevent thermal stress in the microstruc-ture through annealing. Thermal stressing is a function of the thermal gradient across a component, so annealing is unnecessary for small components [9, p. 787]. Isothermal sin-tering produces ceramics with large grains (i.e. d> 1µm) because of unsuppressed grain growth during the dwell. Nanocrystalline ceramics are nearly impossible to produce isother-mally without the aid of applied pressure. CNF fiber diameter and grain size must be on the nanoscale to preserve the high surface to volume ratio and porosity.
CONTAINS LLNL PROPRIETARY INFORMATION 3.3 Nanocrystalline Sintering
The immediate reduction to the sintering temperature is where grain growth should occur; however, the formation of many triple junctions, as discussed inSection 3.2.3, during the high-temperature step suppresses grain boundary mobility and not grain boundary diffusion, essentially freezing out grain growth but not densification [27, 28]. Because kinetics are slow, TSS reduces differential densification through the elimination of fine particles from enhanced in the initial stage of sintering, and delays pore elimination to the final stages [29].
TSS is advantageous for sintering nanocrystalline ceramics. Grain growth is unsuppressed during isothermal sintering. CNF fiber diameter is∼100 nm, so the grains must be nanocrys-talline to strengthen a fiber. If sintered too hot and too long, the grains grow unchecked and de-sinter, causing morphological instability.
3.3.3 De-Sintering
When grains grow while constrained from shrinking, de-sintering occurs, breaking up a fiber of truncated grains into isolated spheres. This phenomenon arises from reduction of the surface energy to grain boundary area ratio; once reaching a critical grain size aspect ratio, a spherical grain has the lowest surface energy and is favorable to high interfacial surface energy grain boundaries (Figure 8).
Figure 8:Evolution of fiber (a) with unconstrained grains (b, c) and constrained grains (b’, c’) [30].
The reduction of free energy is concurrent with a decrease in the dihedral angle,ψ, which is the angle between adjacent grains. The energy reduction due to sintering of a crystalline fiber is the ratio of the free energy of the unconstrained fiber, Eu, to the free energy of
the constrained fiber,Ec[30]. Given an equilibrium dihedral angle, ψe, dependent on the
CONTAINS LLNL PROPRIETARY INFORMATION 3.4 β-Ga2O3Nanostructures
throughEquation 7. A de-sintered constrained fiber is more energetically unfavorable than an unconstrained fiber [30].
Eu
Ec =
· 1 2cos ψe 2 ³
3−cos2ψe
2 ´¸
(7)
Constraints in powder compacts are due to a wide grain size distribution from differential densification, a common problem when isothermally sintering nanocrystalline ceramics. TSS reduces differential densification through grain boundary diffusion of finer particles into coarser grains, resulting in a narrower grain size distribution.
3.4
β
-Ga
2O
3Nanostructures
This paper is investigating the sintering characteristics and mechanical performance of a beta gallium (III) oxide [β-Ga2O3] CNF tube calcined from an electrospun polyvinylpyrroli-done [PVP] and gallium nitrate [Ga(NO3)3] nanofiber mesh. PVP is a water-soluble ther-moplastic polymer used for glues, surfactants, and binders due to its adhesive properties. Ga(NO3)3is the ceramic precursor used to formβ-Ga2O3, and it is used to treat hypercal-cemia, a condition secondary to cancer. Gallium (III) oxide is a polymorphic material, and the specific crystal structure investigated isβ-Ga2O3.
3.4.1 Material Properties and Applications
β-Ga2O3is the most stable gallium(III) oxide polymorph, being a monoclinic structured ceramic oxide semiconductor, with gallium cations occupying the octahedral and tetrahedral interstitial sites in a distorted oxide anion cubic structure. Both the crystal structure and X-ray diffraction pattern are simulated using VESTA inFigure 9[31]. Theβ-Ga2O3unit cell consists of 10 atoms, and dimensions used for simulation are found in literature [32, 33]. The simulated pattern 2θvalues match well with the JCPDS reference pattern, with major peaks occurring at 2θ= 30.4, 31.8, 35.3, and 64.1o, corresponding to the (4 0 1), (0 0 2), (1 1 1), and (5
1 2) planes, respectively [34].
CONTAINS LLNL PROPRIETARY INFORMATION 3.4 β-Ga2O3Nanostructures
(a)
(b)
(c)
Figure 9:VESTA simulated a)β-Ga2O3crystal structure and b) X-ray diffraction pattern [31-33]. Major
peaks occur at c) 2θ= 30.4, 31.8, 35.3, and 64.1o, corresponding to the (4 0 1), (0 0 2), (1 1 1), and (5 1 2)
planes, respectively, forβ-Ga2O3calcined at 800 and 1,000oC [34].
With a band gap of 4.9 eV, bulkβ-Ga2O3is optically transparent. However, β-Ga2O3 nanofibers of variable crystallinities based on heat treatment exhibit tunable blue and yellow photoluminescence [36-38]. When doped with a concentration of lanthanides and actinides,
β-Ga2O3nanofiber photoluminescent properties can be further tuned to green and red, covering all primary colors, which is attractive for optoelectronic and flat panel display technologies [39-41].
β-Ga2O3 nanowires exhibit excellent thermal stability and photocatalytic properties when exposed to UV light due to the oxidative nature of its crystal structure. Photocatalytic properties for Rhodamine B [RhB] degradation was susceptible to differing nanostructure sizes and morphology [42]. Theβ-Ga2O3nanostructure is highly adsorptive [43].β-Ga2O3 nanostructures are also excellent catalysts, and have been embedded in alumina to grow gallium nitride [GaN] nanowires with 50 nanometer fiber diameters [44].
β-Ga2O3has been investigated for electronic applications such as metal oxide field-effect transistors (MOSFET), Schottkey diodes, and metal insulator semiconductors (MIS) [35]. GaN is a common dielectric material and is known to growβ-Ga2O3at a rate of 25 nanometers per minute in dry oxygen at 900oC [45]. Theβ-Ga
2O3/GaN dielectric layer is advantageous due to minimized current leakage. GaN nanowire oxidation has also been observed and can be implemented as a protective coating for MOSFET devices [46].
CONTAINS LLNL PROPRIETARY INFORMATION 3.4 β-Ga2O3Nanostructures
however, when compared to as-spun nanofiber membranes, CNF tubes produced higher pressure drops (Figure 10). Depending on tube geometry, desired performance is still feasible. The rupture strength and directional strength are important properties when determining filter lifetime. Stronger filtration media are replaced less often and more reliable.
Figure 10:Comparison of pressure drop between traditional HEPA membranes, polymer nanofiber membranes, and CNF tubes [47].
Growth conditions directly influence the size, morphology, and properties of nanostruc-turedβ-Ga2O3. The kinetic behavior and transformation of the precursor material must be understood to properly evolve aβ-Ga2O3microstructure.
3.4.2 Decomposition and Kinetic Behavior
Gallium (III) oxide exists with many possible crystal structures depending on precursor materials used and thermal processing (Figure 11).β-Ga2O3is the most stable polymorph, and at elevated temperatures, all other gallium(III) oxide crystal structures transform to the monoclinic orientation. It is possible with low processing temperatures to form theδ- and
CONTAINS LLNL PROPRIETARY INFORMATION 3.4 β-Ga2O3Nanostructures
Figure 11:Possible routes for polymorphic gallium (III) oxide synthesis [48].
PVP decomposes at its glass transition temperature,Tg, of about 450oC. The provided
nanofiber meshes are mostly PVP, resulting in severe shrinkage upon thermal treatment. Typically a binder burnout step is added to a sintering profile to fully decompose the polymer and prevent bubbling to preserve the structure. The necessity of a binder burnout step is determined by off-gassing during decomposition. Anhydrous Ga(NO3)3is not thermodynam-ically stable, releasing water vapor and N2O5throughout its decomposition, and depending on heating rate, Ga(NO3)3decomposes to many intermediate compounds before transform-ing toβ-Ga2O3[49]. Faster heating rates (i.e. greater than 5oC/min) were found to result in less decomposition intermediates than slower heating rates, meaning faster heating rates are optimal forβ-Ga2O3formation. With faster decomposition heating rates, there is less off-gassing, so a binder burnout step is unnecessary to include if a heating rate of 5oC/min is
chosen. Regardless of the heating rate,β-Ga2O3begins nucleating forms at around∼600oC. The inclusion of a nucleation step is also negligible since any step which growsβ-Ga2O3 crys-tals is not preferred. Fineβ-Ga2O3crystals should nucleate during the TSS high-temperature step regardless.
3.4.3 Sintering Characteristics
CONTAINS LLNL PROPRIETARY INFORMATION 3.4 β-Ga2O3Nanostructures
or rod-like structures experienced maximum densification at∼1,200o
C, while monoclinic particles densified severely at∼1,400oC. However, nanocrystalline materials sinter at lower
temperatures than bulk materials.Table IIprovides a summary of nanocrystallineβ-Ga2O3 heat treatments found in the literature.
Table II:Nanostructuredβ-Ga2O3Calcining Conditions From Literature
Reference Temperature Time Influence [36] 700, 800o
C 1 hour Crystallite size of 20 nm [37] 750, 850, 950,
1,050oC N/A
Increasing crystallinity with temperature
[38] 550, 600, 650,
700, 750oC 2, 4, 6, 8 hours
Increasing crystallinity with temperature and time
[39] 900oC
6 hours Fiber diameter of 55 nm [40, 41] 900o
C 3 hours Fiber diameter between 100 nm and 300 nm
[42] 900o
C 3 hours Grain size around 200 nm
[43] 900oC
2 hours Crystallite size of 50 nm
Nanocrystallineβ-Ga2O3is typically sintered between the crystallization temperature for
CONTAINS LLNL PROPRIETARY INFORMATION
4
M
ETHODOLOGY
Optimal TSS parameters forβ-Ga2O3CNF tubes are found using a 23design-of-experiment (DOE) with three sintering temperatures and three sintering times, yielding nine heat treat-ments (Table III). A high-temperature step of 1,000oC was chosen to compare against LLNL’s
current isothermal sintering at 1,000oC for 1 hour with 5oC/min heating and cooling rates.
Table III:Heat Treatments forβ-Ga2O3Sintering
Parameter t1 t2 t3
T1 625oC, 1 hour 625oC, 2 hours 625oC, 4 hours
T2 750oC, 1 hour 750oC, 2 hours 750oC, 4 hours
T3 875oC, 1 hour 875oC, 2 hours 875oC, 4 hours
4.1 Sample Preparation
Sample preparation is outlined inFigure 12. PVP and Ga(NO3)3nanofiber mesh sectioned into 39 mm x 15 mm strips was shaped around a 12 mm diameter steel mandrel coated with Teflon tape and sealed using heat to produce 15 mm tall, 12 mm diameter tubes.
(a)
(b)
(c)
Figure 12:The PVP and Ga(NO3)3nanofiber mesh is a) shaped into 15 mm tall and 12 mm diameter
CONTAINS LLNL PROPRIETARY INFORMATION 4.2 Mechanical Testing
Using 5o
C/min rates, the tubes were held in a round fused-quartz crucible and heat treated first to 1,000oC and second to the sintering temperature for the given sintering time in
Table III. The CNF tubes were cooled in the furnace to room temperature at 5oC/min.
4.2 Mechanical Testing
A minimum sample size (N) of 26 calcined tubes from each heat treatment were measured across the middle of their tubular cross-section and diametrally compression tested in an Instron-Mini 50 universal mechanical tester with a crosshead speed of 0.3 mm/min and a 50 N static load cell (Figure 13). Tubes isothermally sintered at 1,000o
C with variable cross-sectional areas were compression tested under the same conditions.
Figure 13:Mechanical testing experimental setup.
Weibull statistics were performed for each heat treatment yield stress to determine the respective Weibull modulus. Using MiniTab, the Anderson-Darling goodness test determined the Weibull and lognormal distribution fit, and non-parametric Kruskal-Wallis tests were used to compare the isothermal and TSS strength medians.
4.3 Microstructural Characterization
CONTAINS LLNL PROPRIETARY INFORMATION 4.3 Microstructural Characterization
Siemens Diffraktometer D5000 using 0.15406 nm, Cu K-αradiation, a scan rate of 2 de-grees/min from 20 to 80o2θ, and an increment of 0.005.
τ= 0.9λ
βcos(θ) (8)
SEM images taken on an FEI Quanta 200 were processed to determine post-heat treatment fiber diameter, porosity, and pore size for the strongest CNF microstructures. The fiber diameter distribution is measured using ImageJ, an image processing software, at different magnifications. Porosity and pore size distributions were determined by first converting the gray-scale SEM image to a highly contrasted, or threshold, image in ImageJ and then using an app in MATLAB to calculate the size and area fraction of dark region [51]. Porosity and pore size distribution were determined for a standardized magnification of 50,000x with outputs similar toFigure 14.
CONTAINS LLNL PROPRIETARY INFORMATION
5
R
ESULTS
The sinteredβ-Ga2O3CNF tubes severely deformed from their original cylindrical shape. The contact area between the compression platens and the CNF specimens varied between samples, which introduces systematic error into the strength measurements. Additionally, the cross-sectional area was variable across the length of the tubes and is highly porous. Porosity and wall thickness variation introduces additional scatter to the strength data.
5.1 Mechanical Properties
There are two options for defining CNF tube fracture strength; the yield stress (σy) and
the maximum stress (σm). The CNF tubes exhibited two stress-strain behaviors; cellular
and brittle. The dashed stress-strain curve inFigure 15is characteristic of pseudo-plastic, cellular damage accumulation and strength loss, while the solid curve shows strengthening after brittle fracture from pore crushing and subsequent densification [52]. The yield stress is measured as the stress applied where the first significant drop, defined as a sharp 25% loss, in strength occurs. The yield stress is chosen to represent CNF tube strength to eliminate most outliers and determine where fracture begins to initiate.
CONTAINS LLNL PROPRIETARY INFORMATION 5.1 Mechanical Properties
CNF strength is highly influenced by component geometry (Table IV). Compared to tubes provided by LLNL with diameters equal to about 2.3 mm, the experimental geometry yields tubes of about 4.6 mm diameter that are, on average,∼87% weaker.
Table IV:Volume Effects onβ-Ga2O3CNF Isothermal Strength
Profile Average Tube Diameter (mm) N σy(kPa) s (kPa)
Iso, LLNL 2.34 36 24.9 16.5
Iso, Own 4.62 26 3.36 1.61
The isothermally treated tube strength data fit both Weibull and lognormal distributions, characteristic of porous ceramic materials (Figure 16) [53, 54]. The Weibull fit validates the use of Weibull statistics for comparing isothermally sintered CNF strength.
(a) (b)
(c) (d)
Figure 16:Isothermally sintered CNF strength fit with a) Weibull distributions and b) lognormal distributions. The c) Weibull and d) lognormal fits confirm validity of Weibull statistics.
The average yield strength is listed for the isothermally sintered and two-step sintered specimens inTable V. Each 2 hour and 4 hour TSS profile on average produced stronger CNF tubes with increasing temperature. The strongest CNF tube produced was with a 2 hour, 875o
CONTAINS LLNL PROPRIETARY INFORMATION 5.1 Mechanical Properties
Table V:Two-Step Sinteringβ-Ga2O3CNF Strength
Temperature Time N σy(kPa) s (kPa)
625oC
1 hr 32 2.29 1.11
2 hr 30 4.54 2.06
4 hr 28 3.69 2.21
750oC
1 hr 30 2.47 1.74
2 hr 30 5.20 2.30
4 hr 29 4.13 2.44
875o
C
1 hr 30 3.17 2.13
2 hr 30 5.72 2.89
4 hr 29 5.49 2.06
The TSS strength distributions fit Weibull and lognormal distributions, justifying Weibull statistics for reliability calculations across all CNF heat treatments (Figure 17).
(a) (b)
(c) (d)
CONTAINS LLNL PROPRIETARY INFORMATION 5.1 Mechanical Properties
Each heat treatment produced unreliable and weak CNF components (Figure 18). The strength data moderately fit a single linear Weibull trendline; however, the trendline can be broken into multiple linear fits at lower and higher strengths.
(a) (b)
(c) (d)
Figure 18:CNF tube strength Weibull plots for a) 1 hour TSS, b) 2 hour TSS, c) 4 hour TSS, and d) isothermal sintering.
CONTAINS LLNL PROPRIETARY INFORMATION 5.1 Mechanical Properties
Table VI:β-Ga2O3CNF Weibull Parameters
Profile Temperature Time N σo(kPa) m (σo,0.05,σo,0.95) (m0.05, m0.95)
TSS
625oC
1 hr 32 2.60 2.09 (2.23 , 3.04) (1.58 , 2.54)
2 hr 30 5.14 2.39 (4.47, 5.92) (1.79 , 2.91)
4 hr 28 4.19 1.77 (3.44 , 5.11) (1.31, 2.17)
750oC
1 hr 30 2.76 1.64 (2.25, 3.39) (1.23, 2.00)
2 hr 30 5.86 2.58 (5.15, 6.68) (1.93, 3.15)
4 hr 29 4.66 1.89 (3.89, 5.59) (1.41, 2.31)
875oC
1 hr 30 3.57 1.75 (2.95, 4.33) (1.31, 2.13)
2 hr 30 6.49 2.20 (5.58, 7.57) (1.65, 2.68)
4 hr 29 5.58 2.61 (4.90, 6.37) (1.94, 3.19) Iso, LLNL 1,000oC 1 hr
36 27.9 1.58 (23.0, 33.8) 1.22, 1.90) Iso, Own 1,000o
C 1 hr 26 3.85 1.92 (3.19, 4.66) (1.40, 2.37) For non-normal distributions, the analysis of variance between medians using the Kruskal-Wallis test is recommended. The most significantly different TSS profiles withα= 0.01 are the 2 hour and 4 hour, 875o
C and the 2 hour 750o
C TSS profiles (Figure 19).
(a) (b)
(c)
Figure 19:The analysis of variance between medians yielding p-values equal to 0.002, 0.0005, and 0.0045 when the a) 750oC, 2 hour, b) 875oC, 2 hour, and c) 875oC, 4 hour TSS strength distributions
CONTAINS LLNL PROPRIETARY INFORMATION 5.2 Microstructural Characteristics
5.2 Microstructural Characteristics
Surface characterization was performed at 500x magnification for each of the significantly stronger CNF microstructures (Figure 20). The surface morphology is extensively flawed with macropores and cracking, and the microstructure appears to be open-celled.
(a) (b)
(c) (d)
Figure 20:Surface morphology at 500x maginification of a) isothermally sintered CNFs, b) the 750oC
and c) 875oC 2 hour TSS CNFs, and d) the 4 hour 875oC TSS CNFs.
CONTAINS LLNL PROPRIETARY INFORMATION 5.2 Microstructural Characteristics
The TSS CNFs are more densely packed and grains can be seen to span the fiber diameter. Slight de-sintering is observed in the 875oC micrographs (Figure 21c and d).
(a) (b)
(c) (d)
Figure 21:Representative SEM images at 50,000x maginification of a) isothermally sintered CNFs, b) the 750oC and c) 875oC 2 hour TSS CNFs, and d) the 4 hour 875oC TSS CNFs.
The CNF diffraction pattern is the same shape as the reference with highly broadened peaks due to the nanocrystalline microstructure; however, the shift in diffraction angle suggests there are other Ga2O3polymorphs, significant lattice strain, or displacement errors present (Figure 22). The CNF (0 0 2) peak, located around∼29.5o
CONTAINS LLNL PROPRIETARY INFORMATION 5.2 Microstructural Characteristics
2o
. Higher 2θangles, such as the peak corresponding to the (5 1 2) plane typically located at
∼64o, are shifted even further. This may be attributed either to displacement error during
measurement or inherent porosity causing lattice spacing to expand by∼10% larger than the reference.
Figure 22:CNF diffraction pattern with significant peak displacement errors, masking peak matching withβ-Ga2O3reference pattern.
Crystallite size is determined by the (0 0 2) peak (Table VII). The isothermally sintered crystallite size is 32.2 nm, while most TSS profiles produced smaller CNF crystallites with the exception of the 750o
CONTAINS LLNL PROPRIETARY INFORMATION 5.2 Microstructural Characteristics
Table VII:β-Ga2O3CNF (0 0 2) Crystallite Size
Profile Temperature Time 2θ(o
) β(rads) τ(nm)
TSS
625oC
1 hr 29.515 6.98E-3 20.5
2 hr 29.46 6.72E-3 21.3
4 hr 29.415 5.88E-3 24.4
750oC
1 hr 29.445 6.37E-3 22.5
2 hr 29.605 5.15E-3 27.9
4 hr 29.39 4.36E-3 32.9
875oC
1 hr 29.515 5.67E-3 25.3
2 hr 29.55 4.71E-3 30.4
4 hr 29.355 5.32E-3 26.9 Iso, Own 1,000oC 1 hr
29.31 4.45E-3 32.2
Using the images in Figure 21, porosity, the pore size distribution, and the fiber size distribution is determined. Porosity is directly correlated with CNF average yield stress (Figure 23). Of the significantly strengthening TSS profiles, the CNF tube with the lowest porosity or highest density was the 875o
C 2 hour profile at 49%. Compared to the isothermally sintered tubes, the TSS CNFs are much denser.
Figure 23:CNF characteristic strength, with 90% confidence, is inversely proportional to porosity.
CONTAINS LLNL PROPRIETARY INFORMATION 5.2 Microstructural Characteristics
(a) (b)
(c) (d)
Figure 24:Pore size distribution for the a) isothermally sintered CNFs, b) the 750oC and c) 875oC 2
hour TSS CNFs, and d) the 4 hour 875oC TSS CNFs.
The fiber diameter distribution is best fit by a lognormal distribution (Figure 25). At low magnifications, there are many large fibers on the tube surface, but as magnification is increased, much smaller fibers appear within the microstructure.
CONTAINS LLNL PROPRIETARY INFORMATION 5.2 Microstructural Characteristics
The microstructural characteristics are summarized inTables VIII and IX. Compared to the isothermally sintered CNFs, the TSS tubes are more dense with nearly the same pore sizes (Pr). The fiber diameters (fd) are larger at longer sintering times, similar to the crystallite size.
Table VIII:β-Ga2O3CNF Porosity Characteristics
Profile Temperature Time Pr(nm) s (nm) Pr, max(nm) Porosity (%) TSS
750oC 2 hr
42.8 37.7 247 55.6
875oC 2 hr 42.6 34.1 251 49.1
4 hr 60.1 45.2 308 51.1 Iso, Own 1,000oC 1 hr 52.1 41.7 248 64.3
Table IX:β-Ga2O3CNF Fiber Diameters
Profile Temperature Time fd(nm) s (nm) TSS
750oC 2 hr 87.9 20.0
875o
CONTAINS LLNL PROPRIETARY INFORMATION
6
D
ISCUSSION
β-Ga2O3CNF mechanical properties are influenced by geometrical constraints and mi-crostructural consequences of two-step sintering. The post-sintering specimens were ex-tremely distorted from their original tubular shape. The contact area between the compres-sion platens and the specimen was variable as most tubes were nearly tetrahedral shaped. This undesirable geometry does not distribute loads evenly and may lead to much lower strength values than expected. The tetrahedral geometry is also undesirable for LLNL’s pur-pose, as the cross-sections at the tube ends were elliptic rather than circular. An elliptic cross-section requires more power to force air through the tube, increasing the pressure drop and operating cost. In order to produce reliable results, tube geometry control requires refinement.
The severe volumetric shrinkage undergone during the high-temperature step determines the overall effectiveness of TSS. The high-temperature step determines the degree to which grain boundary mobility is limited and densification is maximized during the sintering dwell. Densification during the sintering dwell is the main driving force for enhancing porous ceramic strength [53]. Further investigation into the high-temperature step is required to fur-ther optimize grain growth suppression, densification, and strength. If the high-temperature step were optimized, there would ideally be no grain growth between the 2 hour and 4 hour sinterings. Because there is a slight amount of grain growth as sintering time and temperature increases, other microstructural characteristics like fiber diameter are affected. Unsuppressed grain growth may lead to fiber enlargement, de-sintering, and reduced strength. Conversely, if the sintering time is too short, the slow kinetics of densification will not produce a structure dense enough to handle any significant loading. The sintering temperature should also be high enough to densify the microstructure in a timely manner, while reducing de-sintering effects from constrained fibers.
CONTAINS LLNL PROPRIETARY INFORMATION
the relationship between porosity and strength.
The multiple modes of fracture and the multiple Weibull trendlines suggest there are multiple flaw distributions. The CNF tubes fracture due to defects; however, there are both surface defects and volume defects present. Large surface defects could have caused speci-mens to prematurely fail, skewing the strength distribution towards lower values. This can account for the lognormal fit.
The significant peak shift observed in the XRD data do not provide accurate quantitative crystallite sizes, but peak broadness may still comparable across different sintering profiles. CNF strength increased with crystallite size, except for the case of the isothermally sintered tubes which had a much higher porosity. The 875o
CONTAINS LLNL PROPRIETARY INFORMATION
7
C
ONCLUSIONS
1. With a high-temperature step of 1,000o
C, two-step sintering strengthensβ-Ga2O3CNFs optimally with a 2 hour, 875oC sintering dwell, enhancing the average yield stress from
3.36 kPa to 5.72 kPa. However, the components are considered unreliable using Weibull statistics, yielding a Weibull modulus of 2.20.
2. Two-step sintering successfully supresses grain growth at extended sintering times and densifies CNF microstructure at higher sintering temperatures. The minimal grain growth observed points to subprime high-temperature step parameters, where a threshold densification responsible for freezing grain boundary mobility is not reached. 3. Porosity is the major flaw type and microstructural characteristic influencing the
CONTAINS LLNL PROPRIETARY INFORMATION
8
A
CKNOWLEDGEMENTS
CONTAINS LLNL PROPRIETARY INFORMATION
9
R
EFERENCES
[1] P. Mallick,Fiber-reinforced composites. New York: Marcel Dekker, 1993.
[2] C. Zetterling, "Integrated circuits in silicon carbide for high-temperature applications", MRS Bulletin, vol. 40, no. 05, pp. 431-438, 2015.
[3] R. Brown and B. Bellman, "Survey of the Biological Effects of Refractory Ceramic Fibres: Overload and Its Possible Consequences", The Annals of Occupational Hygiene, vol. 49, no. 4, pp. 295-307, 2005.
[4] H. Tan, X. Ma and M. Fu, "Preparation of continuous alumina gel fibres by aqueous solâ ˘A¸Sgel process", Bulletin of Materials Science, vol. 36, no. 1, pp. 153-156, 2013.
[5] D. Li and Y. Xia, "Electrospinning of Nanofibers: Reinventing the Wheel?", Advanced Materials, vol. 16, no. 14, pp. 1151-1170, 2004.
[6] H. Wu, W. Pan, D. Lin and H. Li, "Electrospinning of ceramic nanofibers: Fabrication, assembly and ap-plications", Journal of Advanced Ceramics, vol. 1, no. 1, pp. 2-23, 2012.
[7] P. Panda, "Ceramic Nanofibers by Electrospinning Technique - A Review", Transactions of the Indian Ceramic Society, vol. 66, no. 2, pp. 65-76, 2007.
[8] G. Hussein, "Rare earth metal oxides: formation, characterization and catalytic activity Thermoanalyti-cal and applied pyrolysis review", Journal of AnalytiThermoanalyti-cal and Applied Pyrolysis, vol. 37, no. 2, pp. 111-149, 1996.
[9] M. Rahaman,Ceramic Processing and Sintering, 2nd ed: Taylor and Francis, 2003.
[10] H. Esfahani, R. Jose and S. Ramakrishna, "Electrospun Ceramic Nanofiber Mats Today: Synthesis, Properties, and Applications", Materials, vol. 10, no. 11, p. 1238, 2017.
[11] J. Stitzel, J. Liu, S. Lee, M. Komura, J. Berry, S. Soker, G. Lim, M. Van Dyke, R. Czerw, J. Yoo and A. Atala, "Controlled fabrication of a biological vascular substitute", Biomaterials, vol. 27, no. 7, pp. 1088-1094, 2006.
[12] Ramakrishna, S., Fujihara, K., Teo, W., Yong, T., Ma, Z. and Ramaseshan, R. "Electrospun nanofibers: solving global issues, Materials Today, 9(3), pp.40-50, 2006.
[13] K. Mondal, "Recent Advances in the Synthesis of Metal Oxide Nanofibers and Their Environmental Re-mediation Applications", Inventions, vol. 2, no. 2, p. 9, 2017.
CONTAINS LLNL PROPRIETARY INFORMATION
[15] S. Meille, M. Lombardi, J. Chevalier and L. Montanaro, "Mechanical properties of porous ceramics in compression: On the transition between elastic, brittle, and cellular behavior", Journal of the European Ceramic
Society, vol. 32, no. 15, pp. 3959-3967, 2012.
[16] C. Barry Carter and M. Grant Norton,Ceramic Materials: Science and Engineering, New York: Springer-Verlag, 2013.
[17] V. Salvini, V. Pandolfelli and D. Spinelli, "Mechanical Properties of Porous Ceramics", 2018.
[18] N. Savchenko, T. Sablina, I. Sevostyanova, S. Buyakova and S. Kulkov, "Deformation and Fracture of Porous Brittle Materials Under Different Loading Schemes", Russian Physics Journal, vol. 58, no. 11, pp. 1544-1548,
2016.
[19] A. Butcher, C. Koh and M. Oyen, "Systematic mechanical evaluation of electrospun gelatin meshes", Journal of the Mechanical Behavior of Biomedical Materials, vol. 69, pp. 412-419, 2017.
[20] A. Mahdi, M. Mustapa, A. Tobi and I. Zaman, "Micro-Hardness and Compression Strength of Particle Sizes Recycling Aluminium Alloy AA6061 Using Powder Metallurgy Method", Materials Science Forum, vol. 887,
pp. 74-82, 2017.
[21] K. Miyake, Y. Hirata, T. Shimonosono and S. Sameshima, "The Effect of Particle Shape on Sintering Behavior and Compressive Strength of Porous Alumina", Materials, vol. 11, no. 7, p. 1137, 2018.
[22] H. Ryou et al., "Below the Hall-Petch Limit in Nanocrystalline Ceramics", ACS Nano, vol. 12, no. 4, pp. 3083-3094, 2018.
[23] R. Chaim, M. Levin, A. Shlayer and C. Estournes, "Sintering and densification of nanocrystalline ceramic oxide powders: a review", Advances in Applied Ceramics, vol. 107, no. 3, pp. 159-169, 2008.
[24] A. Kumar, "Ceramics: Sintering and Microstructure", Ceramics and Colloids: TP3 Sintering.
[25] S. Kang,Sintering: Densification, Grain Growth, & Microstructure, Amsterdam: Elsevier, 2005.
[26] U. Sutharsini, M. Thanihaichelvan and R. Singh, "Two-Step Sintering of Ceramics", 2018.
[27] I. Chen and X. Wang, "Sintering dense nanocrystalline ceramics without final-stage grain growth", Na-ture, vol. 404, no. 6774, pp. 168-171, 2000.
[28] X. Wang, P. Chen and I. Chen, "Two-Step Sintering of Ceramics with Constant Grain-Size, I. Y2O3", Journal of the American Ceramic Society, vol. 89, no. 2, pp. 431-437, 2006.
CONTAINS LLNL PROPRIETARY INFORMATION
2018.
[30] F. Lange, "De-Sintering, A Phenomena Concurrent with Densification Within Powder Compacts: A Re-view", Sintering Technology, pp. 1-12, 1996.
[31] K. Momma and F. Izumi, "VESTA 3 for three-dimensional visualization of crystal, volumetric and mor-phology data", J. Appl. Crystallogr., 44, 1272-1276, 2011.
[32] S. Stepanov and V. Nikolaev, "Gallium Oxide: Properties and Applications - A Review", Review of Ad-vanced Materials Science, vol. 44, pp. 63-86, 2016.
[33] M. Santia, N. Tandon and J. Albrecht, "Lattice thermal conductivity inβ-Ga2O3from first principles",
Applied Physics Letters, vol. 107, no. 4, p. 041907, 2015.
[34] L. Reddy, Y. Ko and J. Yu, "Hydrothermal Synthesis and Photocatalytic Property ofβ-Ga2O3Nanorods",
Nanoscale Research Letters, vol. 10, no. 1, 2015.
[35] S. Arnold, S. Prokes, F. Perkins and M. Zaghloul, "Design and performance of a simple, room-temperature Ga2O3nanowire gas sensor", Applied Physics Letters, vol. 95, no. 10, p. 103102, 2009.
[36] S. Kang, B. Kang, Y. Song and D. Yoon, "Synthesis and structural properties ofβ-Ga2O3nanoparticles
by liquid phase precursor method", Materials Science and Engineering: B, vol. 173, no. 1-3, pp. 105-108, 2010.
[37] C. Sun, J. Deng, L. Kong, L. Chen, Z. Shen, Y. Cao, H. Zhang and X. Wang, "Structure and Photolumi-nescence Properties ofβ-Ga2O3Nanofibres Synthesized via Electrospinning Method", IOP Conference Series:
Materials Science and Engineering, vol. 275, p. 012046, 2017.
[38] T. Zhou, P. Chen, S. Hu, Y. Yan, W. Pan and H. Li, "Enhanced yellow luminescence of amorphous Ga2O3
nanofibers with tunable crystallinity", Ceramics International, vol. 42, no. 5, pp. 6467-6474, 2016.
[39] S. Park, N. Barakat, K. Jeong and H. Kim, "Polymer nanofiber-templated fabrication and characteriza-tion of gallium oxide nanofibers consisting of granular nanoparticles", Polymer Internacharacteriza-tional, vol. 60, no. 2, pp.
322-326, 2010.
[40] J. Zhao, W. Zhang, E. Xie, Z. Ma, A. Zhao and Z. Liu, "Structure and photoluminescence ofβ-Ga2O3:Eu3+
nanofibers prepared by electrospinning", Applied Surface Science, vol. 257, no. 11, pp. 4968-4972, 2011.
[41] J. Zhao, W. Zhang, E. Xie, Z. Liu, J. Feng and Z. Liu, "Photoluminescence properties ofβ-Ga2O3:Tb3+nanofibers
prepared by electrospinning", Materials Science and Engineering: B, vol. 176, no. 12, pp. 932-936, 2011.
CONTAINS LLNL PROPRIETARY INFORMATION
Bulletin, vol. 48, no. 6, pp. 2296-2303, 2013.
[43] Y. Zhao, R. Frost and W. Martens, "Synthesis and Characterization of Gallium Oxide Nanostructures via a Soft-Chemistry Route", The Journal of Physical Chemistry C, vol. 111, no. 44, pp. 16290-16299, 2007.
[44] J. Du, J. Zhao, Q. Luo, Z. Yu and J. Xia, "Growth of One-dimensional Gallium Nitride Nano- and Mi-crostructures in an Alumina Matrix Containing Gallium Oxide", Bulletin of the Korean Chemical Society, vol. 27,
no. 8, pp. 1235-1238, 2006.
[45] J. Du, J. Zhao, Q. Luo, Z. Yu, J. Xia and M. Yang, "Growth and Characteristics Analysis of the Thermal Oxide Grown on Gallium Nitride", 2009 Symposium on Photonics and Optoelectronics, 2009.
[46] C. Tang, Y. Bando and Z. Liu, "Thermal oxidation of gallium nitride nanowires", Applied Physics Let-ters, vol. 83, no. 15, pp. 3177-3179, 2003.
[47] J. Kelly, J. Haslam, L. Finkenauer and M. Mitchell, "NSRD-12, Novel Mini-Tubular HEPA Media for Nuclear Facility Ventilation Systems", 2018.
[48] R. Roy, V. Hill and E. Osborn, "Polymorphism of Ga2O3and the System Ga2O3-H2O", Journal of the American
Chemical Society, vol. 74, no. 3, pp. 719-722, 1952.
[49] V. Berbenni, C. Milanese, G. Bruni and A. Marini, "Thermal decomposition of gallium nitrate hydrate Ga(NO3)3xXH2O", Journal of Thermal Analysis and Calorimetry, vol. 82, no. 2, pp. 401-407, 2005.
[50] J. Shan, C. Li, J. Wu, J. Liu, A. Chen and Y. Shi, "Sintering behavior and microstructural evolution of the monodispersedβ-gallium oxide micro-particles with different morphology and size", Ceramics International, vol. 43, no. 18, pp. 16843-16850, 2017.
[51] A. Rabbani and S. Salehi, "Dynamic modeling of the formation damage and mud cake deposition us-ing filtration theories coupled with SEM image processus-ing", Journal of Natural Gas Science and Engineerus-ing, 42,
157-168, 2017.
[52] J. Seuba, S. Deville, C. Guizard and A. Stevenson, "The effect of wall thickness distribution on mechanical reliability and strength in unidirectional porous ceramics", Science and Technology of Advanced Materials, vol.
17, no. 1, pp. 128-135, 2016.
[53] P. de Wit, F. van Daalen and N. Benes, "The mechanical strength of a ceramic porous hollow fiber", Journal of Membrane Science, vol. 524, pp. 721-728, 2017.
CONTAINS LLNL PROPRIETARY INFORMATION
![Table I: Electrospinning Process Parameters Influencing Fiber Morphology [7]](https://thumb-us.123doks.com/thumbv2/123dok_us/8228929.2181375/10.892.140.751.520.972/table-i-electrospinning-process-parameters-influencing-fiber-morphology.webp)
![Figure 2: Scanning electron microscope images of (a) polyvinyl alcohol [PVA] nanofibers, (b) beading structural defects, and (c) an example of a collector drum modification to achieve fiber alignment [7].](https://thumb-us.123doks.com/thumbv2/123dok_us/8228929.2181375/11.892.121.790.289.509/scanning-microscope-polyvinyl-nanofibers-structural-collector-modification-alignment.webp)
![Figure 3: Crack nucleation and propagation in ceramic materials stressed in compression [16].](https://thumb-us.123doks.com/thumbv2/123dok_us/8228929.2181375/13.892.243.648.514.749/figure-crack-nucleation-propagation-ceramic-materials-stressed-compression.webp)
![Figure 4: Load-displacement curves for (a) typically brittle, linear elastic materials, such as dense ceramics, and (b) "pseudo-plastic" materials, such as high porosity ceramics [15].](https://thumb-us.123doks.com/thumbv2/123dok_us/8228929.2181375/14.892.122.765.688.924/figure-displacement-typically-materials-ceramics-materials-porosity-ceramics.webp)
![Figure 5: Weibull plot showing probability of survival as a function of fracture stress [16].](https://thumb-us.123doks.com/thumbv2/123dok_us/8228929.2181375/16.892.280.608.236.583/figure-weibull-showing-probability-survival-function-fracture-stress.webp)
![Figure 7: The isothermal and two-step sintering profiles, with respective microstructural evolution from densification and grain growth [26].](https://thumb-us.123doks.com/thumbv2/123dok_us/8228929.2181375/20.892.234.659.308.589/figure-isothermal-sintering-profiles-respective-microstructural-evolution-densification.webp)
![Figure 8: Evolution of fiber (a) with unconstrained grains (b, c) and constrained grains (b’, c’) [30].](https://thumb-us.123doks.com/thumbv2/123dok_us/8228929.2181375/21.892.311.587.653.886/figure-evolution-fiber-unconstrained-grains-b-constrained-grains.webp)
![Figure 9: VESTA simulated a) β-Ga 2 O 3 crystal structure and b) X-ray diffraction pattern [31-33]](https://thumb-us.123doks.com/thumbv2/123dok_us/8228929.2181375/23.892.113.794.176.379/figure-vesta-simulated-ga-crystal-structure-diffraction-pattern.webp)
![Figure 10: Comparison of pressure drop between traditional HEPA membranes, polymer nanofiber membranes, and CNF tubes [47].](https://thumb-us.123doks.com/thumbv2/123dok_us/8228929.2181375/24.892.202.689.294.637/figure-comparison-pressure-traditional-membranes-polymer-nanofiber-membranes.webp)
