ARTERIAL STIFFNESS AND PERIPHERAL ARTERIAL DISEASE AS INDICATORS OF ABDOMINAL AORTA DIAMETERS: THE ATHEROSCLEROSIS AND RISK IN
COMMUNITIES STUDY
Ada Al-Qunaibet
A dissertation submitted to the faculty at the University of North Carolina at Chapel Hill in partial fulfillment of the requirements for the degree of Doctor of
Philosophy in the Department of Epidemiology in the Gillings School of Global Public Health.
Chapel Hill 2016
ABSTRACT
Ada Al-Qunaibet: Arterial Stiffness and Peripheral Arterial Disease as Indicators of Ab-dominal Aorta Diameters: The Atherosclerosis and Risk in Communities Study
(Under the direction of Gerardo Heiss)
Background: Abdominal aorta (AA) dilatation (AAD) and aneurysms result from re-modeling that includes atherosclerotic and arteriosclerotic components. The latter frequently coexist across different arterial territories. Peripheral arterial disease (PAD) is an ischemic manifestation of atherosclerosis, while arterial stiffening (AS) primarily reflects arteriosclero-sis. Our aim was to examine PAD and AS as potential indicators of AAD. Methods: Cross-sectional analysis of data from the 5th examination of the Atherosclerosis Risk in Communi-ties cohort (2011-2013). 4,802 participants 70-89 years were included to examine the ciation between PAD and AAD, and 4,224 participants were included to examine the asso-ciation between AS and AAD. The anterior-posterior (AP) diameter of the AA was quantified by b-mode ultrasound at the proximal, mid-, and distal locations. The ankle-brachial index (ABI) and pulse wave velocity (PWV) were used to evaluate PAD and AS (central and pe-ripheral), respectively. Heart-carotid (hc) and carotid-femoral (cf) PWV were used to quantify central AS, and femoral-ankle (fa) PWV was used to measure peripheral AS. ABI and PWV measurements were performed using an automated non-invasive waveform analyzer.
spectively. A U-shaped association between ABI and AAD was observed at all three levels of the AA. A positive, linear association between hcPWV was observed at all the levels of the aorta as the only measure of AS exhibiting a consistent and statistically significant asso-ciation with AAD.
ACKNOWLEDGEMENTS
I would like to express my sincere gratitude to my advisor Prof. Gerardo Heiss for his support, patience, and unparalleled dedication. He has shaped my work and pushed me to be a better scientist.
Many thanks to Dr. Bill Miller for his mentorship and guidance. His support has helped me through the first few years of this program. I am also, deeply thankful to Dr. Laura Loehr for the time and effort that she has dedicated in reviewing my dissertation and related work. She was always generous with her time and assistance. My sincere thanks also goes to Dr. Alan Hinderliter and Dr. David Couper for being part of my dissertation committee and for providing me with valuable feedback throughout the process of completing my disserta-tion work.
Thanks to the staff at the University of North Carolina at Chapel Hill particularly; Carmen Woody, Valerie Hudock, and Jennifer Moore. I am forever grateful to Nancy Colvin for her help, guidance, and love. She has provided me with invaluable support and assis-tance through many of the challenges I faced during the program. I am also thankful for all the exceptional friendships that I have made during my time at UNC-CH. Their support and care helped through some challenging times.
TABLE OF CONTENTS
LIST OF TABLES ... xi
LIST OF FIGURES ... xii
LIST OF ABBREVIATIONS ... xiii
INTRODUCTION ... 1
CHAPTER 1: BACKGROUND ... 3
1.1. Atherosclerosis ... 3
1.1.1. Pathophysiology of atherosclerosis ... 3
1.1.2. Clinical implications of atherosclerosis ... 10
1.1.3. Subclinical atherosclerosis ... 14
1.2. Peripheral arterial disease ... 17
1.2.1. Methods to measure peripheral artery disease ... 18
1.2.2. Epidemiology of lower extremity PAD ... 19
1.2.3. Risk factors for peripheral artery disease ... 20
1.3. Abdominal aorta dilatation and aneurysm ... 21
1.3.1. Pathophysiology of AAD and AAA ... 21
1.3.2. Methods to measure AAD and AAA ... 22
1.3.3. Epidemiology of AAD and AAA ... 23
1.3.4. Risk factors ... 25
1.4. Arterial stiffness ... 25
1.4.1. Pathophysiology of arterial stiffness ... 25
1.4.2. Methods to measure arterial stiffness... 27
CHAPTER 2: STUDY AIMS AND HYPOTHESIS ... 29
CHAPTER 3: PUBLIC HEALTH RELEVANCE AND POTENTIAL CLINICAL IMPACT... 32
3.1. ABI and abdominal aorta diameters ... 33
3.2. PWV and abdominal aorta diameters ... 33
CHAPTER 4: RESEARCH DESIGN AND METHODS ... 35
4.1. Study design... 35
4.2. Study population ... 35
4.3. AAD: Measurements and data quality ... 36
4.4. Arterial stiffness and PAD: Measurements and data quality ... 38
4.5. Statistical analyses overview ... 41
4.5.1 Distribution of PAD... 43
4.5.2 Distribution of AADs ... 43
4.5.3 Strength of association between PAD and AADs ... 43
4.5.4 Assess covariates as confounders and effect modifiers for the associations between ABI and AADs ... 44
4.5.5 Distribution of central and peripheral arterial stiffness ... 46
4.5.6 Strength of association between arterial stiffness and AADs ... 46
4.5.7 The role of identified covariates on the associations between PWV (central and peripheral) and AADs... 47
CHAPTER 5: MANUSCRIPT 1- PERIPHERAL ARTERIAL DISEASE AS AN INDICATOR OF ENLARGED ABDOMINAL AORTA DIAMETERS. THE ATHEROSCLEROSIS RISK IN COMMUNITIES (ARIC) STUDY. ... 50
5.1 Introduction ... 50
5.2 Methods ... 52
5.2.1 Study population ... 52
5.3 Results ... 55
CHAPTER 6: MANUSCRIPT 2- ARTERIAL STIFFNESS AS AN INDICATOR OF ENLARGED ABDOMINAL AORTA DIAMETERS.
THE ATHEROSCLEROSIS RISK IN COMMUNITIES (ARIC) STUDY. ... 64
6.1 Introduction ... 64
6.2 Methods ... 65
6.2.1 Study population ... 65
6.2.2 Statistical analysis... 68
6.3 Results ... 69
6.4 Discussion ... 71
CHAPTER 7: MANUSCRIPT 3-THE ANKLE-BRACHIAL INDEX AND PULSE WAVE VELOCITY AS STATISTICAL PREDICTORS OF AAD ... 80
CHAPTER 8: DISCUSSION ... 81
8.1 Recapitulation of overall specific aims ... 81
8.2 Discussion of results... 81
8.3 Degree to which the goals of doctoral research have been met ... 84
8.4 Strengths and limitations ... 85
8.5 Future directions ... 85
APPENDIX 1: IRB CERTIFICATION ... 87
APPENDIX 2: NONINVASIVE AND INVASIVE VASCULAR DIAGNOSTIC TOOLS (HIRSCH ET AL., 2006) ... 89
APPENDIX 3: INDICES OF ARTERIAL STIFFNESS (CHIRINOS, 2012) ... 91
APPENDIX 4: AAA OVER-READER DATA COLLECTION FORM ... 92
LIST OF TABLES
LIST OF FIGURES
LIST OF ABBREVIATIONS
AAD abdominal aorta diameter AAA abdominal aortic aneurysm AHA American Heart Association ABI ankle-brachial index
AP anterior-posterior AUC area under the curve
ARIC Atherosclerosis and Risk in Communities AS arterial stiffness
cfPWV carotid-femoral pulse wave velocity CIMT carotid intima-media thickness CIHD chronic ischemic heart disease
CT computed tomography
CAC coronary artery calcification
CARDIA Coronary Artery Risk Development in Young Adults CHD coronary heart disease
CAD coronary artery disease DALY’s disability-adjusted life years ECG electrocardiogram
faPWV femoral-ankle pulse wave velocity FHS Framingham Heart Study
hcPWV heart-carotid pulse wave velocity ICC intra-class correlation coefficient IHD ischemic heart disease
MDC95 minimal detectable change
MESA Multi-Ethnic Study of Atherosclerosis MI myocardial infarction
NHANES National Health and Nutrition Examination Survey NHLBI National Heart, Lung, and Blood Institute
NRI net reclassification improvement PAD peripheral artery disease
PWV pulse wave velocity QC quality control RAS renal artery stenosis
INTRODUCTION
The proposed doctoral research related the main features of atherosclerosis, namely atherosis and sclerosis, to abdominal aorta diameters and aortic aneurysms in a biracial co-hort of 6,538 men and women aged 72-84 years. The atherotic component was indexed by the presence of lumen-occupying atherosclerotic lesions in the lower extremities, identified non-invasively by a reduced ankle-brachial index (ABI). The sclerotic element was meas-ured by pulse wave velocity (PWV) in the central and peripheral arterial territories. The ab-dominal aorta diameter (AAD) that served as the dependent variable was statistically pre-dicted cross-sectionally from the above-referenced measurements.
The dissertation focused on abdominal aorta diameters measured by abdominal ul-trasound as the dependent variable. The first aim characterized the relationship between peripheral artery disease (PAD) measured by ABI and diameters of the abdominal aorta at proximal, mid-, and distal locations. A second aim characterized the relation between central arterial stiffness (measured by heart-carotid pulse wave velocity), peripheral arterial stiffness (measured by femoral-ankle pulse wave velocity), and the diameters of the abdominal aorta at a proximal, mid-aorta, and distal locations. The third aim was to develop and evaluate a statistical predictive model that utilizes ABI and PWV to classify AAD at clinically meaningful levels.
CHAPTER 1: BACKGROUND
1.1. Atherosclerosis
1.1.1. Pathophysiology of atherosclerosis
Structural components of the wall of medium and large arteries
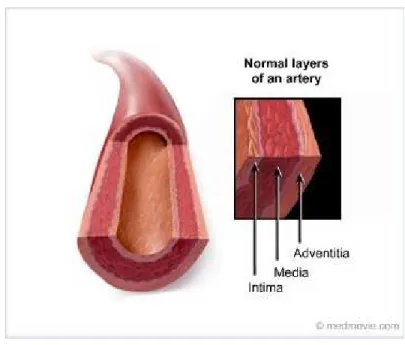
The arterial wall is made up by three main layers (figure 1); tunica intima, tunica me-dia, and tunica adventitia from the lumen outward (Lâevy & Tedgui, 1999; Lusis, 2000; Safar, Levy, & Struijker-Boudier, 2003). The biological mechanisms of atherosclerosis are caused by molecular and cellular processes that mainly affect the intimal layer of arterial vessels (Stary et al., 1992). The tunica intima is the innermost layer that is adjacent to the arterial lumen. It is separated from the adjacent tunica media by the internal elastic lamina.
Tunica intima: The tunica intima is composed of two layers; the innermost layer is comprised of connective tissue called proteoglycan, and the outer layer is comprised of smooth muscle cells and elastic fibers. Variations in blood flow strength and wall tension af-fect the tunica intima, resulting in physiological changes that cause thickening of this struc-ture (Stary et al., 1992). Therefore, the arterial segments with disturbed blood flow and ab-normal laminar sheer stress, such as branching points and bifurcations in the arterial tree, are more prone to develop atherosclerosis (Libby, 2000; Stary et al., 1992).
Tunica media: The tunica media constitutes the thickest layer, and its constituents are smooth muscle cells that secrete elastin and collagen proteins. The ratio of elastin to collagen varies along the arterial tree (Lâevy & Tedgui, 1999). Large elastic arteries more proximal to the heart contain more elastin compared to collagen, while more distal to the heart the ratio is reversed. A threshold point in this respect is found near the diaphragm where the abdominal aorta begins (Safar et al., 2003). The tunica media of muscular arter-ies is predominantly made up of smooth muscle cells with less elastin and connective tissue. Therefore, medium muscular arteries are capable of changing their diameter under neuro-humoral stimulation (Lâevy & Tedgui, 1999).
Definition of atherosclerosis
Atherosclerosis is defined as a systemic disease process, and inflammatory changes are part of its pathophysiology. Fatty deposits, inflammatory cells, and scar tissue build up within the sub-intimal space of arteries (Libby, 2000; Ross, 1999). Atherosclerotic changes affect primarily large and medium-sized elastic and muscular arteries (Ross, 1999). Inflam-matory, molecular, and cellular processes that mainly affect the intimal layer of arterial ves-sels are involved in the biological mechanisms of atherosclerosis (Ross, 1999; Stary et al., 1992). Worldwide, cardiovascular morbidity and mortality are predominantly attributed to the sequelae of atherosclerosis (Go et al., 2013).
Below we combine the typology of the levels of atherosclerosis with the description of the dynamic process involved in atherogenesis.
Figure 1. Arterial wall structure.
Stages and types of atherosclerosis
Atherosclerosis starts in the peripubertal life epoch and progresses through stages, typically identified as initiation, progression, and complication (Libby, 2000; Scott, 2002; Stary et al., 1994). Atherosclerotic lesions have been systematized according to their cellu-lar components and pathophysiological progression of the disease into six types. The initial and intermediate lesions include types I, II, and III. Advanced atherosclerotic lesions are subdivided into 3 types: IV, V, and VI (Stary et al., 1992; Stary et al., 1995; Stary et al., 1994). Of the aforementioned, types I and II are the only two that can exist in children (Stary et al., 1994).
Initial and intermediate atherosclerotic lesions: Type I (fatty streaks) — Fatty streaks are microscopic lipid deposits in the intimal layer that represent adaptive changes rather than an atherosclerotic transformation. Lipid is deposited in macrophages in an isolated manner forming foam cells (macrophages that contain lipid molecules). This type of lesion is common among children and young adults (Stary, 1994; Stary et al., 1994).
and progression of type II lesions usually occurs in commonly susceptible parts of the arteri-al tree. Mechanicarteri-al forces in these susceptible parts of the tree cause an influx of plasma lipoproteins (Cornhill, Herderick, & Stary, 1990; Glagov, Zarins, Giddens, & Ku, 1988; Stary et al., 1994). Common locations for type II lesions include: coronary arteries, aortic arch, de-scending thoracic aorta, and abdominal aorta. Only a small subgroup of type II (progression-prone IIa) lesions progress to type III lesions in the absence of elevated harmful lipoproteins. Conversely, progression of type IIb (progression-resistant) lesions may not occur, and it takes a longer lag time and higher levels of harmful lipoproteins to occur. In the aorta, the progression of type II lesions commonly occurs in the posterolateral walls (left and right) and at common iliac arteries bifurcation (Stary et al., 1994).
Type III —Type III lesions are the intermediate lesions between type II and athero-ma; they are also called transitional lesions. Histologically, type III lesions exhibit the pres-ence of extra-cellular lipid droplets infiltrating the layers of smooth muscle cells. This infiltra-tion interrupts the unity of the smooth muscle cells present in the intimal layer (Stary et al., 1994).
Advanced atherosclerotic lesions: Based on histological characteristics, advanced atherosclerotic lesions are subdivided into three types; IV, V, and VI. Atherosclerosis mor-bidity and mortality is mostly due to complicated type IV and type V lesions, transforming them into type VI lesions. Changes in advanced atherosclerotic lesions cause disfiguration of the arterial wall due to intimal thickening and repair. These changes will consequently cause narrowing of the arterial lumen (Stary et al., 1995).
in-ing commonly occurs. Therefore, atheroma originally exists as an eccentric lesion (Stary et al., 1992; Stary et al., 1995), and at this stage the arterial lumen is preserved with no evident stenosis (Glagov, Weisenberg, Zarins, Stankunavicius, & Kolettis, 1987; Stary et al., 1992). Cellular and morphologic changes that occur include: elongation of smooth muscle cells, thickening of their basement membranes, and calcium deposits. In addition, there is new capillary formation, proteoglycans, foam cells, and macrophages primarily at the lipid core margins. Type IV lesions, compared to type V lesions, contain less collagen and fibrous tis-sue (Stary et al., 1995).
Figure 2. Atheroma formation and complications.
Type V — In type V lesions there is additional fibrous connective tissue formation, which causes more evident narrowing of the arterial lumen. Cellular and morphologic changes that occur include: collagen accumulation, smooth muscle cells containing rough-surfaced endoplasmic reticulum, and larger and more numerous capillaries. In this
ad-vanced type of atherosclerotic lesion, there is involvement of the tunica media and adventitia in the form of accrual of foam cells, macrophages, and lymphocytes. Type V lesions are prone to complications that include hematoma, fissures, and/or thrombus formation. Type V lesions are further subdivided by cellular variations into types Va, Vb, and Vc (Stary et al., 1995).
Type Va is also called a fibroatheroma; it may be multi-layered, containing more than one lipid core that may form in more than one dimension. The multi-directional lipid core formation causes narrowing of the arterial lumen. Commonly the lipid core furthest from the tunica intima will form first. Multiple lipid core formations and fibrosis can be the result of a complicated initial lipid core caused by hematoma, fissure formation, or thrombosis followed by fibroses and further accumulation of foam cells and lipids (Stary et al., 1995). Type Vb is similar to Va, however it contains more calcification and mineral deposition. Type Vc con-tains more fibrotic tissue, and in this subtype fibrotic convective tissue replaces the normal tunica intima (Stary et al., 1995).
Natural history of atherosclerosis: As mentioned previously, atheromatous lesions may develop morphological complications that include hematomas, fissures, ulcers, and thrombosis (Stary et al., 1995). Complicated atherosclerotic changes lead to subclinical cen-tral changes, most commonly coronary artery calcification (CAC) and carotid intima-media thickening (CIMT). Other lesions include renal artery stenosis (RAS) and peripheral artery disease (PAD). Atherosclerosis is a progressive disease that commonly affects various arte-rial beds. Therefore the aforementioned subclinical atherosclerotic manifestations frequently coincide (Go et al., 2013; Imori et al., 2014). The progression and complications of athero-sclerosis depend on the severity and location of the lesion and trigger factors.
1.1.2. Clinical implications of atherosclerosis
Clinical manifestations
The main clinical manifestations of atherosclerosis include coronary heart disease (CHD), myocardial infraction (MI), and stroke.
Methods to assess acute, clinical manifestations atherosclerosis
Clinical signs and symptoms are commonly used to assess clinical manifestations of atherosclerosis, with the aid of a number of methods used to confirm the diagnosis. The lat-ter include electrocardiogram (ECG), cardiac biomarkers, computed tomography (CT), and magnetic resonance imaging (MRI) (Anderson et al., 2011). The clinical manifestations of atherosclerosis and their measurement in different arterial territories and target organs are outside the scope of this research and will not be developed here.
Epidemiology
Population distribution of atherosclerosis
Ma-jor complications due to atherosclerotic changes in the aforementioned arterial territories include CHD, MI, stroke, PAD, and abdominal aortic aneurysms (AAAs) (Go et al., 2014).
It is estimated that at least one in three Americans has one type of cardiovascular disease, and a little over half of the cases affect adults sixty years of age or older (Go et al., 2014). Age-standardized death rates due to cardiovascular disease are estimated to have decreased by 1.1% per year for males and 1.25% per year for females during the last two decades, although due to an aging population the total number of deaths is projected to in-crease by 6.6 million from 2002 to 2030. In 2002, ischemic heart disease (IHD) and cere-brovascular disease were ranked as the first and second leading causes of death and the sixth and seventh leading causes of disability-adjusted life years (DALY’s) globally. They are projected to remain the first two leading causes of death in 2030, and to move up to the third and sixth leading causes of DALY’s globally (Mathers & Loncar, 2006).
Coronary heart disease (CHD)
The overall prevalence of CHD in U.S. adults twenty years or older is 6.4%, extrapo-lated from the National Health and Nutrition Examination Survey (NHANES) 2007-2010 data (NHLBI tabulation), and CHD prevalence is projected to increase 18% by 2030 (Heidenreich et al., 2011). In 2010 alone, the prevalence of CHD was estimated to be 15.4 million, and in 2014 it is estimated that 620,000 Americans will have a new coronary attack (Go et al., 2014).
Myocardial infarction (MI)
Stroke
The prevalence of stroke in the United States is estimated at 2.8% (using NHANES data 2007-2010) (Go et al., 2014). The AHA projects an overall increase of 20% in the prev-alence of stroke by the year 2030 (Ovbiagele et al., 2013). The projected increase is fore-seen to affect men, women, and all ethnic groups (Ovbiagele et al., 2013). Approximately 795,000 individuals experience a stroke; 76.7% are a first attack, 23.3% are a recurrent at-tack, and 87% of strokes are due to ischemia (Go et al., 2013). The population distribution of stroke is affected by gender, age, and ethnicity (Go et al., 2013).
Risk factors
Atherosclerosis is a multifactorial disease, and various risk factors are involved to varying degrees in its development and complications. Well-established and widely replicat-ed risk factors for atherosclerosis include both modifiable and non-modifiable factors. Modi-fiable risk factors include elevated blood pressure, cigarette smoking, diabetes mellitus, and abnormal lipid levels. Non-modifiable risk factors include aging, gender, and family history (Go et al., 2014).
Elevated blood pressure
It is estimated that almost eighty million Americans suffer from elevated blood pres-sure (Go et al., 2014). It is significantly associated with atherosclerotic lesions (Solberg & Strong, 1983) and is a strong determinant of stroke (Go et al., 2014). According to estimates from a number of NHLBI studies, around three quarters of first stroke attacks occur in indi-viduals with blood pressure levels over 140/90 mmHg (Go et al., 2014).
Cigarette smoking
that the risk of stroke in current smokers is 2-4 times the risk of stroke in non-smokers and quitters (Bhat et al., 2008; Goldstein et al., 2011; R. S. Shah & Cole, 2010).
Diabetes mellitus
Diabetes mellitus is a strong risk factor for atherosclerosis. There is a parallel in-crease between the inin-crease in diabetes prevalence and cardiovascular morbidity and mor-tality (Go et al., 2013; Wilsgaard & Jacobsen, 2007). Diabetic adults have 2-4 times the rate of developing heart disease compared to non-diabetics, and they have higher morbidity and mortality due to cardiovascular disease (US Department of Health and Human Services, Centers for Disease Control and Prevention; 2011) (Donahoe et al., 2007).
Hyperlipidemia
Hypercholesterolemia is the more prominent component of hyperlipidemia affecting atherosclerosis. The degree and level of association of HDL, total cholesterol, and triglycer-ide are inconsistent (de Boer et al., 2011; Go et al., 2013; Solberg & Strong, 1983; Zieske et al., 2002).
Gender
Family history
Family history of atherosclerotic cardiovascular disease reflects the interplay be-tween biologically similar genetics and/or similar unhealthy environmental attributes. Both may act synergistically in increasing the risk of atherosclerotic morbidity and mortality. Cap-turing genotype and phenotype links using genome-wide association has been able to elicit small effects (Go et al., 2014).
In the U.S., positive family history for heart attack or angina is approximately 12.6%, with the highest reported prevalence seen in non-Hispanic white males and females (Go et al., 2014). A history of MI in parents increases the odds of having an MI: A history of MI in a single parent 50 years or older increases the odds of having an MI to 1.67 compared to those without parental history. Having a positive family history of MI in both parents at the age of 50 years or older increases the odds ratio to 2.36, and the odds ratio more than dou-bles if both parents had an MI before the age of fifty years (Chow et al., 2011).
1.1.3. Subclinical atherosclerosis
Topographical distribution of atherosclerosis
CAC, CIMT, RAS, and PAD have been identified as topographical manifestations of atherosclerosis.
Coronary artery calcification
and the intima. Clinical manifestations occur due to plaque rupture or severe coronary artery narrowing (Wexler et al., 1996).
Carotid intima media thickening
Because of ease of accessibility, CIMT is commonly used to quantify atherosclerotic burden and to measure the progression of atherosclerosis. CIMT is believed to develop be-fore CAC lesions (Go et al., 2013; Hodis et al., 1998). CIMT is commonly measured using B-mode ultrasound, which measures the tunica intima and tunica media layers of the carotid arteries (Go et al., 2013).
Methods to assess subclinical atherosclerosis
Non-invasive measures are used to visualize atherosclerosis that is subclinical or did not yet manifest. Computed tomography of the chest and B-mode ultrasound are used to assess CAC and CIMT, respectively (Go et al., 2014).
Epidemiology
Prevalence of subclinical atherosclerosis
The chronicity of atherosclerosis development and the advancement in imaging technology has promoted the examination of the level of atherosclerotic changes in the arte-rial systems to assess the burden of subclinical atherosclerosis. CAC and CIMT represent central subclinical atherosclerosis, and they are evaluated using chest computed tomogra-phy and B-mode ultrasound, respectively.
Coronary artery calcification
times the prevalence in whites compared to African Americans, and twice the prevalence in adults between the ages of forty and forty five years compared to adults between the ages of thirty three and thirty nine years of age (Loria et al., 2007).
Carotid intima-media thickening
CIMT is the measurement of the intima and media layers of the carotid arterial wall. It is commonly measured with B-mode ultrasound, which also can assess arterial narrowing and plaque formation (Go et al., 2014). B-mode ultrasound is a reliable and valid tool ("High-resolution B-mode ultrasound scanning methods in the Atherosclerosis Risk in Communities Study (ARIC). The ARIC Study Group," 1991) that has been used by large U.S. observa-tional studies to quantify CIMT (Bots, Vanmeurs, & Grobbee, 1991; Budoff et al., 2013; Chambless et al., 1997; Heiss et al., 1991). CIMT is a surrogate for and indicator of general-ized atherosclerosis (Bots et al., 1991), and it is considered a predictor of CAD (Chambless et al., 1997).
The Bogalusa Heart Study (S. Li et al., 2003; Urbina et al., 2002) and the NHLBI’s Cardiovascular Heart Study (O'Leary et al., 1999) are just two of the studies that have ex-amined the prevalence of CIMT. In these studies it has been observed that CIMT is more severe in the presence of cardiovascular risk factors. According to epidemiological studies, CIMT is considered risk if the thickness equals or exceeds 1 mm or if it lies in the high-est quartile or quintile according to age and gender (Go et al., 2014).
Risk factors
1.2. Peripheral arterial disease
PAD involves atherosclerotic changes of the wall of arteries supplying the visceral organs and limbs (Hirsch et al., 2006). The presence of atherosclerotic changes in one segment of the arterial system is likely associated with atherosclerotic changes in other parts of the arterial tree. Therefore, individuals with PAD have a higher risk of developing ischemic events resulting in higher morbidity and mortality (Hirsch et al., 2006).
PAD is defined as insufficient arterial flow to the periphery due to atherosclerotic oc-clusive disease (Schirmang, Ahn, Murphy, Dubel, & Soares, 2009). Being effected with PAD reduces the quality of life, and studies have shown that modifying risk factors improves mor-bidity and mortality due to PAD (Abdulhannan, Russell, & Homer-Vanniasinkam, 2012). In-termittent claudication is muscular pain and/or cramps triggered by an increase in oxygen demand at the extremities that exceeds the available oxygen response and represents the hallmark of PAD manifestations (Abdulhannan et al., 2012). Intermittent claudication is in-sensitive as a tool to identify PAD in populations at higher risk for PAD, e.g., older popula-tions and those with an elevated burden of risk factors (such as smoking and diabetes melli-tus). Approximately 48% of newly diagnosed PAD individuals do not report leg pain, 46% report atypical leg pain, and only 5.5% report classic claudication; it is estimated that 85-95% of PAD cases would be missed if clinicians mainly relied on clinical symptoms (Hirsch et al., 2001; McDermott et al., 2001).
1.2.1. Methods to measure peripheral artery disease
A number of diagnostic tools are available to measure PAD, including invasive and noninvasive tools, as shown in Appendix 1.
Ankle-brachial index
Ankle brachial index—the ratio of the ankle over the brachial systolic pressures—is a non-invasive measurement of documented high sensitivity and validity in the assessment of peripheral arterial occlusive disease. Lower levels of ABI also are associated with central atherosclerotic changes, including subclinical atherosclerosis in other vascular territories such as coronary artery disease, incident ischemic strokes, and recurrent strokes (Feringa et al., 2007; A. J. Lee et al., 2004; McDermott et al., 2005; Otah et al., 2004; Papamichael et al., 2000; Resnick et al., 2004; Tsai, Folsom, Rosamond, & Jones, 2001; Zheng et al., 1997). A strong inverse association between ABI categories and ischemic strokes exists. However, the strength of association is driven by the presence of common cardiovascular risk factors (Tsai et al., 2001). Furthermore, ABI has been shown to aid in identifying per-sons with moderate to high cardiovascular risk and to be a predictor of cardiovascular mor-bidity and mortality (A. J. Lee et al., 2004; Papamichael et al., 2000; Resnick et al., 2004). Definition and values
The systolic blood pressure progressively increases as the blood flows distally from the heart, resulting in a higher systolic blood pressure level at the ankle than that measured in the brachial artery. This is known as blood pressure amplification (Nichols, Nichols, & McDonald, 2011). The ratio of the systolic ankle blood pressure to the brachial systolic blood pressure provides the ABI (Aboyans et al., 2012), which was initially described by Winsor in the last century (Winsor, 1950).
moderate diminution of arterial supply, and ABI values equal to or less than 0.40 indicate severely diminished arterial supply (Hirsch et al., 2006; Rooke et al., 2011).
Factors affecting ABI measurement
ABI measurement can be affected by procedural factors and by individual physiolog-ical factors (Aboyans et al., 2012). Some of the technphysiolog-ical factors that affect ABI measure-ment include incorrect cuff size, using a spiral versus a parallel cuff wrapping method, and measuring systolic ankle blood pressure in the sitting position (60, 63-65). Adherence to pro-tocol is thus essential to limit procedural factors affecting ABI measurement.
Physiological factors related to the patient that can affect ABI measurement include height, gender, heart rate, ethnicity, and having smoked ten minutes prior to ABI measure-ment (Aboyans et al., 2007; Bird et al., 1999; London, Guerin, Pannier, Marchais, & Stimpel, 1995; F. B. Smith, Lee, Price, van Wijk, & Fowkes, 2003; Su et al., 2007; Zheng et al., 2005).
1.2.2. Epidemiology of lower extremity PAD
Prevalence and incidence
older age and the presence of atherosclerosis risk factors (Kannel & McGee, 1985; Murabito et al., 2002a).
Morbidity and mortality
Age-standardized death rates for peripheral vascular disease in 2010 were 0.7 per 100,000, which has increased by 53% since 1990 (Lozano et al., 2012). In 1990 DALY’s for peripheral vascular disease was 14 per 100,000; it has increased by 51.7% since then (Murray et al., 2012). Years lived with disability from peripheral vascular disease in 2010 was 6 per 100,000, representing an increase of 26.0% since 1990 (Vos et al., 2012). 1.2.3. Risk factors for peripheral artery disease
PAD is caused by peripheral atherosclerosis. As a result, PAD is affected by the aforementioned risk factors of atherosclerosis, particularly cigarette smoking and diabetes mellitus, which are the strongest risk factors affecting lower-extremity PAD (Criqui,
Denenberg, Langer, & Fronek, 1997; Go et al., 2014; Hirsch et al., 2006).
Cigarette smoking and lower-extremity PAD are strongly associated. In approximate-ly twenty thousand men and women, it was found that 80% of individuals with lower extremi-ty PAD were current or ex-smokers (Fowkes et al., 1992; G. D. Smith, Shipley, & Rose, 1990). The effect of smoking on the risk of lower extremity PAD is dose dependent (Cole et al., 1993; Powell et al., 1997; Price et al., 1999). Diabetes is another well-recognized risk factor for lower extremity PAD. Twelve to twenty percent of individuals with lower extremity PAD are diabetics (Hiatt, Hoag, & Hamman, 1995; Meijer et al., 1998), and the risk of devel-oping lower extremity PAD in diabetics is two to four times the risk in non-diabetics (Beks et al., 1995; Criqui et al., 1997; Hiatt et al., 1995; Meijer et al., 1998; Newman et al., 1993).
Murabito et al., 2002b), while an inconsistent association between increased levels of tri-glyceride and lower-extremity PAD exists (Greenhalgh et al., 1971; Mowat et al., 1997; Novo et al., 1992). There is an almost parallel relationship between increasing levels of total cho-lesterol and an increase in the risk of developing lower-extremity PAD, where an increase in total cholesterol by 10 mg/dL increases the risk of developing lower extremity PAD by 5% to 10% (Ingolfsson, Sigurdsson, Sigvaldason, Thorgeirsson, & Sigfusson, 1994; Murabito, D'Agostino, Silbershatz, & Wilson, 1997; Newman et al., 1993).
Elevated blood pressure is a strong risk factor for many atherosclerotic changes causing CAD. However, it is a weaker risk factor for lower extremity PAD (Criqui et al., 1997; Murabito et al., 1997; Novo et al., 1992), and the directionality and strength of the associa-tion varies among studies (Fowkes et al., 1992; Murabito et al., 1997; G. D. Smith et al., 1990).
1.3. Abdominal aorta dilatation and aneurysm
Definition
Commonly, the AAD is defined as an AAA when the antero-posterior diameter measures 3 cm or more. Other plane diameters have been used, however the antero-posterior diameter yields reproducible results and therefore it is more commonly used (Hirsch et al., 2006).
1.3.1. Pathophysiology of AAD and AAA
have been identified as part of the pathophysiological pathway. Destruction of the elastic lamina of the tunica media is a main histopathological feature in AAAs (Davies, 1998; Hirsch et al., 2006). In aneurysmal formation, inflammatory infiltrates, specifically macrophages, have been identified in the medial layer (Agmon et al., 2003; Davies, 1998). The inflammato-ry process stimulates macrophages and smooth muscle cells to produce metalloproteinase (MMP) enzymes that degrade the elastic lamina connective tissue formed of elastin and col-lagen (Davies, 1998; Goodall, Porter, Bell, & Thompson, 2002; Reed, Reed, Stemmermann, & Hayashi, 1992). The destruction in the tunica media leads to loss of elastic recoil and weakening of the aortic wall and consequently the inability to withstand systolic pressure. 1.3.2. Methods to measure AAD and AAA
Diagnostic imaging used to evaluate AAD and diagnose AAA include ultrasonogra-phy (US), CT scanning, and magnetic resonance arteriogram (MRA) scanning. In clinical practice, ultrasonography is commonly used to screen and diagnose AAA. Methods such as CT and MRA are considered the “gold standard” radiological techniques and are used in pre- and postoperative evaluation (Hirsch et al., 2006; Rubin, Armerding, Dake, & Napel, 2000). Incidental abdominal aneurysm diagnoses are not uncommon in older adults, as they are subject to more radiological imaging. AAAs can be detected on plain radiographs, ultra-sound images, and CT images that are targeting other organs (Hirsch et al., 2006). Ultrasonography
Ultrasonography is the least invasive and least expensive diagnostic imaging method used to measure AAD and diagnose AAAs. B-mode US and duplex US are both used
de-tecting AAAs in the suprarenal and iliac arteries (Fillinger, 2000; Hirsch et al., 2006; Lamah & Darke, 1999).
Computed tomography
Computed tomographic imaging using contrast is the diagnostic and evaluative tech-nique preferred by many clinicians. Contrast-enhanced CT determines the widest transverse diameter of the AAA and how it relates to the renal arteries, the length and caliber of the normal abdominal aortic segment inferior to the renal arteries, arterial disease in the adja-cent abdominal aortic branches, and the presence of other non-arterial anomalies in the pa-ra-aortic soft tissue (Coulam & Rubin, 2001; Papanicolaou et al., 1986).
Magnetic resonance arteriogram
MRA is the preferred diagnostic and evaluative technique for preoperative AAAs when the presence of mural calcification is suspected (Hirsch et al., 2006). MRA is more time consuming and expensive than CT and US.
1.3.3. Epidemiology of AAD and AAA
Population distribution of AAD and AAA
Morbidity and mortality
From twenty one different regions of the world, DALY’s for all ages and age-standardized DALY’s for AAAs have increased by an average of 34.6% and 3.6%, respec-tively, from 1990 to 2010 (Murray et al., 2012). Globally, deaths attributed to aortic aneu-rysms across all ages calculated from 187 different countries increased by 45.3% during the same period, while the age-standardized death rate from aortic aneurysms decreased by 12.7% during the same period (Lozano et al., 2012). An 18-study meta-analysis was recent-ly conducted, mostrecent-ly comprised of prospective studies with a mean follow-up of 4 years based, on 15,475 individuals diagnosed with a small aneurysm and undergoing follow-up (Powell et al., 2011; Sweeting, Thompson, Brown, Powell, & collaborators, 2012). The pooled mean growth in the diameter of AAAs was approximately 2.21 mm/year, which did not vary by gender. The rate of AAA growth was significantly and consistently affected by smoking status and diabetes mellitus (after adjusting for medical history, drug history, and demographics) (Sweeting et al., 2012). Abdominal aortic aneurysms showed a faster rate of growth by 0.35 mm/year in current smokers compared to ex-smokers and never-smokers (Sweeting et al., 2012). The presence of diabetes mellitus slowed the rate of AAA growth by 0.51 mm in a continuous fashion (Sweeting et al., 2012).
1.3.4. Risk factors
The atherosclerosis risk factors mentioned in section B.1.2. are commonly present in AAA patients, with a stronger association observed with smoking, age, gender, and body surface area (Agmon et al., 2003; Reed et al., 1992).
1.4. Arterial stiffness
1.4.1. Pathophysiology of arterial stiffness
Arterial stiffness begins early in life and is the result of progressive pathophysiologi-cal changes that occur in the large elastic arteries; it consists of structural and cellular trans-formations leading to reduced distensibility. Arterial stiffness is an incompletely understood process, and it is widely considered to be a contributor to cardiovascular morbidity and mor-tality (Boutouyrie et al., 2002; Covic, Haydar, Bhamra-Ariza, Gusbeth-Tatomir, & Goldsmith, 2005; Khadilkar, Chiplonkar, Pandit, Kinare, & Khadilkar, 2012; Kim et al., 2011; Laurent et al., 2001; Sutton-Tyrrell et al., 2005; Vlachopoulos, Aznaouridis, & Stefanadis, 2010). The process of arterial stiffening can be accelerated by cardiovascular risk factors, including ar-terial hypertension (Arnett et al., 2000; Kaess et al., 2012; Laurent et al., 2003; Liao et al., 1999), tobacco use (Doonan et al., 2010; Jatoi, Jerrard-Dunne, Feely, & Mahmud, 2007; Yu-Jie, Hui-Liang, Bing, Lu, & Zhi-Geng, 2013), elevated plasma glucose levels (Cruickshank et al., 2002; Henry et al., 2003; Martens, van der Graaf, Dijk, Olijhoek, & Visseren, 2008), and elevated lipid levels (Urbina et al., 2013; Wang et al., 2011).
dimin-(Johnson, Baugh, Wilson, & Burns, 2001; Zieman et al., 2005).
The structural and cellular changes in the arterial wall resulting in the development of arterial stiffness involve more than one layer, and some of these changes are shared in more than one layer. The innermost layer of the arterial wall (tunica intima) exhibits patho-physiological changes that contribute to arterial stiffening including disorganization and ab-normal changes of endothelial cells, increased production of abab-normal collagen, breakdown of elastin and development of frayed elastin structure, and increased permeability causing infiltration of smooth muscle cells and macrophages. The changes in the middle layer of the arterial wall (tunica media) demonstrate changes in collagen, elastin, and smooth muscle cells similar to those seen in the intimal layer (Lakatta, 2003; Lakatta & Levy, 2003; Zieman et al., 2005). Hemodynamic forces affect these changes, and they do not occur homoge-nously throughout the arterial tree.
Central arterial stiffness
Differences in the degree of arterial stiffening occur in various segments of the aorta, due to inherent variability in the elasticity of the anatomical aortic segments (R. T. Lee & Kamm, 1994a, 1994b).
In this dissertation we chose to include heart-carotid PWV (hcPWV) as the measure for central arterial stiffness (although it is not as reliable as cfPWV) in to avoid measurement error introduced in cfPWV estimates, which include the abdominal aorta and its dilatation (the dependent variable of these analyses).
Peripheral arterial stiffness
et al., 1985; Laurent, Boutouyrie, & Lacolley, 2005; Laurent et al., 2006). Reversal of the stiffness gradient is influenced by aging and hypertension (Benetos et al., 1993; Boutouyrie et al., 1992).
1.4.2. Methods to measure arterial stiffness
Arterial stiffness can be assessed using various techniques and equations (Appendix 2) (Chirinos, 2012); many of these techniques assess regional stiffness, while systemic stiff-ness is assessed by “models of the circulation” (Laurent et al., 2006). PWV is a valid, repro-ducible non-invasive measure of arterial stiffness (Chirinos, 2012). It has been used more frequently in recent studies to evaluate regional stiffness, which speak to the changes in the arterial wall examined (Laurent et al., 2006). Arterial stiffness measured by PWV is de-pendent on the arterial wall properties and the wall thickness/lumen diameter ratio. This
re-lationship is best described by the Moens–Korteweg equation, PWV= , where h is wall
thickness, E is Young’s modulus of the arterial wall, D is arterial diameter, and is blood density(Chirinos, 2012).
The degree of arterial stiffness measured by PWV is currently used in clinical prac-tice in some Asian and European countries to evaluate cardiovascular health and assess cardiovascular morbidity and mortality.
1.4.3. Epidemiology of arterial stiffness
CHAPTER 2: STUDY AIMS AND HYPOTHESIS
The study aims that guided this doctoral research were stated as follows:
I. Describe the distribution of AAD at proximal, mid-, and distal locations by levels of PAD measured by ABI at the cohort Visit 5 examination. Descriptive analyses will be limited to age, gender and race for the study population included in these anal-yses.
• Examine the distribution of peripheral artery disease by age, gender, and race.
i. We anticipate that stratifying by age, gender, and race will elicit differences in the distribution of peripheral artery disease.
• Examine the distribution of abdominal aorta diameters at proximal, mid-, and distal
locations according to age, gender, and race
i. We anticipate that stratifying by age, race, and gender will elicit differences in the distribution of abdominal aorta diameters at proximal, mid-, and distal locations.
• Characterize the strength and shape of the association between ABI and
ab-dominal aorta diameters at proximal, mid-, and distal locations and across the range of ABI values.
i. We hypothesize that decreasing levels of ABI will be associated with wider abdominal aorta diameters.
ii. We hypothesize that the strength of association will increase from proximal to distal levels of the abdominal aorta.
effect modifiers of observed associations between ABI and abdominal aorta diame-ters.
i. We anticipate that the strength of association between peripheral artery disease and abdominal aorta diameters will vary due to potential confound-ers and/or effect modificonfound-ers such as cigarette smoking, elevated blood pres-sure, and type 2 diabetes.
II. Describe the association of central and peripheral arterial stiffness measured by hcPWV and faPWV, respectively, and abdominal aorta diameters at proximal, mid-, and distal locations at the cohort Visit 5 examination
• Examine the distribution of central and peripheral arterial stiffness by age, gender,
and race.
i. We anticipate that stratifying by age, gender, and race will elicit differences in the distribution of central and peripheral arterial stiffness.
• Characterize the strength and shape of the association between (a) central arterial
stiffness, measured by hcPWV, and abdominal aorta diameters at proximal, mid-, and distal locations; and (b) peripheral arterial stiffness, measured by faPWV, and abdominal aorta diameters at the three locations stated above.
i. We hypothesize that increasing levels of hcPWV and faPWV will be associ-ated with wider abdominal aorta diameters.
ii. We hypothesize that the strength of association will increase from proximal to distal levels of the abdominal aorta.
i. We anticipate that strength of association between arterial stiffness and ab-dominal aorta diameters will vary due to potential effect modifiers such as cigarette smoking, hypertension, and type 2 diabetes.
• Examine the differences in the associations between central and peripheral arterial
stiffness measured by hcPWV and faPWV, respectively, and both the anterior-posterior (AP) and transverse abdominal aorta diameters.
i. We hypothesize the association will be stronger using the anterior posterior abdominal aorta diameter.
III. Examine the ability of ABI and PWV to statistically predict abdominal aorta diame-ters by deriving predictive risk equations to classify AAD at clinically meaningful levels.
i. We hypothesize that lower levels of ABI will statistically predict abnormally dilated abdominal aorta diameters at clinically relevant cut points.
CHAPTER 3: PUBLIC HEALTH RELEVANCE AND POTENTIAL CLINICAL IMPACT
Abdominal aortic aneurysms are common in older adults; their prevalence can reach 12.5% in men between 75-84 years of age (Hirsch et al., 2006). AAAs are frequently asymp-tomatic, present late, and are often diagnosed as incidental findings resulting in high levels of complications, morbidity and mortality. The burden of morbidity and mortality of AAAs has increased globally in the last decade (Lozano et al., 2012), although there are indications that the prevalence of AAAs may be declining in the United States. It is plausible that earlier diagnoses of AAAs will help to reduce their impact on morbidity and fatality. Exploring op-tions for cost-effective, non-invasive methods to identify persons with abdominal aortic dila-tation and AAAs is seen as an important step toward decreasing the morbidity and mortality from AAAs.
3.1. ABI and abdominal aorta diameters
ABI is a cost-efficient, accurate, and well-established tool to identify impaired perfu-sion of a lower extremity, allowing for efficient diagnostic evaluation of PAD. As a marker of PAD, low ABI levels are indicative of increased likelihood of coronary artery disease, carotid artery stenosis, and cerebrovascular accident (Manzano et al., 2012; Papamichael et al., 2000; Zheng et al., 1997). PAD also has been shown to coexist in persons with AAA
(Axelrod et al., 2002). AADs/AAAs and peripheral arterial disease are due to atherosclerotic changes to the arterial wall and share pathophysiological pathways. This study will expand on these commonalities and examine the association between measures of lower extremity occlusive disease and pathologic dilatation of the abdominal aorta. A limited number of studies have examined the relationship between AAA and peripheral arterial disease (Allardice, Allwright, Wafula, & Wyatt, 1988; MacSweeney et al., 1993). Insights into asso-ciations between ABI and ultrasound measures of abdominal aorta diameters will allow us to infer whether the well-established and simple measures of ABI have potential as indicators of the likelihood of abdominal aorta morphology associated with clinically defined AAA. To our knowledge, the ability to statistically predict AAD and AAA from ABI has not been exam-ined. It is one of the aims of this dissertation to examine this predictive ability and to evalu-ate the potential for a predictive algorithm of relevance to clinical practice.
3.2. PWV and abdominal aorta diameters
AAD/AAAs has not been characterized in a community-based population of older adults. The purpose of this study is to examine our ability, based upon central arterial stiffness (hcPWV) and peripheral arterial stiffness (faPWV), to predict the diameter of the abdominal aorta at three pre-specified sites and to assess whether the degree of central and/or periph-eral arterial stiffness measured by hcPWV and faPWV, respectively, are related to morpho-logic changes in the abdominal aorta. We have chosen the aforementioned segments be-cause they evaluate two arterial territories with different structural and physiological charac-teristics. The hcPWV will allow us to assess the association of central arterial stiffness with the atherosclerotic changes that occur in the abdominal aorta. The faPWV will allow us to examine the association of peripheral atrial stiffness (muscular arteries) with those changes.
CHAPTER 4: RESEARCH DESIGN AND METHODS
4.1. Study design
We used data from the Atherosclerosis and Risk in Communities (ARIC) study, a longitudinal, multi-center, bi-ethnic, population-based cohort of 15,792 men and women aged 45 to 64 years of age at intake in 1987. There were five visits required: The base-line visit occurred between 1987 and 1989. Visits 2 through 4 occurred in 3-year intervals be-tween 1990-1992, 1993-1995, and 1996-1998. The fifth visit occurred bebe-tween 2011 and 2013. The study was designed to examine atherosclerosis and its clinical outcomes, chang-es in cardiovascular risk factors, and cognitive function. In addition, the ARIC study recorded anthropometric measurements, physical function, lung function, cardiovascular biomarkers and phenotypes, medical history, and other information relevant to the objectives of the study.
We used a cross-sectional design to examine the aims proposed for this dissertation. AADs, ABI, hcPWV, and faPWV were measured at visit 5. We used the data collected at this visit to characterize the distribution of AADs at specified levels of the abdominal aorta, as well as the pattern and strength of association of AADs with ABI, hcPWV, and faPWV. We took into account demographic data and potential confounders and effect modifiers. In addi-tion, we used a cross-sectional design to build on the aforementioned analysis to examine the ability to statistically predict AADs from ABI, hcPWV, and/or faPWV.
4.2. Study population
na. The four locations included rural, suburban, and urban settings ("The Atherosclerosis Risk in Communities (ARIC) Study: design and objectives. The ARIC investigators," 1989). The ARIC study was designed to examine the etiology, natural history, and clinical manifes-tations of atherosclerosis, taking into account cardiovascular risk factors, race, gender, loca-tion, and date. The study started in 1987 and was sponsored by the NHLBI. Around 4,000 participants between 45 and 64 years of age were randomly selected from each of the four communities listed above. Age-eligible persons were randomly sampled from listings in Washington County, Minneapolis, and Jackson, Mississippi, using driver’s licenses, private county health censuses, persons eligible for jury duty, and persons with state identification cards ("The Atherosclerosis Risk in Communities (ARIC) Study: design and objectives. The ARIC investigators," 1989). However, in Forsyth county persons were identified by area sampling ("The Atherosclerosis Risk in Communities (ARIC) Study: design and objectives. The ARIC investigators," 1989).
The first visit was from 1987 to 1989. Medical, social, and demographic data were obtained from 15,792 persons. Three re-examination visits were conducted every three years, with 93%, 86%, and 80% response rates for the second, third, and fourth visits, spectively. The fifth visit was conducted between June 2011 and August 2013. The re-sponse rate for visit 5 was 65%, which represents the 6,538 participants that took part in vis-it 5 divided by the 10,036 cohort members alive through August 2013.
4.3. AAD: Measurements and data quality
Abdominal aorta diameters were measured by high resolution, real-time duplex ultra-sound (Philips IE33). To ensure data quality, involved personnel, radiologists, and certified technologists were recruited and trained to follow standardized ARIC protocols.
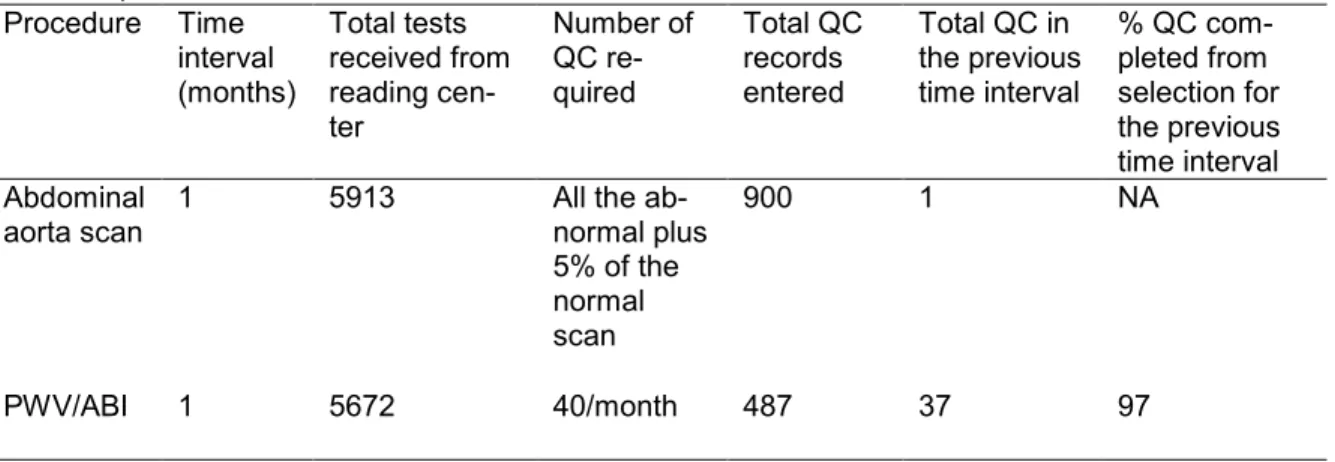
proximal infrarenal aorta 2 cm below the renal arteries, distal infrarenal aorta 1 cm superior to the aortic bifurcation, and the point of maximal abdominal aortic dilatation if it was not at the level of the proximal or distal infrarenal aortas. Additional transverse images were taken in the case of a possible AAA (maximum diameter ≥ 2.8 cm). In addition, a longitudinal view was taken of the infrarenal abdominal aorta from the renal arteries to the bifurcation of the abdominal aorta. Participants with a history of previous AAA repair or previous aortic bypass surgery for occlusive atherosclerotic disease were not scanned. All abnormal abdominal aortic scans and a 5% random sample of normal scans were sent to ARIC’s aortic imaging core laboratory for diagnosis of AAAs and other possible pathologies (Table 1). To support the quality of the scans, 10 randomly selected studies were evaluated for each technologist, and recommendations for improvement were distributed to all technologists. Based on 900 quality control abdominal aorta scans (Table 2), 32% were excellent, 29% were good, 15% were fair, and 23% were poor.
Table 1. Completion Status of Quality Control Measures Based on ARIC Data Retrieved Oc-tober 23, 2013
Procedure Time interval (months) Total tests received from reading cen-ter Number of QC re-quired Total QC records entered
Total QC in the previous time interval
% QC com-pleted from selection for the previous time interval Abdominal aorta scan
1 5913 All the ab-normal plus 5% of the normal scan
900 1 NA
PWV/ABI 1 5672 40/month 487 37 97
Table 2. Abdominal Aorta Scan Quality Control Measures Based on ARIC Data Retrieved October 23, 2013
Procedures Excellent Good Fair Poor NA Total
N % N % N % N % N %
Abdominal aorta scan
4.4. Arterial stiffness and PAD: Measurements and data quality
Femoral-ankle pulse wave velocity and ABI were used to evaluate peripheral arterial stiffness and PAD, respectively, and heart-carotid pulse wave velocity was used to evaluate central arterial stiffness. ABI, hcPWV, and faPWV were measured concurrently at ARIC visit 5 using an automated non-invasive waveform analyzer, the VP-1000 Plus device (Omron Co., Ltd., Kyoto, Japan). This analyzer had been selected on the basis of prior validation studies and because it would reduce observer-dependent variability as well as exam time. Trained and certified technicians performed the measurement process by following a stand-ardized protocol. Four size-appropriate blood pressure cuffs were attached to both arms and ankles to record the systolic blood pressure and pressure pulse waves, respectively. A ca-rotid sensor, a femoral sensor, and two ECG sensors were applied. Two measurements were taken to reduce process variability; the second measurement was obtained two to five minutes after the first measure. A third measurement was performed if the study technician experienced difficulties in obtaining an optimal pulse wave form on the display, in which case technologists waited 2-5 minutes to obtain a third measurement. The average of the last 2 non-zero measurements were used.
Table 3. PWV/ABI Quality Control Quality Measures Based on ARIC Data Retrieved October 23, 2013
Procedure Quality
Optimal Good Acceptable Poor Unacceptable NA Total
N % N % N % N % N % N %
PWV/ABI 380 78 85 17 16 3 0 0 0 0 6 1 487
Hg or more between the right and left averages and either the left or right pressure was higher for both measurements.
Currently, no clinical threshold levels for hcPWV and faPWV have been identified. Because of this, heart- carotid PWV and faPWV were recorded for research purposes, but the results were not reported to participants. A summary report of the ABI values was deliv-ered to participants and their health care providers about 6 weeks after the ARIC exam visit. According to the AHA standards, ABI values between 1.00-1.30 are considered normal, the range 0.91-0.99 is considered borderline, 0.41-0.90 is indicative of mild to moderate dimin-ished arterial supply, equal or less than 0.40 is indicative of severely dimindimin-ished arterial supply, and more than 1.40 is attributed to incompressibility of the arteries and arterial calci-fication (Hirsch et al., 2006; Rooke et al., 2011).
Table 4. ICCs and 95% CIs for faPWV, hcPWV, and ABI
Index ICC (95% CI) SEM MDC95
Right faPWV * 0.69 (0.59, 0.79) 108.7 301.4 Left faPWV * 0.57 (0.43, 0.71) 117.3 325.1
hcPWV * 0.44 (0.26, 0.61) 215.0 596
Right ABI § 0.48 (0.34, 0.64) 0.08 0.22
Left ABI § 0.61 (0.48, 0.73) 0.07 0.20
ICC: Intra-class Correlation Coefficient; SEM: Standard Error of Measurement;
MDC95: Minimal Detectable Change
* First author: Snyder (Snyder et al., 2015)
§ First author: Al-Qunaibet (Al-Qunaibet et al., 2015)
the records were considered of optimal quality, 17% were of good quality, 3% were ac-ceptable, and none were graded as poor or of no quality (Table. 3). The repeatability of hcPWV, faPWV, and ABI was characterized in a subset of ARIC participants (N = 79) (Al-Qunaibet et al., 2015; Snyder et al., 2015). The participants in the subset underwent two ex-aminations 4-8 weeks apart using the standardized protocols applied in the full cohort to measure ABI and PWV. The intra-class correlation (ICC), corresponding 95% confidence intervals (95% CI), minimal detectable change (MDC95), and standard error of measurement
were calculated indicating acceptable-to-substantial repeatability measures for ABI, faPWV, and hcPWV (Table 4).
Based on the PWV repeatability study performed on ARIC visit 5 data, we consid-ered the repeatability of faPWV and hcPWC acceptable (Snyder et al., 2015). The ICCs and 95% CIs indicate substantial repeatability for right faPWV ICC 0.69 (0.59, 0.79), moderate repeatability for left faPWV ICC 0.57 (0.43, 0.71), and moderate repeatability for hcPWV ICC 0.44 (0.26, 0.61), according to the categorization of Landis et al. (Landis & Koch, 1977). To our knowledge, the repeatability and accuracy of faPWV using the Omron VP-1000 plus de-vice used in the ARIC study at visit 5 has not been thoroughly examined. However, similar automated devices have demonstrated high repeatability and accuracy (Asmar et al., 1995; Cooper, Tepper, Barinas-Mitchell, Woodard, & Sutton-Tyrrell, 2012; Tanaka et al., 2006; Yamashina et al., 2002).
However, we were not able to find contrasts made between left and right faPWV repeatabil-ity in the literature to compare to the left and right faPWV repeatabilrepeatabil-ity conducted in the ARIC study.
The AHA recognizes the ABI as a source of objective data that provides level B evi-dence in many clinical scenarios (Hirsch et al., 2006) and is a non-invasive measure with well-established accuracy (Feigelson, Criqui, Fronek, Langer, & Molgaard, 1994; Nassoura et al., 1996). The ICCs were calculated in ARIC visit 5 as a statistic for reliability; they indi-cate fair reliability for right ABI (ICC = 0.48, 95%CI 0.34, 0.64) and left ABI (ICC = 0.61, 95% CI 0.48, 0.73), according to the Landis et al. categorization (Landis & Koch, 1977). Prior to ARIC visit 5, ABI had been measured using DINAMAPTM, another automated oscillometric
device ("The Atherosclerosis Risk in Communities (ARIC) Study: design and objectives. The ARIC investigators," 1989), and the reliability coefficient was 0.61 (95% CI 0.51, 0.70) (Weatherley, Chambless, Heiss, Catellier, & Ellison, 2006). The validity and reliability of au-tomated oscillometric ABI have been measured against manually measured ABI using Dop-pler, the gold standard for ankle blood pressure measurement in calculating ABI (Hirsch et al., 2006), and there is an overall agreement on the high reliability and acceptable validity of automated oscillometric ABI measurement (Kollias, Xilomenos, Protogerou, Dimakakos, & Stergiou, 2011; Richart, Kuznetsova, Wizner, Struijker-Boudier, & Staessen, 2009; Verberk, Kollias, & Stergiou, 2012).
4.5. Statistical analyses overview
we dichotomized AADs according to the 3 cm threshold and also created distribution-based categories for AADs at proximal, mid-, and distal locations.
There were two traits of main interest for this analysis: central and peripheral arterial stiffness measured by hcPWV and faPWV respectively, and peripheral arterial disease measured by ABI. Established clinical cut points do not exist for hcPWV and faPWV; there-fore, arterial stiffness was analyzed on a continuous scale. Peripheral arterial disease is suggested by an ABI of < 0.90, and a normal ABI range is 1.00 to 1.40(Hirsch et al., 2006). We similarly analyzed ABI on a categorical and continuous scale. We included covariates that are established or suspected risk factors for dilated AADs and that could potentially confound the peripheral arterial disease by AAD relationship, central arterial stiffness by AAD relationship, and peripheral arterial stiffness by AAD relationship. These factors includ-ed age, gender, and race. Cigarette smoking, systolic blood pressure, blood pressure minclud-ed- med-ication, and diabetes were introduced as covariates in sensitivity analyses.
Aim I: Describe the distribution of abdominal aorta diameters at proximal, mid-, and distal locations by levels of peripheral artery disease measured by ABI at the ARIC cohort Visit 5 examination.
4.5.1 Distribution of PAD
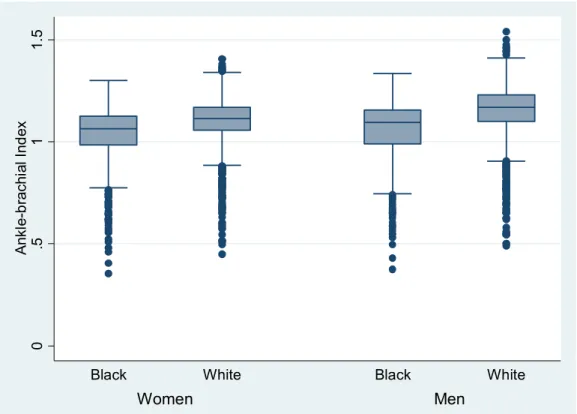
We performed univariate analyses of ABI on a continuous scale and calculated the mean, median, and standard deviation, assessing the shape of the distributions. In addition, we used the four ABI categories described previously in section B.2.1. that consist of ≤ 0.40, 0.41-0.90, 0.91-0.99, 1.00-1.29, and > 1.30 (Hirsch et al., 2006; Rooke et al., 2011). To ana-lyze ABI on a categorical scale, we tabulated frequencies for the four ABI categories. Fol-lowing the analyses of ABI in the ARIC cohort at visit 5, we examined the anticipated heter-ogeneity in ABI values, stratifying by gender and race.
4.5.2 Distribution of AADs
We examined the distribution of AADs as a continuous, dichotomous, and categori-cal variable. Initially, we explored the distribution of AADs as a continuous variable and as-sessed any impact of missing data or extreme values. The mean, standard deviation, and the shape of the distribution were calculated. We proceeded by superimposing cut points, thus creating distribution-based categories. We also used a cut point of 3 cm anterior-posterior diameter to create a dichotomous variable. Appropriate descriptive statistics were used for categorical and dichotomous AADs. The aforementioned statistical analysis steps were repeated for AADs at proximal, mid-, and distal locations. Therefore, in this section of analyses we were able to compare the variation in the descriptive statistics for AADs at three deferent anatomical levels.
4.5.3 Strength of association between PAD and AADs
ex-cal exposure and outcome, categoriex-cal exposure and continuous outcome, and categoriex-cal exposure and dichotomous outcome. Each variation of outcome and exposure analyses was repeated for AADs at the above-mentioned anatomical locations. We used Pearson’s Chi-Square and the test for trend to perform bivariable comparisons between ABI and AADs, both as categorical variables. We used one-way analysis of variance to examine the strength and shape of association between ABI on a categorical scale and AADs on a con-tinuous scale. To assess the association between ABI and AADs as concon-tinuous variables, we used Pearson’s correlation and quintile regression.
4.5.4 Assess covariates as confounders and effect modifiers for the associations be-tween ABI and AADs
Covariates of interest include age, gender, cigarette smoking, elevated blood pres-sure, and type 2 diabetes. We performed descriptive analyses for continuous and categori-cal covariates, assessing the covariates as confounders or possible modifiers of the associ-ation between ABI and AADs.
Based on the conclusions reached from the above analyses, we proceeded to per-form multivariable analyses. The exposure of interest and outcome of interest were ana-lyzed on continuous and categorical scales. We used analysis of covariance and percentile regression to estimate the mean difference in AAD on a continuous scale between normal and abnormal ABI levels, adjusted for covariates. We also estimated the mean difference in AAD for a unit change in ABI when analyzed on a continuous scale adjusted for covariates. We fit a multinomial regression model analyzing AAD on a nominal scale. We estimated the odds of dilated abdominal aorta diameters for each of the normal and abnormal ABI levels, adjusting for covariates. We also estimated the odds of dilated abdominal aorta diameters for selected ABI values. Throughout the process of multivariable analyses, we took into ac-count the possibility of effect modifiers and dealt with them accordingly.
Aim II: Describe the distribution and association of central and peripheral arterial stiffness measured by hcPWV and faPWV, respectively, and anterior-posterior abdominal aorta di-ameters at proximal, mid-, and distal locations at the cohort Visit 5 examination.
Aim II analyses were performed with three goals: a) to examine the distribution of central PWV and peripheral PWV in the ARIC cohort at visit 5, b) to characterize the strength and shape of the association between central arterial stiffness measured by
4.5.5 Distribution of central and peripheral arterial stiffness
This part of Aim II involves descriptive analyses of hcPWV and faPWV on a continu-ous scale. We performed univariate analyses calculating the mean, median, standard devia-tion, and interquartile ranges, assessing the shape of the distributions. We anticipated that the distribution of arterial stiffness would differ by age, race, and gender. To address this, we compared the mean for hcPWV and faPWV in the different categories of race and gen-der. Gender and race are dichotomous independent variables. A 2-sample t-test was per-formed to compare changes in PWV values for gender and race categories.
4.5.6 Strength of association between arterial stiffness and AADs
We examined the strength and shape of the association between the exposures of interest (central and peripheral arterial stiffness) and the outcome of interest (AADs at prox-imal, mid, and distal locations). The strength of the association between the two exposures of interest and outcome was examined separately. The exposures were analyzed only on a continuous scale and the outcome on continuous, dichotomous, and categorical scales. Therefore, we created a set of bivariable analyses that included: continuous exposure and outcome, continuous exposure and categorical outcome, and continuous exposure and di-chotomous outcome. Each variation for outcome and exposure analyses was repeated for each exposure (hcPWV and faPWV) and for anterior-posterior AADs at the
4.5.7 The role of identified covariates on the associations between PWV (central and peripheral) and AADs
Covariates of interest include age, gender, cigarette smoking, elevated blood pres-sure, and type 2 diabetes. Aging, cigarette smoking, and type 2 diabetes are shareholders in the pathophysiological process of developing arterial stiffness and abdominal aortic dilata-tion. Elevated blood pressure is a strong hemodynamic determinant of PWV and AAD. It was important to examine how these covariates affected the strength and degree of the as-sociation between PWV (exposure) and AAD (outcome). As explained in Aim I, we em-ployed stratification and adjustment. We assessed the change in the degree and level of as-sociation between PWV and AAD, how the estimates of AAD changed, and how useful the estimates were depending on the method used.