Self-Reported Cancer Prevalence among
Hispanics in the US: Results from the Hispanic
Community Health Study/Study of Latinos
Frank J. Penedo1*, Betina Yanez1, Sheila F. Castañeda2, Linda Gallo3, Katy Wortman1, Natalia Gouskova4, Melissa Simon5, William Arguelles6, Maria Llabre6, Lisa Sanchez-Johnsen7, Carrie Brintz6, Patricia Gonzalez2, Linda Van Horn8, Alfred W. Rademaker8, Amelie G. Ramirez9
1Department of Medical Social Sciences, Feinberg School of Medicine, Northwestern University, Chicago, IL, United States of America,2Institute For Behavioral and Community Health, Graduate School of Public Health, San Diego State University, San Diego, CA, United States of America,3Department of Psychology, San Diego State University, San Diego, CA, United States of America,4Department of Biostatistics, Gillings School of Public Health, University of North Carolina at Chapel Hill, Chapel Hill, NC, United States of America,5Department of Obstetrics & Gynecology, Feinberg School of Medicine, Northwestern University, Chicago, IL, United States of America,6Department of Psychology, University of Miami, Coral Gables, FL, United States of America,7Department of Psychiatry, University of Illinois at Chicago, Chicago, IL, United States of America,8Department of Preventive Medicine, Feinberg School of Medicine, Northwestern University, Chicago, IL, United States of America,9Institute for Health Promotion, University of Texas Health Science Center, San Antonio, TX, United States of America
Abstract
Cancer has surpassed heart disease as the leading cause of death among Hispanics in the U. S., yet data on cancer prevalence and risk factors in Hispanics in regard to ancestry remain scarce. This study sought to describe (a) the prevalence of cancer among Hispanics from four major U.S. metropolitan areas, (b) cancer prevalence across Hispanic ancestry, and (c) iden-tify correlates of self-reported cancer prevalence. Participants were 16,415 individuals from the Hispanic Community Health Study/Study of Latinos (HCHS/SOL), who self-identified as Cuban, Dominican, Mexican, Puerto Rican, Central or South American. All data were collected at a single time point during the HCHS/SOL baseline clinic visit. The overall self-reported prev-alence rate of cancer for the population was 4%. The rates varied by Hispanic ancestry group, with individuals of Cuban and Puerto Rican ancestry reporting the highest cancer prevalence. For the entire population, older age (OR = 1.47,p<.001, 95% CI, 1.26–1.71) and having health insurance (OR = 1.93,p<.001, 95% CI, 1.42–2.62) were all significantly associated with greater prevalence, whereas male sex was associated with lower prevalence (OR = 0.56,
p<.01, 95% CI, .40-.79). Associations between study covariates and cancer prevalence also varied by Hispanic ancestry. Findings underscore the importance of sociodemographic factors and health insurance in relation to cancer prevalence for Hispanics and highlight variations in cancer prevalence across Hispanic ancestry groups. Characterizing differences in cancer prevalence rates and their correlates is critical to the development and implementation of effective prevention strategies across distinct Hispanic ancestry groups.
OPEN ACCESS
Citation:Penedo FJ, Yanez B, Castañeda SF, Gallo L, Wortman K, Gouskova N, et al. (2016) Self-Reported Cancer Prevalence among Hispanics in the US: Results from the Hispanic Community Health Study/Study of Latinos. PLoS ONE 11(1): e0146268. doi:10.1371/journal.pone.0146268
Editor:Marcia Edilaine Lopes Consolaro, State University of Maringá/Universidade Estadual de Maringá, BRAZIL
Received:September 24, 2015
Accepted:December 15, 2015
Published:January 25, 2016
Copyright:© 2016 Penedo et al. This is an open access article distributed under the terms of the
Creative Commons Attribution License, which permits unrestricted use, distribution, and reproduction in any medium, provided the original author and source are credited.
Data Availability Statement:Permission to use the data was obtained from the Hispanic Community Health Study/Study of Latinos. Data are available upon request from The Hispanic Community Health Study/Study of Latinos whose publication committee may be contacted at the following email address:
Introduction
Hispanics/Latinos (hereafter referred to as Hispanics) are the largest and fastest growing ethnic group in the United States (U.S.). Numbering over 50 million, Hispanics comprised 16.3% of the U.S. population in 2010 and are estimated to account for 35% by 2050[1]. In 2009, cancer surpassed heart disease as the leading cause of death among Hispanics living in the U.S.[2] and accounted for 21% of all U.S. Hispanic deaths.
Relative to non-Hispanic Whites (NHWs), the Hispanic population shows substantial dis-parities in cancer prevalence, care, and outcomes[3]. Compared to NHWs, Hispanics in the U. S. have lower incidence rates for major cancers such as breast, lung, and prostate cancer; how-ever, they have higher incidence rates for cervical and gastrointestinal cancers, which are typi-cally associated with infections (e.g., Human Papillomavirus, hepatitis B) and are more prevalent in lower socioeconomic status (SES)[4] groups. Additionally, compared to NHWs, Hispanics are more likely to be diagnosed at an advanced stage of disease for most common cancers and have higher mortality rates for select cancers such as gastrointestinal, uterine, and cervical cancers,[5] largely due to lower rates of access to care, proper screening, and lack of early detection.
When examining cancer differences between NHWs and Hispanics, it is important to recog-nize that substantial variation may also exist within the Hispanic population as a function of Hispanic ancestry[4]. However, the available cancer incidence data for Hispanics in the U.S. are limited and poorly characterized in regard to country of origin, and generally focus on major ancestry groups (e.g., Mexicans, Puerto Ricans), thus overlooking other growing seg-ments of the U.S. Hispanic population (e.g., Dominicans, Central and South Americans)[4]. Studies that have examined cancer incidence by Hispanic ancestry generally indicate that Cubans are comparable to NHWs in regard to incidence of the most common cancers[6]. Overall, prior work suggests that Mexicans have the lowest cancer incidence among all His-panic ancestry groups. In contrast, Puerto Ricans consistently show the highest incidence rates of all Hispanic groups, particularly in regard to cervical, stomach and liver cancers[6].
Although sparse and limited in comprehensive assessment, previously published information regarding cancer incidence across Hispanic ancestry groups suggests that there may be impor-tant variations that warrant further investigation.
Differences in cancer incidence patterns among U.S. Hispanics may in part be due to sub-stantial variation with respect to well-established factors associated with a cancer diagnosis (e.g., smoking, poor diet quality, physical inactivity, poor access to preventive care). Socioeco-nomic status, acculturation, migration back to country of origin for cancer care and other health behavior patterns[2,7–11] may also affect cancer incidence estimates. For example, lim-ited access to health care and financial constraints observed in U.S. Hispanics have been associ-ated with lower cancer screening rates[12,13,14]. Poor access to health care also limits
opportunities for providers to counsel individuals on risks of tobacco use, poor nutrition, and physical inactivity[12]. The degree to which individuals have acculturated to the U.S. may also influence behavioral patterns related to a cancer diagnosis[11]. Acculturation, often assessed by English language acquisition, is related to the ability to understand physician recommenda-tions and navigate the healthcare system in order to engage in preventive healthcare services [15,16]. However, because many studies that have characterized cancer rates among Hispanics have relied on existing cancer registries, information regarding acculturation, access to health care, and other important factors associated with cancer (e.g., diet) is limited.
In light of the lack of data on cancer rates among Hispanics, specifically Hispanic ancestry groups, the aim of this paper was to describe the prevalence of self-reported cancer diagnoses among Hispanics living in four U.S. metropolitan areas who participated in the Hispanic North Carolina (N01-HC65233), University of Miami
(N01-HC65234), Albert Einstein College of Medicine HC65235), Northwestern University HC65236), and San Diego State University (N01-HC65237). The following institutes, centers, or offices contribute to the HCHS/SOL through a transfer of funds to the NHLBI: National Center on Minority Health and Health Disparities, the National Institute on Deafness and Other Communications Disorders, the National Institute of Dental and Craniofacial Research, the National Institute of Diabetes and Digestive and Kidney Diseases, the National Institute of Neurological Disorders and Stroke, and the Office of Dietary Supplements. The authors thank the staff and participants of HCHS/SOL for their important contributions. A complete list of staff and investigators was published in Ann Epidemiol. 2010; 20:642–649 and is also available on the study website,http://www. cscc.unc.edu/hchs/. The HCHS/SOL Sociocultural Ancillary Study was supported by grant 1 RC2 HL101649 from the NIH/NHLBI (Gallo/Penedo MPIs). The authors thank the staff and participants of HCHS/ SOL and the HCHS/SOL Sociocultural Ancillary Study for their important contributions. This research was also made possible by grants from Redes En Acción: The National Latino Cancer Research Network. This research was supported by a National Cancer Institute (NCI) Center to Reduce Cancer Health Disparities grant awarded to the University of Texas Health Science Center at San Antonio Health (Ramirez, PI; Penedo Midwest Region Co-PI/ Research Project PI; U01 CA114657-05 and U54 CA153511).
Community Health Study/Study of Latinos baseline examination. This study also characterizes how the prevalence of cancer diagnoses varies by Hispanic ancestry group and describes the relative associations of SES, age, sex, acculturation, health insurance, smoking, waist circumfer-ence, diet quality, self-reported physical activity, and cancer family history with cancer diagno-ses in a cross-sectional sample.
Materials and Methods
Hispanic Community Health Study/Study of Latinos
The Hispanic Community Health Study/Study of Latinos (HCHS/SOL) is a prospective, popu-lation based study of the prevalence of multiple health conditions and their risk factors among 16,415 diverse Hispanics ages 18–74 residing in four U.S. metropolitan areas[17]. The four communities included in the HCHS/SOL are located in the Bronx, NY; Chicago, IL; Miami, FL; and San Diego, CA. Participants in the HCHS/SOL self-identified as Cuban, Dominican, Puerto Rican, Mexican, Central or South American. A stratified two-stage area probability sample of household addresses was selected in each of the four field centers. Stratification was based on concentration of Hispanic households, and low versus high SES (as measured by the proportion of persons with at least a high school education), each based on the 2000 decennial Census. Participants aged 45–74 years were over-sampled. Once a household was selected, all eligible household members were invited to participate. Persons who met the eligibility criteria and agreed to participate were scheduled for an IRB-approved consenting and assessment appointment at each field center clinic. The study followed all ethical standards for human research and was approved by the Institutional Review Board of each of the four field centers as follows: Albert Einstein College of Medicine Institutional Review Board (New York); Bio-medical IRB of Northwestern University (Chicago); San Diego State University Institutional Review Board (San Diego); and the Social and Behavioral Sciences IRB at the University of Miami (Miami). Data presented in the form of frequencies are unweighted. Data presented in the form of percentage and means are weighted. Weighted data account for the disproportion-ate selection of the sample and to adjust for any bias due to differential nonresponse in the selected sample at the household and person levels. The weights were trimmed to limit preci-sion losses due to their variability, and calibrated to the 2010 Census characteristics by age, sex and Hispanic ancestry within each field site’s target population. All analyses also account for cluster sampling and the use of stratification in sample selection. Complete details regarding the study design and procedures have been previously reported[17].
Study Measures
obtained in 24-hour dietary recalls. Higher scores represent better diet. Physical activity was assessed using the Global Physical Activity Questionnaire (GPAQ) to quantify the number of minutes the participant engaged in moderate or vigorous activity related to work, transporta-tion and/or leisure activities. This informatransporta-tion was used to estimate a total metabolic equivalent task (METs) for each participant[22]. Higher scores represent more physical activity.
Familial history of cancer was assessed by asking the participant whether first-degree rela-tives such as a mother, father or sibling had ever been diagnosed with cancer. For analytic pur-poses, family cancer history was used as a binary indicator of a cancer diagnosis in a
participant’s immediate family (mother, father, or sibling). Participant cancer diagnoses were assessed by self-report, where participants were asked whether“a doctor ever said that you have cancer or a malignant tumor?”Fourteen types of cancer (e.g., breast, prostate, colon, cer-vical, brain, etc.) and an“other”category were queried; participants responded“yes”or“no”to each type of cancer. This self-report method has shown a good degree of accuracy in prior cohort studies[23]. Age, acculturation, waist circumference, physical activity, diet, and income were modeled as continuous variables; all other variables were binary, with the exception of the three-category smoking status variable.
Analyses
Descriptive statistics were used to characterize the sample. The prevalence of cancer diagnoses was calculated as a weighted proportion of participants who reported having been diagnosed with cancer at some point in their life and was then age-standardized to the 2010 U.S. Census. Prevalence of specific cancers was not age-standardized due to low sample sizes. For prevalence of cancer types (cervical, breast, colon, etc) by ancestry, percentage is reported as the percent of all cancers among that particular Hispanic ancestry group. A Rao-Scott chi-square test was used to detect a statistical difference in cancer prevalence among Hispanic ancestry groups. Follow-up between-groups chi-squared tests were used to compare statistical differences between each Hispanic ancestry group. Logistic regression was used to assess factors potentially associated with self-reported cancer diagnoses. Logistic regression was conducted using SAS 9.3 software (SAS PROC SURVEYLOGISTICS; SAS Institute, Cary, NC). All regression models accounted for the complex survey study design and used sampling weights. Missing data in covariates were handled by using multiple imputations. Eighteen percent of cases had missing data for one or more predictor variable. In order to address these missing data, twenty imputa-tions were run using SAS PROC MI and fully conditional specification (FCS). Each missing value was modeled using all predictor variables in the main analysis model as well as the survey sample variables (primary sample unit, weight, and strata). Results from all models using mul-tiple imputed data were summarized using SAS PROC MIANALYZE. Therefore, the only cases excluded from analysis were from participants missing information on a cancer diagnosis and those who endorsed multiple or“other”Hispanic backgrounds which altogether accounted for less than 4% of the sample.
Predictor variables that were entered into the logistic regression models were SES, age, sex, acculturation, health insurance status, smoking, waist circumference, diet, physical activity, and family history of cancer. All ten predictor variables were treated as covariates in the logistic regression models. The outcome was cancer prevalence.
significant interactions between Hispanic ancestry group and age, smoking, physical activity, and diet quality on cancer prevalence. A third model included covariates and only those inter-actions significant at the level ofp.05 from model two. Given that recruitment site is con-founded with Hispanic ancestry group (e.g., Cubans are predominantly recruited in Miami), recruitment site was added to a fourth logistic regression model to determine whether site was a significant correlate of cancer prevalence, and whether parameter estimates for Hispanic ancestry differed by greater than 10% between the third and fourth regression models. Because parameter estimates differed by more than 10% across models, we conducted a chi-square anal-ysis to examine whether differences in cancer prevalence within Hispanic ancestry existed across the recruitment sites. Our findings revealed that there were no significant differences in cancer prevalence (p.05) within Hispanic ancestry compared across recruitment sites where there was a sufficient sample size for comparison. Therefore, all subsequent analyses do not include recruitment site as a model covariate. Only results from the first and third model are presented as the second model was considered an intermediate step necessary for the develop-ment of the third model. When interpreting findings from the final logistic regression analyses, a more stringentp0.01 rather thanp0.05 was used to address family-wise error.
Results and Discussion
Participant Characteristics
From the overall sample of 16,415, a total of 15,802 (unweighted) fit the criteria for inclusion in analysis. Of the total 613 (unweighted) participants that were excluded, 523 were excluded because they identified with more than one or“other”Hispanic ancestry (e.g., South American and Cuban), 37 were excluded because their response to the question about having had a can-cer diagnosis was missing, and 53 were excluded because they identified with more than one or
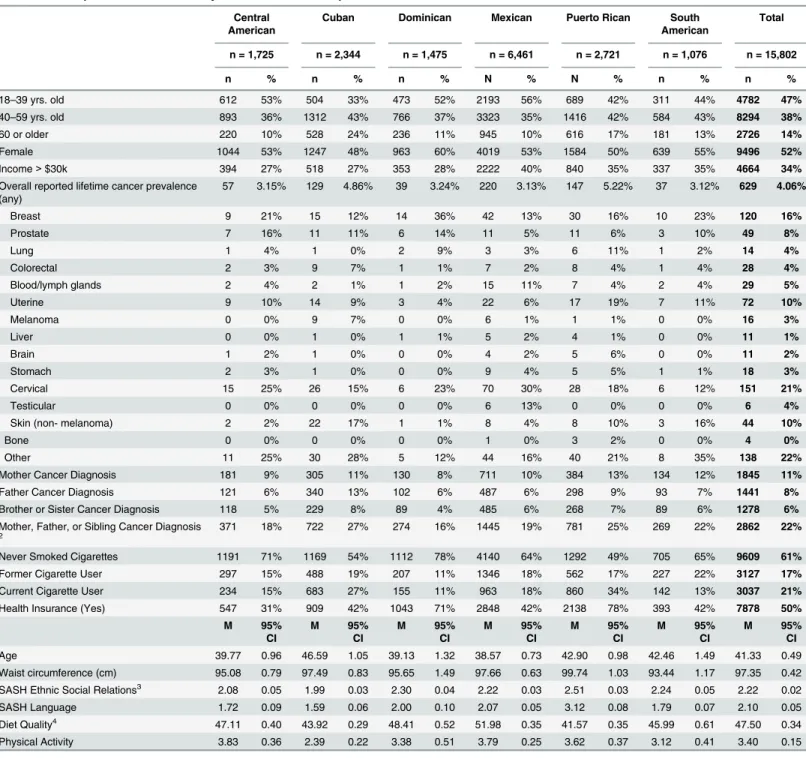
“other”Hispanic ancestry and had missing data on the cancer diagnosis question.Table 1 con-tains descriptive statistics for all the study variables and cancer prevalence rates for the target population. The mean age of the target population was approximately 40 years. The population consists of slightly more females than males. The majority of the population reported an annual household income of less than $30,000. Half of the population reported having health insurance. Current and former smokers account for less than half of the population and a minority of the population reported that an immediate family member (mother, father, or sib-ling) had been diagnosed with cancer. Scores on the SASH subscales indicated that on average the population was low in acculturation regarding language use and ethnic social relations.
Cancer Prevalence
Overall, four percent of the population reported having received a cancer diagnosis at some time in their lives. For the total population, the most common cancers were“other”(i.e., other cancers not specifically queried such as head and neck, hematological and renal carcinoma), followed by cervical and breast cancer (seeTable 1). The Rao-Scott chi- square test indicated a significant dif-ference among Hispanic ancestry groups with respect to overall cancer prevalence (x2= 41.18, p<.001). Follow-up chi-square analyses revealed that Cubans and Puerto Ricans had significantly higher overall reported cancer prevalence rates compared to all other Hispanic ancestry groups (ps<.01); however, Cubans and Puerto Ricans did not significantly differ from one another.
Correlates of Cancer Prevalence
Table 1. Descriptive statistics for study variables and cancer prevalence1.
Central American
Cuban Dominican Mexican Puerto Rican South American
Total
n = 1,725 n = 2,344 n = 1,475 n = 6,461 n = 2,721 n = 1,076 n = 15,802
n % n % n % N % N % n % n %
18–39 yrs. old 612 53% 504 33% 473 52% 2193 56% 689 42% 311 44% 4782 47%
40–59 yrs. old 893 36% 1312 43% 766 37% 3323 35% 1416 42% 584 43% 8294 38%
60 or older 220 10% 528 24% 236 11% 945 10% 616 17% 181 13% 2726 14%
Female 1044 53% 1247 48% 963 60% 4019 53% 1584 50% 639 55% 9496 52%
Income>$30k 394 27% 518 27% 353 28% 2222 40% 840 35% 337 35% 4664 34%
Overall reported lifetime cancer prevalence (any)
57 3.15% 129 4.86% 39 3.24% 220 3.13% 147 5.22% 37 3.12% 629 4.06%
Breast 9 21% 15 12% 14 36% 42 13% 30 16% 10 23% 120 16%
Prostate 7 16% 11 11% 6 14% 11 5% 11 6% 3 10% 49 8%
Lung 1 4% 1 0% 2 9% 3 3% 6 11% 1 2% 14 4%
Colorectal 2 3% 9 7% 1 1% 7 2% 8 4% 1 4% 28 4%
Blood/lymph glands 2 4% 2 1% 1 2% 15 11% 7 4% 2 4% 29 5%
Uterine 9 10% 14 9% 3 4% 22 6% 17 19% 7 11% 72 10%
Melanoma 0 0% 9 7% 0 0% 6 1% 1 1% 0 0% 16 3%
Liver 0 0% 1 0% 1 1% 5 2% 4 1% 0 0% 11 1%
Brain 1 2% 1 0% 0 0% 4 2% 5 6% 0 0% 11 2%
Stomach 2 3% 1 0% 0 0% 9 4% 5 5% 1 1% 18 3%
Cervical 15 25% 26 15% 6 23% 70 30% 28 18% 6 12% 151 21%
Testicular 0 0% 0 0% 0 0% 6 13% 0 0% 0 0% 6 4%
Skin (non- melanoma) 2 2% 22 17% 1 1% 8 4% 8 10% 3 16% 44 10%
Bone 0 0% 0 0% 0 0% 1 0% 3 2% 0 0% 4 0%
Other 11 25% 30 28% 5 12% 44 16% 40 21% 8 35% 138 22%
Mother Cancer Diagnosis 181 9% 305 11% 130 8% 711 10% 384 13% 134 12% 1845 11%
Father Cancer Diagnosis 121 6% 340 13% 102 6% 487 6% 298 9% 93 7% 1441 8%
Brother or Sister Cancer Diagnosis 118 5% 229 8% 89 4% 485 6% 268 7% 89 6% 1278 6%
Mother, Father, or Sibling Cancer Diagnosis
2
371 18% 722 27% 274 16% 1445 19% 781 25% 269 22% 2862 22%
Never Smoked Cigarettes 1191 71% 1169 54% 1112 78% 4140 64% 1292 49% 705 65% 9609 61%
Former Cigarette User 297 15% 488 19% 207 11% 1346 18% 562 17% 227 22% 3127 17%
Current Cigarette User 234 15% 683 27% 155 11% 963 18% 860 34% 142 13% 3037 21%
Health Insurance (Yes) 547 31% 909 42% 1043 71% 2848 42% 2138 78% 393 42% 7878 50%
M 95%
CI
M 95%
CI
M 95%
CI
M 95%
CI
M 95%
CI
M 95%
CI
M 95%
CI
Age 39.77 0.96 46.59 1.05 39.13 1.32 38.57 0.73 42.90 0.98 42.46 1.49 41.33 0.49
Waist circumference (cm) 95.08 0.79 97.49 0.83 95.65 1.49 97.66 0.63 99.74 1.03 93.44 1.17 97.35 0.42
SASH Ethnic Social Relations3 2.08 0.05 1.99 0.03 2.30 0.04 2.22 0.03 2.51 0.03 2.24 0.05 2.22 0.02
SASH Language 1.72 0.09 1.59 0.06 2.00 0.10 2.07 0.05 3.12 0.08 1.79 0.07 2.10 0.05
Diet Quality4 47.11 0.40 43.92 0.29 48.41 0.52 51.98 0.35 41.57 0.35 45.99 0.61 47.50 0.34
Physical Activity 3.83 0.36 2.39 0.22 3.38 0.51 3.79 0.25 3.62 0.37 3.12 0.41 3.40 0.15
Note
1Overall cancer prevalence is based on self-report and age-standardized to the 2010 US Census. Self-reported prevalence of specific cancers is not
age-standardized due to low sample size. For cancer types (cervical, breast, colon, etc) percentage is reported as the percent of all cancers among that particular Hispanic ancestry group.
2Some participants had both a mother and a father with a cancer diagnosis but were only counted once in the immediate family variable. 3SASH is the Short Acculturation Scale for Hispanics, range is 1–5.
4Range is 0–110.
significant effect for age, sex, and health insurance on cancer prevalence. For all Hispanics, each 10-year increase in age was associated with higher odds of having been diagnosed with cancer. Compared to females, Hispanic males had lower odds of having been diagnosed with cancer. Hispanics with health insurance had higher odds of having been diagnosed with cancer. Follow-up descriptive statistics revealed that among Hispanics diagnosed with cancer, 28.6% did not have health insurance whereas 71.4% were insured. Among Hispanics not diagnosed with cancer, 50.5% did not have health insurance and 49.5% were insured. Although the find-ing was marginally significant at thep<.01 level (p= .0102), Hispanics with an immediate family member with cancer had higher odds of having been diagnosed with cancer.
Findings from the third model contain study covariates and only those Hispanic ancestry by risk interactions significant at the level ofp<.05 from model two. Results indicated a finding for diet quality. Although the odds ratio for the main effect of diet quality was not significant at thep<.01 level (OR = 1.02; .99–1.05 95% CI), the association of diet quality with cancer prev-alence varied significantly by Hispanic ancestry such that for each one-point increase on the AHEI 2010 diet quality measure, Dominicans had lower odds (OR = .86; .79-.93 95% CI) of having been diagnosed with cancer relative to Mexicans.
This study sought to report the cancer prevalence rate in a diverse sample of Hispanics liv-ing in four U.S. metropolitan areas participatliv-ing in the Hispanic Community Health Study/ Study of Latinos (HCHS/SOL), the largest epidemiologic study of U.S. Hispanics’health to date. An additional goal of this study was to determine the relative associations of age, sex, SES, acculturation, health insurance status, smoking, waist circumference, diet quality, physical activity, and family history of cancer with lifetime cancer prevalence. Furthermore, the study evaluated differences in factors associated with cancer prevalence across six Hispanic ancestry groups. While prior studies have reported the prevalence or incidence of cancer in the U.S. His-panic population, most of these studies have been based on cancer registries with limited ethnic self-identification and have lacked a comprehensive set of SES, acculturation, and behavioral risk factor (e.g., smoking, diet, etc.) indicators[4,5]. Our findings indicate that four percent (n = 629) of the population reported a diagnosis of cancer at any point in their lives. The cancer prevalence in the current study is greater than the 2.27% age-adjusted 19-year point prevalence Table 2. Logistic Regression Odds Ratios for Covariates on Cancer Prevalence for Model containing all Hispanics (N = 15,802).
Parameter p Odds Ratio Lower CI Upper CI
Model Intercept <.001 0.004 0.001 0.01
Age (per 10 year increase) <.001 1.47 1.26 1.71
Sex (Male) <0.01 0.56 0.40 0.79
Income>$30k 0.16 0.95 0.89 1.02
Former Cigarette User 0.07 1.38 0.97 1.97
Current Cigarette User 0.64 0.90 0.57 1.41
Physical Activity 0.31 0.98 0.95 1.01
Health Insurance (Yes) <.001 1.93 1.42 2.62
Family Diagnosis of Cancer 0.02 1.32 1.04 1.67
SASH Social1 0.35 0.87 0.66 1.16
SASH Language1 0.20 1.13 0.94 1.37
Waist Circumference 0.61 1.01 0.97 1.06
Diet Quality 0.83 1.01 0.98 1.03
Note..
1SASH is the Short Acculturation Scale for Hispanics.
reported in by the Surveillance, Epidemiology, and End Results Program (SEER)[24]. The dif-ference in these numbers may be accounted by the fact that the SEER data reflects a 19-year time frame whereas our study examined prevalence of cancer at any point in the participants’ lives. Nonetheless, although our data were weighted to the mean age of Hispanics at each recruitment site, which is a younger average age than the U.S. population, our cancer preva-lence rates remained higher relative to SEER[24].
Our cross-sectional findings regarding cancer self-reported prevalence are consistent with previous longitudinal research indicating that Cubans and Puerto Ricans have the highest inci-dence relative to the other four Hispanic ancestry groups[6,25]. Findings regarding associations with cancer prevalence for the entire Hispanic population indicated that older age, female sex, and having health insurance were all associated with a diagnosis of cancer. The significant associ-ation we found between older age and cancer diagnosis is consistent with previous findings [2,12,26,27]. However, that women are more likely to be diagnosed with cancer than men is inconsistent with SEER data showing that Hispanic men are more likely to be diagnosed with cancer[2]. This finding could be explained by the high number of cervical cancer diagnoses reported by participants, which is consistent with previous research that Hispanic women are more likely to be diagnosed with cervical cancer than non-Hispanic White women[2]. Another possible explanation for the greater number of females diagnosed with cancer is that female par-ticipants were younger than male parpar-ticipants, and as females are diagnosed with cancer at an earlier age than males[28], the broad age range in our sample likely contributed to this difference. This broad age range in our sample may have also contributed to the lower prevalence of breast cancer relative to cervical cancer, as women with cervical cancer are more likely to be diagnosed at a younger age than women with breast cancer[29]. Our findings also showed an association between health insurance status and cancer prevalence, which is most likely an indirect relation-ship explained by cancer screening and access to health care. Although cancer screening behavior data were not available for this study, one possibility is that individuals with health insurance have greater cancer screening rates and access to physician visits that increase the likelihood of cancer detection, whereas individuals without health insurance have fewer opportunities to be screened and receive a cancer diagnosis. It is also possible that individuals with a history of cancer elected to enroll in health insurance as a result of their diagnosis. Our findings also indicate that a better quality diet is associated with lower odds of a cancer diagnosis for Dominicans when com-pared to Mexicans. Future longitudinal studies focused on Hispanic group differences in diet quality may shed some light into diet quality and cancer risk.
The present study contributes to our current understanding of cancer prevalence in Hispan-ics in the U.S. in several ways. First, our findings indicate that sociodemographic factors such as sex and insurance status are factors associated with cancer prevalence for Hispanics. Other sociodemographic factors such as income and socio-cultural factors such as acculturation were not associated with cancer prevalence for Hispanics. Second, our findings show that there are differences in the cancer prevalence rate by Hispanic ancestry groups, even after adjusting for covariates. Finally, although diet quality was not significantly associated with cancer prevalence for the entire Hispanic sample, results show that diet quality may be differentially related to a cancer diagnosis for certain Hispanic ancestry groups but not others.
that aim to describe the predictive utility of factors associated with cancer among Hispanic ances-try groups should involve longitudinal designs that allow for evaluation of prospective associa-tions or predictive models. Furthermore, the 4% cancer prevalence rate and limited number of cancer diagnoses across each cancer site did not allow us to explore differences in prevalence and factors associated with cancer across unique cancer sites. It is also important to note that this study reported cancer prevalence as opposed to incidence and as a result these data do not cap-ture Hispanics who were diagnosed with cancer but did not survive through the point of study entry. As such, prevalence rates might reflect potential differences in cancer diagnoses among Hispanics or reflect differences in the survival patterns of cancers due to participants diagnosed with more aggressive cancer such as lung cancer (more common among men) expiring before participation in this study or the latency between behaviors such as smoking and the develop-ment of cancer. Given the long latency period between smoking and cancer, coupled with the rel-ative young age of the sample, participants may not have developed cancer by the time of study participation. Therefore, more longitudinal research is needed to better investigate determinants of the development of cancer over time among Hispanics. Finally, cancer prevalence was deter-mined by self-report. Due to high rates of uninsured, low SES participants, it is likely that cancer screening was less than optimal and therefore possible that a significant number of our partici-pants had undetected cancers that we were not able to capture.
Conclusions
Hispanics in the U.S. encompass a growing heterogeneous population with varying cancer prevalence and risk attributed to access to health care status and age. Although behavioral fac-tors such as smoking are linked to cancer [2,30], findings from our study did not reveal signifi-cant relationships with smoking and cancer prevalence. The lack of signifisignifi-cant findings regarding smoking may be due to the cross-sectional nature of our study, underscoring the need for longitudinal research focusing on diverse Hispanics living in the U.S. To develop and implement effective prevention strategies, it is critical that we understand how risk factors and their contribution to cancer prevalence may vary across distinct Hispanic ancestry groups. It is clear that access to health care continues to be a major factor associated with cancer prevalence among Hispanics in the U.S. As the Affordable Care Act is implemented, a growing number of Hispanics will be accessing the U.S. health care system and undergoing screening for the most common cancers. Future evaluation of cancer prevalence across Hispanic ancestry within the context of universal health care access will provide insight into whether disparities across His-panic groups persist despite such access.
Acknowledgments
Permission to use the data was obtained from the Hispanic Community Health Study/Study of Latinos (HCHS/SOL) publications committee. The authors thank the staff and participants of HCHS/SOL and the HCHS/SOL Sociocultural Ancillary Study for their important contribu-tions. A complete list of staff and investigators was published in Ann Epidemiol. 2010; 20:642– 649 and is also available on the study website,http://www.cscc.unc.edu/hchs/. The HCHS/SOL publications committee had a role in the design of the study, in the collection, analysis, and interpretation of the data, and in the review and approval of the manuscript.
Author Contributions
interpretation: SFC NG MS WA ML LSJ PG LVH AGR. Discussion: MS LSJ PG. Implications: MS AGR. Literature review: CB AGR. Contributed to writing methods: CB. Data analysis and interpretation: AWR.
References
1. Profile America facts for features. 2011;https://www.census.gov/newsroom/releases/archives/facts_ for_features_special_editions/cb11-ff18.html.
2. American Cancer Society. Cancer facts & figures for Hispanics/Latinos 2012–2014. 2012;http://www. cancer.org/research/cancerfactsfigures/cancerfactsfiguresforhispanicslatinos/cancer-facts-figures-hispanics-2012-2014.
3. Siegel R, Naishadham D, Jemal A (2012) Cancer statistics for Hispanics/Latinos, 2012. CA Cancer J for Clin 62: 283–298.
4. O'Brien K, Cokkinides V, Jemal A, Cardinez CJ, Murray T, Samuels A, et al. (2003) Cancer Statistics for Hispanics, 2003. CA Cancer J Clin 53: 208–226. PMID:12924775
5. Howe HL, Wu X, Ries LAG, Cokkinides V, Ahmed F, Miller B, et al. (2006) Annual report to the nation on the status of cancer, 1975–2003, featuring cancer among U.S. Hispanic/Latino populations. Cancer 107: 1711–1742. PMID:16958083
6. Pinheiro PS, Sherman RL, Trapido EJ, Fleming LE, Huang Y, Gomez-Martin O, et al. (2009) Cancer incidence in first generation US Hispanics: Cubans, Mexicans, Puerto Ricans, and new Latinos. Cancer Epidemiol Biomarkers Prev 18: 2162–2169. doi:10.1158/1055-9965.EPI-09-0329PMID:19661072
7. Coups EJ, Ostroff JS (2005) A population-based estimate of the prevalence of behavioral risk factors among adult cancer survivors and noncancer controls. Prev Mep 40: 702–711.
8. The burden of cancer. 2014;http://www.cancer.gov/cancertopics/pdq/prevention/overview/ HealthProfessional.
9. Ramirez AG, Pérez-Stable EJ, Talavera GA, Penedo FJ, Carrillo JE, Fernandez ME, et al. (2013) Time to definitive diagnosis of breast cancer in Latina and non-Hispanic white women: the six cities study. Springerplus 2: 84. doi:10.1186/2193-1801-2-84PMID:23519779
10. Cokkinides VE, Bandi P, Siegel RL, Jemal A (2012) Cancer‐related risk factors and preventive mea-sures in US Hispanics/Latinos. CA Cacner J Clin 62: 353–363.
11. Johnson-Kozlow M (2010) Colorectal cancer screening of Californian adults of Mexican origin as a function of acculturation. J Immigr Minor Health 12: 454–461. doi:10.1007/s10903-009-9236-9PMID: 19252984
12. Ward E, Halpern M, Schrag N, Cokkinides V, DeSantis C, et al. (2008) Association of insurance with cancer care utilization and outcomes. CA Cancer J Clin 58: 9–31. PMID:18096863
13. Brown A, Patten E. Statistical portrait of hispanics in the united states, 2012. 2014;http://www. pewhispanic.org/2014/04/29/statistical-portrait-of-hispanics-in-the-united-states-2012/.
14. Selvin E, Brett KM (2003) Breast and cervical cancer screening: sociodemographic predictors among White, Black, and Hispanic women. Am J Public Health Resh 93: 618–623.
15. Ramirez AG, Suarez L, Laufman L, Barroso C, Chalela P (2000) Hispanic women's breast and cervical cancer knowledge, attitudes, and screening behaviors. Am J Health Promot 14: 292–300. PMID: 11009855
16. Diaz JA, Roberts MB, Goldman RE, Weitzen S, Eaton CB (2008) Effect of language on colorectal can-cer screening among Latinos and non-Latinos. Cancan-cer Epidemiol Biomarkers Prev 17: 2169–2173. doi: 10.1158/1055-9965.EPI-07-2692PMID:18708410
17. Sorlie PD, Avilés-Santa LM, Wassertheil-Smoller S, Kaplan RC, Daviglus ML, et al. (2010) Design and implementation of the Hispanic Community Health Study/Study of Latinos. Ann Epidemiol 20: 629– 641. doi:10.1016/j.annepidem.2010.03.015PMID:20609343
18. Marin G, Sabogal F, Marin BV, Otero-Sabogal R, Perez-Stable EJ (1987) Development of a short accul-turation scale for Hispanics. Hisp J Behav Sci 9: 183–205.
19. Kaplan RC, Bangdiwala SI, Barnhart JM, Castañeda SF, Gellman MD, Lee DJ, et al. (2014) Smoking among US Hispanic/Latino adults: the Hispanic community health study/study of Latinos. Am J Preve Med 46: 496–506.
20. Lee K, Song YM, Sung J (2008) Which obesity indicators are better predictors of metabolic risk?: healthy twin study. Obesity 16: 834–840. doi:10.1038/oby.2007.109PMID:18239595
22. Daviglus ML, Talavera GA, Avilés-Santa ML, Allison M, Cai J, Criqui MH, et al. (2012) Prevalence of major cardiovascular risk factors and cardiovascular diseases among Hispanic/Latino individuals of diverse backgrounds in the United States. JAMA 308: 1775–1784. doi:10.1001/jama.2012.14517 PMID:23117778
23. Bergmann MM, Byers T, Freedman DS, Mokdad A (1998) Validity of self-reported diagnoses leading to hospitalization: a comparison of self-reports with hospital records in a prospective study of American adults. Am J Epidemiol 147: 969–977. PMID:9596475
24. SEER Stat Fact Sheets: All Cancer Sites.http://seer.cancer.gov/statfacts/html/all.html.
25. Martinez-Tyson D, Pathak EB, Soler-Vila H, Flores AM (2009) Looking under the Hispanic umbrella: cancer mortality among Cubans, Mexicans, Puerto Ricans and other Hispanics in Florida. J Immigr Minor Health 11: 249–257. doi:10.1007/s10903-008-9152-4PMID:18506623
26. Thompson IM, Ankerst DP, Chi C, Goodman PJ, Tangen CM, Lucia SM, et al. (2006) Assessing pros-tate cancer risk: results from the Prospros-tate Cancer Prevention Trial. Journal of the National Cancer Insti-tute 98: 529–534. PMID:16622122
27. Amir E, Freedman OC, Seruga B, Evans DG (2010) Assessing women at high risk of breast cancer: a review of risk assessment models. J Natl Cancer Inst 102: 680–691. doi:10.1093/jnci/djq088PMID: 20427433
28. American Cancer Society. Cancer facts & figures 2014. Special section: Childhood & Adolescent Can-cers 2014;http://www.cancer.org/research/cancerfactsstatistics/cancerfactsfigures2014/index.
29. Median Age of Cancer Patients at Cancer Diagnosis, 2007–2011. SEER Cancer Statistics Review 1975–2011.http://seer.cancer.gov/archive/csr/1975_2011/results_merged/topic_med_age.pdf