Comparison of SEER Treatment Data With
Medicare Claims
Anne-Michelle Noone, MS,*
Jennifer L. Lund, PhD,
w
Angela Mariotto, PhD,*
Kathleen Cronin, PhD,*
Timothy McNeel, BA,
z
Dennis Deapen, DrPH,
y
and Joan L. Warren, PhD
8
Background:The population-based Surveillance, Epidemiology, and End Results (SEER) registries collect information on first-course treatment, including surgery, chemotherapy, radiation therapy, and hormone therapy. However, the SEER program does not release data on chemotherapy or hormone therapy due to uncertainties regarding data completeness. Activities are ongoing to investigate the oppor-tunity to supplement SEER treatment data with other data sources.
Methods:Using the linked SEER-Medicare data, we examined the validity of the SEER data to identify receipt of chemotherapy and radiation therapy among those aged 65 and older diagnosed from 2000 to 2006 with bladder, female breast, colorectal, lung, ovarian, pancreas, or prostate cancer and hormone therapy among men di-agnosed with prostate cancer at age 65 or older. Treatment collected by SEER was compared with treatment as determined by Medicare
claims, using Medicare claims as the gold standard. The k, sensi-tivity, specificity, positive predictive values, and negative predictive values were calculated for the receipt of each treatment modality.
Results: The overall sensitivity of SEER data to identify chemo-therapy, radiation, and hormone therapy receipt was moderate (68%, 80%, and 69%, respectively) and varied by cancer site, stage, and patient characteristics. The overall positive predictive value was high ( > 85%) for all treatment types and cancer sites except chemo-therapy for prostate cancer.
Conclusions: SEER data should not generally be used for com-parisons of treated and untreated individuals or to estimate the proportion of treated individuals in the population. Augmenting SEER data with other data sources will provide the most accurate treatment information.
Key Words:SEER, Medicare, treatment, validation, chemotherapy
(Med Care2016;54: e55–e64)
T
he Surveillance, Epidemiology, and End Results (SEER) program, sponsored by the National Cancer Institute (NCI), is a system of population-based cancer registries that currently covers approximately 28% of the US population from geographically defined areas. In addition to reporting national cancer statistics on incidence and survival, the SEER registries serve as a platform for studies of cancer-related care and health disparities. As such there is considerable interest in treatment information for individuals diagnosed with cancer captured in the population-based registries. The SEER registries routinely collect data on the first course of cancer treatment including information on surgery, radiation therapy (RT), chemotherapy (CT), and hormone therapy (HT). Information on surgery and RT is reported in the publically available SEER dataset, although several studies have reported underascertainment of RT on the SEER data.1,2 NCI does not make data on CT and HT publically available due to concerns about the completeness of the information.Persons in the SEER data who are Medicare eligible have been matched to their Medicare claims to create the linked SEER-Medicare data. The SEER-Medicare data in-clude longitudinal claims, allowing for the identification of cancer treatments from Medicare claims for cancer patients appearing in the SEER data.3Prior validation studies have shown that Medicare claims can accurately identify persons From the*Division of Cancer Control and Population Sciences, Surveillance
Research Program, National Cancer Institute, Bethesda, MD;w Depart-ment of Epidemiology, Gillings School of Public Health, University of North Carolina at Chapel Hill, Chapel Hill, NC; zInformation Man-agement Services Inc., Calverton, MD;yLos Angeles Cancer Surveil-lance Program, Keck School of Medicine, University of Southern California, Los Angeles, CA; and8Division of Cancer Control and Population Sciences, Applied Research Program, National Cancer In-stitute, Bethesda, MD.
D.D. would like to acknowledge the following funding sources: The collection of cancer incidence data used in this study was supported by the California Department of Public Health as part of the statewide cancer reporting program mandated by California Health and Safety Code Section 103885; the National Cancer Institute’s Surveillance, Epidemiology and End Re-sults Program under contract HH5N261201000140C awarded to the Can-cer Prevention Institute of California, contract HHSN261201000035C awarded to the University of Southern California, and contract HHSN261201000034C awarded to the Public Health Institute; and the Centers for Disease Control and Prevention’s National Program of Cancer Registries, under agreement U58DP003862-01 awarded to the California Department of Public Health.
The authors declare no conflict of interest.
Reprints: Anne-Michelle Noone, MS, Division of Cancer Control and Population Sciences, Surveillance Research Program, National Cancer Institute, 9609 Medical Center Drive, Bethesda, MD 20850. E-mail: [email protected].
Supplemental Digital Content is available for this article. Direct URL cita-tions appear in the printed text and are provided in the HTML and PDF versions of this article on the journal’s Website, www.lww-medical care.com.
Copyrightr2014 Wolters Kluwer Health, Inc. All rights reserved. This is an open-access article distributed under the terms of the Creative Commons Attribution-Non Commercial-No Derivatives License 4.0 (CCBY-NC-ND), where it is permissible to download and share the work provided it is properly cited. The work cannot be changed in any way or used commercially. ISSN: 0025-7079/16/5409-0e55
A
PPLIEDM
ETHODSreceiving RT1,4,5 and CT.6–10 Several studies have used Medicare claims to identify individuals who received HT11–13although these claims have not been validated.
Activities are ongoing at NCI to further investigate the opportunity and benefit of using claims to supplement treatment data. The linkage of the SEER and Medicare data offers the opportunity to validate treatment reported on the SEER data, using Medicare claims as the gold standard. As an initial step, this analysis will evaluate the completeness and validity of SEER treatment data. We compared treatment data from SEER with Medicare claims for (1) CT among individuals diagnosed with bladder, female breast, color-ectal, lung, ovarian, pancreas, and prostate cancer; (2) RT among individuals diagnosed with these cancers except ovarian; and (3) HT among individuals diagnosed with prostate cancer. The concordance of treatment between the 2 data sources was estimated across a number of covariates including cancer site, stage, sex, age, race/ethnicity, geo-graphic location, and year of diagnosis. The sensitivity, specificity, positive predictive value (PPV), and negative predictive value (NPV) of SEER treatment variables were also estimated across the same covariates using Medicare claims as the gold standard.
METHODS
Data Sources
The SEER-Medicare data used for this study included cases reported from 17 SEER cancer registries, with the exception of Alaska Natives. To augment available public use of SEER data, we were able to access internal NCI data that included information about CT and HT administration collected by the SEER registries. This internal information and publically available information on RT was used for comparison to Medicare treatment information.
Individuals in the SEER data have been matched to Medicare’s master enrollment file maintained by the Centers for Medicare and Medicaid Services (CMS).14 For persons reported to a SEER registry who were aged 65 or older, 94% have been linked to Medicare and their Medicare claims have been extracted.15–17 For this analysis, we included claims from inpatient hospitalizations (MEDPAR), out-patient facilities, physician claims, or durable medical equipment (DME). These files include claims for CT, RT, and injected HT for each beneficiary with fee-for-service coverage.17All Medicare claims include codes that indicate the type of services performed. Services are reported using the International Classification of Diseases, Ninth Revision (ICD-9), Healthcare Common Procedure Coding System (HCPCS), and National Drug Codes (NDCs). In general, oral agents for CT are covered by Medicare Part D and so could not be captured in this analysis. However, oral chemo-therapeutic agents that are equivalent to those intravenously administered, such as capecitabine, are covered as a part of Medicare Part B and could be identified in our study.
Study Sample
We identified 433,415 individuals in the SEER-Medi-care data who were diagnosed with bladder, female breast,
colorectal, lung, ovary, pancreas, or prostate cancer from 2000 to 2006 for analysis. For inclusion in our study, in-dividuals had to be at least 65 years of age at diagnosis, have continuous Part A, B, and fee-for-service coverage and not be enrolled in a Health Maintenance Organization during that year, and only have 1 cancer according to SEER data. These criteria were implemented to ensure complete Medi-care claims for all individuals and so that any treatment identified using claims would be attributed to the correct cancer. In addition, those diagnosed on autopsy or death certificate (n = 9276) or without a known month of diagnosis (n = 4984) were excluded. A small number of individuals were part of the Patterns of Care (POC) studies performed by the SEER registries which involve obtaining more detailed information about CT and HT verified by the treating physician. These individuals were excluded as we were in-terested in the routine collection of SEER data (n = 2671).18
Identification of Treatment
Treatment information was identified independently from the SEER data and from Medicare claims. SEER col-lects information on the first course of therapy. As in-dividuals initiate therapy at different times postdiagnosis, cancer registrars update treatment information as it becomes available. For analysis, SEER treatment data for CT, RT, and HT were classified as received, not received, or unknown.
Treatment information for CT, RT, and HT was identified from Medicare claims data by reviewing the MEDPAR, outpatient, physician, and DME claims for 12 months after diagnosis. The first of the month and year of diagnosis reported by SEER registries was used as the di-agnosis date. An individual was considered to have received CT, RT, or HT if at least 1 Medicare claim included a code for each specific treatment and to not have received treat-ment if no claims for the specific treattreat-ments were found. Thus, no individual had an unknown treatment status from the Medicare data. Codes used to identify treatment are listed in Table (Supplemental Digital Content 1, http://links.lww. com/MLR/A665, which lists codes).
Comparison of SEER and Medicare Treatment
Data
claims window length. Concordance between the 2 data sources was quantified with thek statistic and the percent agreement which was defined as the proportion of in-dividuals with the same reported treatment receipt from SEER and Medicare data (ie, the number of individuals where SEER data and Medicare claims agree about treatment receipt/total number of individuals with treatment recorded in SEER). Neither of these quantities assumes a gold standard but the k statistic does account for agreement occurring by chance alone.
RESULTS
Our analysis included a total of 433,415 individuals diagnosed with the selected cancers. Twenty-seven percent of individuals were diagnosed with prostate cancer followed by lung (24%), female breast (18%), and colorectal (18%) (Table 1). The remaining individuals were diagnosed with bladder, pancreatic, or ovarian cancer (7%, 5%, and 2%, respectively). The majority of individuals were diagnosed at localized or regional stage except for individuals with cancer of the lung, pancreas, or ovary who were primarily diagnosed with distant stage disease. Our study included individuals who were predominantly non-Hispanic whites (82%) and diagnosed at ages 65–79 years.
CT
A total of 415,341 individuals were included in the comparison of CT after excluding 4.2% with unknown CT status from SEER. For all cancers combined, there was a high level of agreement between the Medicare claims and the SEER data (90%, Fig. 1), attributable to the fact that most individuals did not receive CT. The majority of discordant findings were individuals identified as receiving CT using Medicare claims but not receiving CT using SEER data.
The sensitivity of SEER data to identify individuals who received CT was 68% overall and varied by patient and tumor characteristics (Table 2). The sensitivity of SEER data was highest for ovarian cancer and lowest for bladder and prostate cancers (84%, 22%, and 7%, respectively). In ad-dition, the sensitivity decreased with age for all cancers combined, specifically 74% for individuals aged 65–69 compared with 47% for those aged 85 and older. The sen-sitivity was low for detecting CT in individuals diagnosed with in situ or localized disease. In addition, there was some variation in sensitivity by registry (range, 60%–78%). The sensitivity, however, did not vary greatly based on year of diagnosis (data not shown), sex, or race with the exception of individuals with unknown race.
The poor results for prostate cancer did not, however, greatly affect the overall results because so few men receive CT as first-course therapy. Specifically, among men with all cancer sites combined, the sensitivity was 62.3% and mod-estly increased to 66.3% when prostate cancer was excluded. Finally, we further investigated potential misclassification of men with prostate cancer who had a claim for CT admin-istration that may have been used for delivery of HT. We considered additional CT administration claims found on the same day as HT but the number of men with these additional
codes was small and hence their impact on the overall results would be minimal.
Overall the PPV was high indicating that among those identified in the SEER data as receiving CT, the vast ma-jority also had Medicare claims for CT (Table 2). The k statistics showed a moderate level of agreement overall and also followed a similar pattern to sensitivity and PPV. The specificity (range, 93%–100%) and NPV (range, 80%–99% excluding bladder) were high across all characteristics (Table, Supplemental Digital Content 2, http://links.lww. com/MLR/A666, which shows additional statistics for CT). Finally, as an addition to the sensitivity analysis we eval-uated the individuals excluded because of unknown CT in SEER data and found them to have similar rate of CT as those with known CT status (72% vs. 76%, respectively).
RT
Overall 2.8% of individuals had unknown RT status reported in the SEER data, thus 412,350 patients were available for comparison. The overall agreement between Medicare claims and the SEER data for identifying RT was high (91%, Fig. 1). The majority of discordant findings were individuals identified as receiving RT using Medicare claims but were not identified using SEER data (7.4%).
The sensitivity of SEER data to identify individuals who received RT was 80% overall and varied by patient and tumor characteristics (Table 3). The sensitivity of SEER data was highest for prostate cancer (85%), lowest for bladder (54%), and ranged between 66% and 80% for the remaining cancer sites. The sensitivity decreased by year of diagnosis (data not shown, range, 82%–78%) and increasing age (range, 81%–65%). The sensitivity did not vary greatly by stage or race with the exception of low sensitivity of in-dividuals in the unstaged or unknown race categories.
For all cancer sites combined, the PPV of RT on the SEER data was 95%. Although there was some variation in PPV by patient and tumor characteristics, the PPV was high for all cancer sites. The overallkstatistics were moderate to strong and followed a similar pattern as sensitivity and PPV. In addition, the overall specificity and NPV were high. The specificity overall was 97% and ranged between 94% and 100% by characteristic and the NPV was 89% overall and ranged from 82% to 96% (Table, Supplemental Digital Content 3, http://links.lww.com/MLR/A667, which shows additional statistics for RT). For all cancer sites combined, 73% of those with unknown RT in the SEER data did not have claims, ranging from 90% for colorectal cancer to 60% for breast cancer.
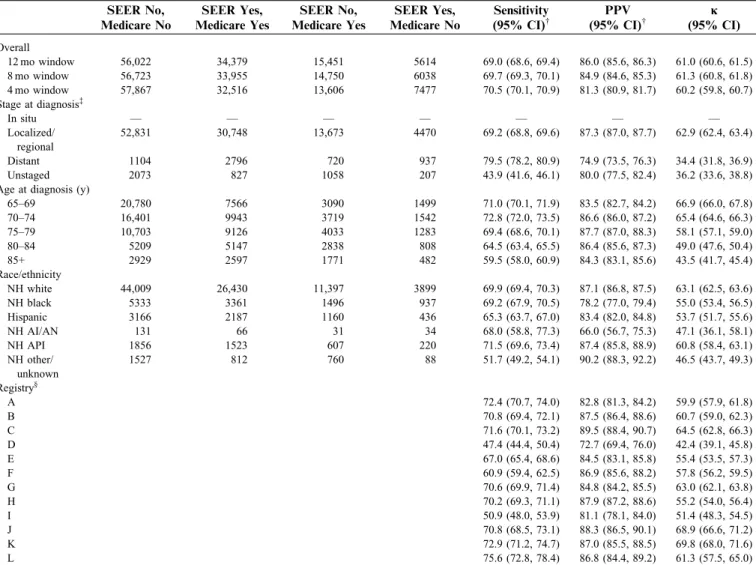
HT
A total of 115,724 men with prostate cancer were in the study cohort and 111,466 had known HT status recorded in the SEER data and were included in the analysis of HT. The overall agreement between SEER and Medicare was 81% (Fig. 1).
The sensitivity of the SEER data to identify HT was 69% and followed a similar pattern to CT. Specifically, the sensitivity was lower for localized/regional stage or un-known stage disease and decreased with increasing age Medical Care Volume 54, Number 9, September 2016 SEER Treatment Data Compared With Medicare
TABLE 1. Characteristics of 433,415 Individuals Diagnosed With Selected Cancers and Included in Analysis by Cancer Site
N (%)
Bladder Female Breast Colorectal Lung Ovary Pancreas Prostate
N = 29,259 (6.8%) N = 78,609 (18.1%) N = 77,242 (17.8%) N = 103,640 (23.9%) N = 8920 (2.1%) N = 20,021 (4.6%) N = 115,724 (26.7%)
Stage at diagnosis*
In situ 0 (0) 11,901 (15.1) 3890 (5.0) 54 (0.1) 16 (0.2) 49 (0.2) 23 (0.02)
Localized 21,339 (72.9) 42,548 (54.1) 29,486 (38.2) 17,129 (16.5) 815 (9.1) 1740 (8.7) — Regional 5768 (19.7) 17,389 (22.1) 25,279 (32.7) 24,774 (23.9) 542 (6.1) 4963 (24.8) —
Localized/regionalw 105,132 (90.8)
Distant 1134 (3.9) 4832 (6.1) 14,047 (18.2) 53,442 (51.6) 6612 (74.1) 10,086 (50.4) 5710 (4.9) Unstaged 1018 (3.5) 1939 (2.5) 4540 (5.9) 8241 (8.0) 935 (10.5) 3183 (15.9) 4859 (4.2) Sex
Male 20,867 (71.3) — 34,417 (44.6) 54,016 (52.1) — 8605 (43.0) 115,724 (100) Female 8392 (28.7) 78,609 (100) 42,825 (55.4) 49,624 (47.9) 8920 (100) 11,416 (57.0) — Age at diagnosis (y)
65–69 5123 (17.5) 19,488 (24.8) 14,105 (18.3) 23,078 (22.3) 1784 (20.0) 3564 (17.8) 33,991 (29.4) 70–74 6317 (21.6) 18,417 (23.4) 15,739 (20.4) 26,271 (25.3) 1881 (21.1) 4260 (21.3) 32,720 (28.3) 75–79 6840 (23.4) 17,844 (22.7) 17,098 (22.1) 25,642 (24.7) 2010 (22.5) 4628 (23.1) 26,111 (22.6) 80–84 5810 (19.9) 12,988 (16.5) 15,336 (19.9) 17,593 (17.0) 1726 (19.3) 3913 (19.5) 14,681 (12.7) 85+ 5169 (17.7) 9872 (12.6) 14,964 (19.4) 11,056 (10.7) 1519 (17.0) 3656 (18.3) 8221 (7.1) Race/ethnicity
NH white 25,955 (88.7) 66,530 (84.6) 62,922 (81.5) 86,889 (83.8) 7569 (84.9) 15,816 (79.0) 89,213 (77.1) NH black 1171 (4.0) 5489 (7.0) 6329 (8.2) 8371 (8.1) 537 (6.0) 1936 (9.7) 11,536 (10.0) Hispanic 1011 (3.5) 3414 (4.3) 3972 (5.1) 3985 (3.8) 494 (5.5) 1209 (6.0) 7100 (6.1)
NH AI/AN 29 (0.1) 170 (0.2) 163 (0.2) 289 (0.3) 37 (0.4) 73 (0.4) 266 (0.2)
NH API 730 (2.5) 2609 (3.3) 3483 (4.5) 3959 (3.8) 268 (3.0) 964 (4.8) 4296 (3.7) NH other/unknown 363 (1.2) 397 (0.5) 373 (0.5) 147 (0.1) 15 (0.2) 23 (0.1) 3313 (2.9) Year of diagnosis
2000 3754 (12.8) 10,625 (13.5) 11,015 (14.3) 13,957 (13.5) 1367 (15.3) 2607 (13.0) 15,626 (13.5) 2001 3894 (13.3) 11,596 (14.8) 11,337 (14.7) 14,460 (14.0) 1310 (14.7) 2701 (13.5) 16,711 (14.4) 2002 4116 (14.1) 11,707 (14.9) 11,729 (15.2) 15,034 (14.5) 1118 (12.5) 2916 (14.6) 17,814 (15.4) 2003 3949 (13.5) 11,421 (14.5) 11,608 (15.0) 15,648 (15.1) 1310 (14.7) 2966 (14.8) 16,731 (14.5) 2004 4677 (16.0) 11,085 (14.1) 11,232 (14.5) 15,412 (14.9) 1289 (14.5) 2967 (14.8) 16,835 (14.5) 2005 4424 (15.1) 11,050 (14.1) 10,152 (13.1) 14,436 (13.9) 1229 (13.8) 2822 (14.1) 15,566 (13.5) 2006 4445 (15.2) 11,125 (14.2) 10,169 (13.2) 14,693 (14.2) 1297 (14.5) 3042 (15.2) 16,441 (14.2) Reporting sourcez
Inpatient 27,795 (95.0) 76,584 (97.4) 74,907 (97.0) 98,951 (95.5) 8555 (95.9) 18,487 (92.3) 94,636 (81.8)
RT or Med Onc Center — 51 (0.1) — 48 (0.0) — — 299 (0.3)
Laboratory only 545 (1.9) 607 (0.8) 600 (0.8) 312 (0.3) 27 (0.3) 56 (0.3) 8085 (7.0) Physician’s office 812 (2.8) 1188 (1.5) 1603 (2.1) 3967 (3.8) 295 (3.3) 1341 (6.7) 12,426 (10.7)
Nursing 17 (0.1) 62 (0.1) 93 (0.1) 285 (0.3) 39 (0.4) 111 (0.6 89 (0.1)
Other 83 (0.3) 117 (0.1) 27 (0.0) 77 (0.1) — 18 (0.1) 189 (0.2)
*SEER historic stage A.
w
Prostate cancer is categorized as in situ, localized/regional, or distant. All other cancer sites have localized and regional as separate categories.
z
Reporting source is from the Medicare data. Inpatient, hospital inpatient; RT or Med Onc Center, Radiation Treatment Centers or Medical Oncology Centers; Physician’s office, Physician’s Office/Private Medical Practitioner; Nursing, Nursing/Convalescent/Hospice; Other, Other Hospital Outpatient Units/Surgery Centers.
— indicates cell counts were suppressed if <16 individuals; AI/AN, American Indian/Alaskan Native; API, Asian/Pacific Islander; NH, non-Hispanic.
et
al
Medical
Care
Volume
54,
Number
9,
September
2016
|
www.lww-medicalcare.com
Copyright
r
2014
Wolters
Kluwer
Health,
Inc.
All
rights
(Table 4). The sensitivity did not vary much by race with the exception of unknown race and, finally, the sensitivity varied by registry (range, 47%–76%).
The overall PPV was 86% and did not vary substantially by characteristic. American Indian/Alaska Natives and those with distant-stage disease had lower PPVs (66% and 75%, respectively). The overallkshowed a low level of agreement. Similar to CT and RT, the specificity was high except for distant stage; however, the NPV was only 78% overall (Table, Supplemental Digital Content 4, http://links.lww.com/MLR/ A668, which shows additional statistics for HT). The NPV was lower for individuals with distant (61%) or unstaged (66%) cancers compared with local/regional stage (79%) or for older patients (87% for age 65–69 vs. 62% for age 85+). The NPV did not vary substantially by race or registry.
DISCUSSION
In order for the treatment data recorded by the SEER registries to be useful to assess how patients are treated, the information must have good sensitivity and PPV. We found that the overall utility of the SEER data to identify cancer treatment was limited. The sensitivity of the SEER data varied by treatment type, cancer site, stage, age at diagnosis, and registry. For CT and HT, the sensitivity was low, whereas the sensitivity was better for reporting of RT. We investigated whether SEER data may be appropriate for use among specific site/stage strata. However, for the cancer sites
included in this analysis the sensitivity was <90% for all stages and treatment types (See Table, Supplemental Digital Content 5, http://links.lww.com/MLR/A672 which shows sensitivity and PPV by cancer site and stage). These results indicate that using SEER data to assess treatment will miss a number of patients who have been treated, resulting in misclassification and inaccurate estimates of the proportion of individuals treated.
Although the sensitivity was poor, the PPV was high among all treatment types and did not vary greatly by cancer site or characteristic with the exception of CT for prostate cancer. As within many site/stage strata SEER reliably identified individuals who truly received treatment, SEER treatment data may have a limited role in research projects to identify a cohort of treated individuals within these strata (See Table, Supplemental Digital Content 5, http://links. lww.com/MLR/A672 which shows sensitivity and PPV by cancer site and stage). SEER data, however, will not capture all individuals who received treatment.
This is the first study to compare CT reported in the SEER data with Medicare claims. Prior studies from 2 SEER registries compared CT data collected by medical records to registry data for women of all ages with breast cancer. These earlier studies had similar rates of concordance as the current study.7,20 As treatment is more often received in settings outside of the hospital system, either a physician’s office or an outpatient clinic, identification of treatment is difficult and may be a major contributing factor to the low capture of CT
50.3% 62.1%
74.2%
30.8%
28.8% 16.3%
13.9% 7.4% 7.7%
5.0%
1.7% 1.8%
0% 10% 20% 30% 40% 50% 60% 70% 80% 90% 100%
Hormone (Prostate) N=111,466
Radiation N=412,350 Chemotherap
y N=415,341
SEER No, Medicare No SEER Yes, Medicare Yes SEER No, Medicare Yes SEER Yes, Medicare No
FIGURE 1. Agreement between chemotherapy, radiation, and hormone therapy collected by SEER and treatment identified using Medicare claimsa.aA 12-month postdiagnosis window was used to identify treatment using Medicare claims (gold standard). SEER indicates Surveillance, Epidemiology, and End Results.
Medical Care Volume 54, Number 9, September 2016 SEER Treatment Data Compared With Medicare
TABLE 2. Sensitivity and PPV of SEER Data to Identify Chemotherapy Receipt andkStatistics by Patient and Tumor Characteristics*
SEER No, Medicare No
SEER Yes, Medicare Yes
SEER No, Medicare Yes
SEER Yes, Medicare No
Sensitivity (95% CI)w
PPV (95% CI)w
j (95% CI)
Overall
12 mo window 308,119 67,681 32,184 7357 67.8 (67.5, 68.1) 90.2 (90.0, 90.4) 71.5 (71.3, 71.8) 8 mo window 310,664 67,234 29,639 7804 69.4 (69.1, 69.7) 89.6 (89.4, 89.8) 72.7 (72.4, 72.9) 4 mo window 314,771 65,103 25,532 9935 71.8 (71.5, 72.1) 86.8 (86.5, 87.0) 73.3 (73.1, 73.6) Cancer site
Bladder 16,760 2468 8,848 293 21.8 (21.0, 22.6) 89.4 (88.2, 90.5) 23.0 (22.1, 23.9) Female Breast 58,972 10,330 4726 996 68.6 (67.9, 69.4) 91.2 (90.7, 91.7) 73.8 (73.2, 74.4) Colorectal 50,646 14,909 5967 1413 71.4 (70.8, 72.0) 91.3 (90.9, 91.8) 73.5 (72.9, 74.1) Lung 57,068 30,030 7446 3562 80.1 (79.7, 80.5) 89.4 (89.1, 89.7) 75.8 (75.3, 76.2) Ovary 3109 4285 790 239 84.4 (83.4, 85.4) 94.7 (94.1, 95.4) 75.2 (73.8, 76.6) Pancreas 11,402 5442 1608 522 77.2 (76.2, 78.2) 91.2 (90.5, 92.0) 75.2 (74.2, 76.2) Prostate 110,162 217 2799 332 7.2 (6.3, 8.1) 39.5 (35.4, 43.6) 11.4 (10.0, 12.9) Stage at diagnosisz
In situ 15,137 26 218 49 10.7 (6.8, 14.5) 34.7 (23.9, 45.4) 15.7 (10.2, 21.2) Localized 86,334 8915 12,271 1165 42.1 (41.4, 42.7) 88.4 (87.8, 89.1) 50.8 (50.2, 51.5) Localized/
regionaly
101,176 105 2029 242 4.9 (4.0, 5.8) 30.3 (25.4, 35.1) 7.9 (6.4, 9.4)
Regional 37,467 26,267 8492 2118 75.6 (75.1, 76.0) 92.5 (92.2, 92.8) 71.0 (70.5, 71.5) Distant 49,518 30,743 7704 3535 80.0 (79.6, 80.4) 89.7 (89.4, 90.0) 74.4 (74.0, 74.9) Unstaged 18,487 1625 1470 248 52.5 (50.7, 54.3) 86.8 (85.2, 88.3) 61.3 (59.6, 62.9) Sex
Female 131,627 39,592 15,190 3404 72.3 (71.9, 72.6) 92.1 (91.8, 92.3) 74.5 (74.2, 74.9) Male 176,492 28,089 16,994 3953 62.3 (61.9, 62.8) 87.7 (87.3, 88.0) 67.4 (67.0, 67.8) Age at diagnosis (y)
65–69 65,372 21,811 7874 2153 73.5 (73.0, 74.0) 91.0 (90.7, 91.4) 74.3 (73.8, 74.8) 70–74 70,775 20,113 8521 1906 70.2 (69.7, 70.8) 91.3 (91.0, 91.7) 72.7 (72.2, 73.2) 75–79 70,378 15,836 7937 1661 66.6 (66.0, 67.2) 90.5 (90.1, 90.9) 70.5 (70.0, 71.1) 80–84 55,058 7569 5190 1062 59.3 (58.5, 60.2) 87.7 (87.0, 88.4) 65.6 (64.9, 66.4) 85+ 46,536 2352 2662 575 46.9 (45.5, 48.3) 80.4 (78.9, 81.8) 56.1 (54.8, 57.5) Race/ethnicity
NH white 250,536 56,576 26,730 5710 67.9 (67.6, 68.2) 90.8 (90.6, 91.1) 71.8 (71.5, 72.1) NH black 25,896 4,881 2215 826 68.8 (67.7, 69.9) 85.5 (84.6, 86.4) 70.8 (69.8, 71.8) Hispanic 15,281 3225 1620 405 66.6 (65.2, 67.9) 88.8 (87.8, 89.9) 70.1 (68.8, 71.3) NH AI/AN 747 188 58 19 76.4 (71.1, 81.7) 90.8 (86.9, 94.8) 78.1 (73.5, 82.8) NH API 11,510 2736 1307 379 67.7 (66.2, 69.1) 87.8 (86.7, 89.0) 69.8 (68.4, 71.1) NH other/
unknown
4149 75 254 18 22.8 (18.3, 27.3) 80.6 (72.6, 88.7) 33.4 (27.6, 39.2)
Registry8
A 78.2 (77.3, 79.1) 90.9 (90.3, 91.6) 78.4 (77.6, 79.2)
B 65.6 (64.5, 66.7) 90.1 (89.4, 90.9) 70.0 (69.0, 70.9)
C 78.6 (77.7, 79.6) 92.5 (91.8, 93.2) 80.9 (80.1, 81.7)
D 62.8 (60.8, 64.9) 88.8 (87.2, 90.4) 67.9 (66.1, 69.8)
E 65.5 (64.4, 66.5) 91.8 (91.1, 92.5) 70.4 (69.4, 71.4)
F 70.8 (69.8, 71.8) 88.8 (88.0, 89.6) 73.3 (72.4, 74.2)
G 64.7 (64.2, 65.2) 88.3 (87.9, 88.7) 68.5 (68.0, 69.0)
H 62.8 (62.1, 63.5) 92.2 (91.7, 92.6) 67.8 (67.1, 68.5)
I 66.0 (64.4, 67.6) 91.6 (90.5, 92.7) 70.3 (68.9, 71.8)
J 60.1 (58.0, 62.3) 91.6 (90.1, 93.1) 68.0 (66.1, 70.0)
K 77.7 (76.6, 78.8) 89.7 (88.8, 90.6) 78.9 (77.9, 79.9)
L 70.8 (68.4, 73.3) 88.4 (86.4, 90.3) 73.2 (71.0, 75.4)
*A 12-month postdiagnosis window was used to identify treatment using Medicare claims (gold standard) unless otherwise specified.
w
95% CIs computed using normal approximation. z
SEER historic stage A.
y
Prostate cancer is categorized as in situ, localized/regional, or distant. All other cancer sites have localized and regional as separate categories.
8
Sample sizes omitted to preserve anonymity of the registries. Data from registries in California were combined (Greater California, Los Angeles, and San Jose-Monterey) and data from registries in Georgia were combined (Atlanta and Rural Georgia).
in the SEER data. For example, the low sensitivity of CT for bladder cancer is likely explained by more patients being treated primarily in the physician office. Other challenges include a trend away from intravenous CT drugs to oral CT
and identification of prescription drug use is difficult for cancer registrars to find.
Among men with prostate cancer, the sensitivity of CT was poor, even among men with distant-stage disease
TABLE 3. Sensitivity and PPV of SEER Data to Identify Radiation Therapy andkStatistics by Patient and Tumor Characteristics*
SEER No, Medicare No
SEER Yes, Medicare Yes
SEER No, Medicare Yes
SEER Yes, Medicare No
Sensitivity (95% CI)w
PPV
(95% CI)w j(95% CI)
Overall
12 mo window 256,031 118,949 30,529 6841 79.6 (79.4, 79.8) 94.6 (94.4, 94.7) 79.7 (79.5, 79.9) 8 mo window 260,499 116,358 26,061 9432 81.7 (81.5, 81.9) 92.5 (92.4, 92.6) 80.4 (80.2, 80.6) 4 mo window 267,798 101,995 18,762 23,795 84.5 (84.3, 84.7) 81.1 (80.9, 81.3) 75.4 (75.2, 75.6) Cancer site
Bladder 25,809 1492 1283 106 53.8 (51.9, 55.6) 93.4 (92.1, 94.6) 65.8 (64.2, 67.5) Female breast 36,076 31,232 8026 808 79.6 (79.2, 80.0) 97.5 (97.3, 97.6) 76.9 (76.5, 77.4) Colorectal 65,932 5962 3036 393 66.3 (65.3, 67.2) 93.8 (93.2, 94.4) 75.2 (74.4, 76.0) Lung 56,114 32,666 9396 2039 77.7 (77.3, 78.1) 94.1 (93.9, 94.4) 76.0 (75.6, 76.4) Pancreas 15,897 2447 1042 100 70.1 (68.6, 71.7) 96.1 (95.3, 96.8) 77.7 (76.5, 78.9) Prostate 56,203 45,150 7746 3395 85.4 (85.1, 85.7) 93.0 (92.8, 93.2) 80.0 (79.7, 80.4) Stage at diagnosisz
In situ 9945 4451 1039 103 81.1 (80.0, 82.1) 97.7 (97.3, 98.2) 83.3 (82.3, 84.2) Localized 77,219 24,449 6975 824 77.8 (77.3, 78.3) 96.7 (96.5, 97.0) 81.5 (81.1, 81.9) Localized/
regionaly
48,928 43,733 6648 3174 86.8 (86.5, 87.1) 93.2 (93.0, 93.5) 80.8 (80.4, 81.2)
Regional 45,632 22,272 6901 1148 76.3 (75.9, 76.8) 95.1 (94.8, 95.4) 76.7 (76.3, 77.2) Distant 56,203 22,364 7177 1397 75.7 (75.2, 76.2) 94.1 (93.8, 94.4) 77.0 (76.5, 77.4) Unstaged 18,104 1680 1789 195 48.4 (46.8, 50.1) 89.6 (88.2, 91.0) 58.2 (56.6, 59.8) Sex
Female 117,289 51,088 15,423 1441 76.8 (76.5, 77.1) 97.3 (97.1, 97.4) 79.3 (79.0, 79.6) Male 138,742 67,861 15,106 5400 81.8 (81.5, 82.1) 92.6 (92.4, 92.8) 80.0 (79.8, 80.3) Age at diagnosis (y)
65–69 51,784 34,082 7957 2599 81.1 (80.7, 81.4) 92.9 (92.7, 93.2) 77.4 (77.0, 77.8) 70–74 54,250 36,246 8120 2091 81.7 (81.3, 82.1) 94.5 (94.3, 94.8) 79.1 (78.8, 79.5) 75–79 57,258 29,372 7368 1383 79.9 (79.5, 80.4) 95.5 (95.3, 95.7) 80.0 (79.6, 80.4) 80–84 49,431 14,035 4304 575 76.5 (75.9, 77.1) 96.1 (95.7, 96.4) 80.6 (80.1, 81.1) 85+ 43,308 5214 2780 193 65.2 (64.2, 66.3) 96.4 (95.9, 96.9) 74.6 (73.8, 75.5) Race/ethnicity
NH white 208,152 98,707 24,742 5066 80.0 (79.7, 80.2) 95.1 (95.0, 95.2) 80.3 (80.1, 80.5) NH black 20,913 9410 2598 1052 78.4 (77.6, 79.1) 89.9 (89.4, 90.5) 75.8 (75.1, 76.5) Hispanic 12,988 5465 1528 385 78.1 (77.2, 79.1) 93.4 (92.8, 94.1) 78.3 (77.4, 79.2) NH AI/AN 630 250 70 22 78.1 (73.6, 82.7) 91.9 (88.7, 95.2) 77.7 (73.4, 82.0) NH API 9907 4585 1092 282 80.8 (79.7, 81.8) 94.2 (93.5, 94.9) 80.5 (79.6, 81.5) NH other/
unknown
3441 532 499 34 51.6 (48.5, 54.7) 94.0 (92.0, 96.0) 60.2 (57.2, 63.1)
Registry8
A 82.6 (81.9, 83.2) 93.4 (92.9, 93.9) 80.4 (79.7, 81.1)
B 74.0 (73.2, 74.8) 95.9 (95.5, 96.3) 75.5 (74.7, 76.2)
C 85.9 (85.2, 86.6) 96.0 (95.6, 96.5) 86.7 (86.0, 87.3)
D 68.4 (66.8, 70.0) 93.7 (92.7, 94.7) 71.0 (69.5, 72.5)
E 72.8 (72.0, 73.6) 95.4 (95.0, 95.9) 73.0 (72.2, 73.7)
F 82.9 (82.3, 83.6) 95.3 (94.9, 95.6) 82.3 (81.7, 83.0)
G 79.2 (78.8, 79.6) 94.0 (93.7, 94.2) 79.7 (79.4, 80.1)
H 78.6 (78.1, 79.1) 95.2 (94.9, 95.5) 78.9 (78.5, 79.4)
I 82.2 (81.1, 83.2) 94.9 (94.2, 95.5) 81.2 (80.2, 82.3)
J 82.5 (81.3, 83.8) 95.4 (94.7, 96.2) 83.3 (82.2, 84.4)
K 86.9 (86.2, 87.7) 92.1 (91.5, 92.7) 83.8 (83.1, 84.5)
L 82.6 (81.1, 84.2) 93.2 (92.1, 94.3) 79.5 (77.9, 81.1)
*A 12-month postdiagnosis window was used to identify treatment using Medicare claims (gold standard) unless otherwise specified.
w
95% CIs computed using normal approximation. z
SEER historic stage A.
y
Prostate cancer is categorized as in situ, localized/regional, or distant. All other cancer sites have localized and regional as separate categories.
8
Sample sizes omitted to preserve anonymity of the registries. Data from registries in California were combined (Greater California, Los Angeles, and San Jose-Monterey) and data from registries in Georgia were combined (Atlanta and Rural Georgia).
AI/AN indicates American Indian/Alaskan Native; API, Asian/Pacific Islander; CI, confidence interval; NH, non-Hispanic; PPV, positive predictive value; SEER, Surveillance, Epidemiology, and End Results.
Medical Care Volume 54, Number 9, September 2016 SEER Treatment Data Compared With Medicare
(13.6% vs. 4.9% for localized/regional stage). These find-ings could be influenced by the challenges of distinguish-ing men who received CT, HT, or both usdistinguish-ing Medicare claims. Among men with prostate cancer included in this analysis who received CT according to Medicare claims, 67% also had a claim for HT within the same year. For these men, we cannot definitively determine if all claims were related to administration of HT or if some were for CT. A recent study compared CT and HT data compiled by the Cancer Research Network’s (CRN) Virtual Data Ware-house, which included encounter, claims, and electronic medical record data, to gold standard tumor registry data abstracted from medical charts.21The PPV for identifying CT
for prostate cancer was only 6%, similar to our current findings. These results reflect the fact that registry data is limited to the first course of therapy and the difficulty in distinguishing CT and HT using claims for prostate cancer. In contrast to poor reporting of CT in the CRN data, the authors found that among men with prostate cancer identified as receiving HT in the CRN data, 92% also had HT captured in the tumor registry data. The success in identifying HT from the CRN claims data compared with Medicare claims may be due to availability of pharmacy information in the CRN data.
We found moderate sensitivity and agreement between SEER data and Medicare claims for receipt of RT. In
pre-TABLE 4. Sensitivity and PPV of the SEER Data to Identify Hormone Therapy andkStatistics by Patient and Tumor Characteristics Among Men With Prostate Cancer*
SEER No, Medicare No
SEER Yes, Medicare Yes
SEER No, Medicare Yes
SEER Yes, Medicare No
Sensitivity (95% CI)w
PPV (95% CI)w
j (95% CI)
Overall
12 mo window 56,022 34,379 15,451 5614 69.0 (68.6, 69.4) 86.0 (85.6, 86.3) 61.0 (60.6, 61.5) 8 mo window 56,723 33,955 14,750 6038 69.7 (69.3, 70.1) 84.9 (84.6, 85.3) 61.3 (60.8, 61.8) 4 mo window 57,867 32,516 13,606 7477 70.5 (70.1, 70.9) 81.3 (80.9, 81.7) 60.2 (59.8, 60.7) Stage at diagnosisz
In situ — — — — — — —
Localized/ regional
52,831 30,748 13,673 4470 69.2 (68.8, 69.6) 87.3 (87.0, 87.7) 62.9 (62.4, 63.4)
Distant 1104 2796 720 937 79.5 (78.2, 80.9) 74.9 (73.5, 76.3) 34.4 (31.8, 36.9) Unstaged 2073 827 1058 207 43.9 (41.6, 46.1) 80.0 (77.5, 82.4) 36.2 (33.6, 38.8) Age at diagnosis (y)
65–69 20,780 7566 3090 1499 71.0 (70.1, 71.9) 83.5 (82.7, 84.2) 66.9 (66.0, 67.8) 70–74 16,401 9943 3719 1542 72.8 (72.0, 73.5) 86.6 (86.0, 87.2) 65.4 (64.6, 66.3) 75–79 10,703 9126 4033 1283 69.4 (68.6, 70.1) 87.7 (87.0, 88.3) 58.1 (57.1, 59.0) 80–84 5209 5147 2838 808 64.5 (63.4, 65.5) 86.4 (85.6, 87.3) 49.0 (47.6, 50.4) 85+ 2929 2597 1771 482 59.5 (58.0, 60.9) 84.3 (83.1, 85.6) 43.5 (41.7, 45.4) Race/ethnicity
NH white 44,009 26,430 11,397 3899 69.9 (69.4, 70.3) 87.1 (86.8, 87.5) 63.1 (62.5, 63.6) NH black 5333 3361 1496 937 69.2 (67.9, 70.5) 78.2 (77.0, 79.4) 55.0 (53.4, 56.5) Hispanic 3166 2187 1160 436 65.3 (63.7, 67.0) 83.4 (82.0, 84.8) 53.7 (51.7, 55.6) NH AI/AN 131 66 31 34 68.0 (58.8, 77.3) 66.0 (56.7, 75.3) 47.1 (36.1, 58.1) NH API 1856 1523 607 220 71.5 (69.6, 73.4) 87.4 (85.8, 88.9) 60.8 (58.4, 63.1) NH other/
unknown
1527 812 760 88 51.7 (49.2, 54.1) 90.2 (88.3, 92.2) 46.5 (43.7, 49.3)
Registryy
A 72.4 (70.7, 74.0) 82.8 (81.3, 84.2) 59.9 (57.9, 61.8)
B 70.8 (69.4, 72.1) 87.5 (86.4, 88.6) 60.7 (59.0, 62.3)
C 71.6 (70.1, 73.2) 89.5 (88.4, 90.7) 64.5 (62.8, 66.3)
D 47.4 (44.4, 50.4) 72.7 (69.4, 76.0) 42.4 (39.1, 45.8)
E 67.0 (65.4, 68.6) 84.5 (83.1, 85.8) 55.4 (53.5, 57.3)
F 60.9 (59.4, 62.5) 86.9 (85.6, 88.2) 57.8 (56.2, 59.5)
G 70.6 (69.9, 71.4) 84.8 (84.2, 85.5) 63.0 (62.1, 63.8)
H 70.2 (69.3, 71.1) 87.9 (87.2, 88.6) 55.2 (54.0, 56.4)
I 50.9 (48.0, 53.9) 81.1 (78.1, 84.0) 51.4 (48.3, 54.5)
J 70.8 (68.5, 73.1) 88.3 (86.5, 90.1) 68.9 (66.6, 71.2)
K 72.9 (71.2, 74.7) 87.0 (85.5, 88.5) 69.8 (68.0, 71.6)
L 75.6 (72.8, 78.4) 86.8 (84.4, 89.2) 61.3 (57.5, 65.0)
*A 12-month postdiagnosis window was used to identify treatment using Medicare claims (gold standard) unless otherwise specified.
w
95% CIs computed using normal approximation. z
SEER historic stage A.
y
Sample sizes omitted to preserve anonymity of the registries. Data from registries in California were combined (Greater California, Los Angeles, and San Jose-Monterey) and data from registries in Georgia were combined (Atlanta and Rural Georgia).
vious comparisons of reported RT use between SEER and Medicare data, breast, endometrial, lung, prostate, and rectal cancer had strong agreement when comparing RT use for individuals diagnosed between 1991 and 1996.4A more recent study compared receipt of RT as reported in the SEER data for individuals diagnosed with breast cancer aged 20 to 79 and diagnosed between 2005 and 2007 with self-reported treatment information obtained through patient survey.2 This analysis found overall agreement of 83%, and 21% of individuals who self-reported receiving RT were recorded as not receiving RT in the SEER data. Under-ascertainment of RT was higher in women under the age of 65 who would not be eligible for Medicare. We also found more underreporting of RT in the SEER data, about 21%, which is consistent with the more recent study.1,2,5 The poorer performance with more recent diagnoses could be due to the increasing difficulty for registries to collect treatment information delivered in the outpatient setting. Underascertainment of RT may also result if individuals receive surgical treatment in a large cancer center but receive RT in a community setting.
There are several limitations to this study. One caveat is the potential for underreporting of treatment by both Medicare claims and the SEER data. Underreporting of treatment in the Medicare claims would result from individuals receiving care outside of the Medicare system, such as from the Veterans Health Administration, or if in-dividuals are still working and have employer-sponsored insurance. Whereas, underreporting of treatment in the SEER data may be caused by care not captured by the registry, such as prescription drugs or outpatient treatment, or individuals leaving the registry catchment area for treatment. The sensitivity among those over the age of 85 is lower which may be due to these individuals leaving home while re-ceiving treatment. In addition, the sensitivity varied by reg-istry. This may be due to differences in how the data are collected at the registry and the proportion of patients re-ceiving inpatient treatment.
Apparent differences in the reporting of treatment between the SEER and Medicare data may be caused by misalignment of the treatment window captured by SEER and Medicare files. In this evaluation, a 12-month postdiagnosis window was used to identify claims from Medicare. This timeframe was chosen as it aligned with guidelines from the SEER Program Coding and Staging Manual followed by SEER registrars stating that in the absence of additional documentation the first course of therapy ends after 1 year postdiagnosis.22However, SEER is only cap-turing first-course treatment, whereas Medicare claims would also capture secondary treatment due to an inability of individuals to tolerate the initial treatment or failure of the initial treatment to produce the desired outcome. The overall sensitivity of the SEER data increased and the PPV decreased using a shorter window postdiagnosis to identify claims but these dif-ferences were modest (Tables 2–4).
In addition, there may have been some missed oppor-tunity for the SEER registries to capture treatment. We re-viewed the claims for individuals identified as having received treatment in Medicare but not in the SEER data to determine the number of encounters the individual had with the health
care system. The number of encounters was quantified by the number of days in the first year postdiagnosis a claim for treatment was found. Thirty-two percent of individuals with any claims for CT and 55% of those with any claims for RT had at least 10 encounters. As most of the reporting was from inpatient claims (Table 1) this may imply that SEER may have missed the opportunity to capture treatment information. Fi-nally, treatment status for individuals in managed care systems may be more easily identified by the registries as there is a unified record of incident cancer and treatment but only in-dividuals with fee-for-service were included in this analysis.
Registries’ ability to capture accurate treatment in-formation is becoming more difficult over time because of trends in cancer treatment and also privacy concerns. Although the Health Insurance Portability and Accountability Act (HIPAA) Privacy Rule includes provisions to allow mandated cancer re-porting without patient consent for public health surveillance and research, it does create confusion on the disclosure of protected health information by health care providers.23A survey of North American Association of Central Cancer Registries (NAACCR) found that two thirds of registries cited HIPAA as interfering with nonresearch operations. Among those, 75% reported that HIPAA was identified as the reason for either ceased case re-porting from at least 1 source, prevented case finding or auditing, or interfered with collection of follow-up data.24
Although there are significant limitations found with the SEER treatment data, there are several possible uses. For example, researchers used SEER treatment data to select a cohort of treated individuals.25Furthermore, SEER treatment data could be improved by correcting the bias using the POC data, as done in the study by Mariotto et al,26 and also by potentially augmenting SEER treatment data using other larger scale data sources. Linkages between the SEER data and data sources such as the CRN, state-employee data, electronic medical records, and insurance billing claims data, such as Medicare, may provide an opportunity to enhance the quality of treatment data for individuals with cancer and possibly provide an opportunity to estimate rates of treatment receipt in the population. For example, data from CRN’s Virtual Data Warehouse have been shown to reliably identify CT as treatment for breast,21,27 colorectal,21 lung,21 and ovarian28 cancer. Additional benefits to these data are that they include pharmacy data, individuals under 65 years of age, and those receiving treatment in HMOs.
In conclusion, caution should be taken when using treatment information from the SEER data. As the sensitivity of SEER data to identify treatment was consistently low, these data cannot be used to accurately describe the pro-portion of individuals in the population who received treat-ment. In addition, comparisons between individuals who received and did not receive treatment based on the SEER data would be biased. In contrast, the PPV was high for most cancer sites suggesting that SEER treatment data could be used reliably to identify a cohort of individuals with cancer who received treatment. RT data are currently available in the public-use SEER research data file. CT and HT data are not publically available but approval may be granted upon special data request to the SEER program. Our findings can inform investigators about potential uses of the CT and HT Medical Care Volume 54, Number 9, September 2016 SEER Treatment Data Compared With Medicare
data, albeit limited. Finally, NCI is currently investigating linkages to the SEER data, such as Medicare data, that could be used to supplement SEER treatment information leading to more accurate and complete information about treatment for individuals with cancer.
REFERENCES
1. Cooper GS, Yuan Z, Stange KC, et al. Agreement of Medicare claims and tumor registry data for assessment of cancer-related treatment.Med Care. 2000;38:411–421.
2. Jagsi R, Abrahamse P, Hawley ST, et al. Underascertainment of radiotherapy receipt in Surveillance, Epidemiology, and End Results registry data.Cancer. 2012;118:333–341.
3. National Cancer Institute. SEER-Medicare Publications. Available at: http://healthservices.cancer.gov/seermedicare/overview/publications.html. Accessed March 8, 2012.
4. Virnig BA, Warren JL, Cooper GS, et al. Studying radiation therapy using SEER-Medicare-linked data.Med Care. 2002;40(suppl): IV-49–IV-54.
5. Du X, Freeman JL, Goodwin JS. Information on radiation treatment in patients with breast cancer: the advantages of the linked Medicare and SEER data. Surveillance, Epidemiology and End Results. J Clin Epidemiol. 1999;52:463–470.
6. Lund JL, Sturmer T, Harlan LC, et al. Identifying specific chemo-therapeutic agents in Medicare data: a validation study.Med Care. 2013;51:e27–e34.
7. Du XL, Key CR, Dickie L, et al. External validation of Medicare claims for breast cancer chemotherapy compared with medical chart reviews. Med Care. 2006;44:124–131.
8. Lamont EB, Herndon JE, Weeks JC, et al. Criterion validity of Medicare chemotherapy claims in Cancer and Leukemia Group B breast and lung cancer trial participants.J Natl Cancer Inst. 2005;97:1080–1083. 9. Warren JL, Harlan LC, Fahey A, et al. Utility of the SEER-Medicare data to
identify chemotherapy use.Med Care. 2002;40(suppl):IV-55–IV-61. 10. Lamont EB, Lauderdale DS, Schilsky RL, et al. Construct validity of
Medicare chemotherapy claims: the case of 5FU. Med Care. 2002; 40:201–211.
11. Elliott SP, Jarosek SL, Wilt TJ, et al. Reduction in physician reimbursement and use of hormone therapy in prostate cancer.J Natl Cancer Inst. 2010;102:1826–1834.
12. Shahinian VB, Kuo YF, Freeman JL, et al. Increasing use of gonadotropin-releasing hormone agonists for the treatment of localized prostate carcinoma.Cancer. 2005;103:1615–1624.
13. Williams SB, Gu X, Lipsitz SR, et al. Utilization and expense of adjuvant cancer therapies following radical prostatectomy. Cancer. 2011;117:4846–4854.
14. National Cancer Institute. SEER-Medicare Data. Available at: http:// healthservices.cancer.gov/seermedicare/. Accessed September 30, 2011.
15. Altekruse SF, Kosary CL, Krapcho M, et al.SEER Cancer Statistics Review, 1975-2007. Bethesda, MD: National Cancer Institute; 2010. Available at http://seer.cancer.gov/csr/1975_2007/.
16. Potosky AL, Riley GF, Lubitz JD, et al. Potential for cancer related health services research using a linked Medicare-tumor registry database.Med Care. 1993;31:732–748.
17. Warren JL, Klabunde CN, Schrag D, et al. Overview of the SEER-Medicare data: content, research applications, and generalizability to the United States elderly population. Med Care. 2002;40(suppl): IV-3–IV-18.
18. National Cancer Institute. Patterns of Care/Quality of Care. Available at http://appliedresearch.cancer.gov/surveys/poc/. Accessed September 30, 2011.
19. Chubak J, Pocobelli G, Weiss NS. Tradeoffs between accuracy measures for electronic health care data algorithms.J Clin Epidemiol. 2012;65:343–349.
20. Malin JL, Kahn KL, Adams J, et al. Validity of cancer registry data for measuring the quality of breast cancer care.J Natl Cancer Inst. 2002;94: 835–844.
21. Ritzwoller DP, Carroll N, Delate T, et al. Validation of electronic data on chemotherapy and hormone therapy use in HMOs.Med Care. 2013; 51:e67–e73.
22. Adamo MB, Johnson CH, Ruhl JL, et al.2011 SEER Program Coding and Staging Manual. NIH Publication Number 11-5581. Bethesda, MD: National Cancer Institute; 2011.
23. Deapen D. Cancer surveillance and information: balancing public health with privacy and confidentiality concerns (United States). Cancer Causes Control. 2006;17:633–637.
24. Deapen D.Negative Impact of HIPAA on Population-Based Cancer Registry Research: Update of a Brief Survey. Washington, DC: Institute of Medicine: Committee on Health Research and the Privacy of Health Information: the HIPAA Privacy Rule. Available at: http://www.iom. edu/B/media/Files/Activity%20Files/Research/HIPAAandResearch/ HIPAAIOMmeeting607rHowe.ashx.
25. Morton LM, Dores GM, Tucker MA, et al. Evolving risk of therapy-related acute myeloid leukemia following cancer chemotherapy among adults in the United States, 1975-2008. Blood. 2013;121: 2996–3004.
26. Mariotto AB, Feuer EJ, Harlan LC, et al. Dissemination of adjuvant multiagent chemotherapy and tamoxifen for breast cancer in the United States using estrogen receptor information: 1975-1999.J Natl Cancer Inst Monogr. 2006;36:7–15.
27. Delate T, Bowles EJ, Pardee R, et al. Validity of eight integrated healthcare delivery organizations’ administrative clinical data to capture breast cancer chemotherapy exposure. Cancer Epidemiol Biomarkers Prev. 2012;21:673–680.