HIGHMASS
—
HIGH H
IMASS, H
I-RICH GALAXIES AT
Z
∼0:
COMBINED H
IAND H2
OBSERVATIONS
Gregory Hallenbeck1, Shan Huang2, Kristine Spekkens3, Martha P. Haynes4, Riccardo Giovanelli4, Elizabeth A. K. Adams5, Jarle Brinchmann6, John Carpenter7, Jayaram Chengalur8, Leslie K. Hunt9,
Karen L. Masters10,11, and Amélie Saintonge12
1
Union College, Department of Physics & Astronomy, Schenectady, NY, USA;hallenbg@union.edu 2
CCPP, New York University, 4 Washington Place, New York, NY 10003, USA;shan.huang@nyu.edu 3Royal Military College of Canada, Department of Physics, P.O. Box 17000, Station Forces,
Kingston, ON K7K 7B4, Canada;Kristine.Spekkens@rmc.ca 4
Cornell Center for Astrophysics and Planetary Science(CCAPS), Space Sciences Building, Cornell University, Ithaca, NY 14853, USA;haynes@astro.cornell.edu,riccardo@astro.cornell.edu 5
ASTRON, the Netherlands Institute for Radio Astronomy, Postbus 2, 7990 AA, Dwingeloo, The Netherlands;adams@astron.nl 6
Leiden Observatory, Leiden University, P.O. Box 9513, 2300 RA Leiden, The Netherlands;jarle@strw.leidenuniv.nl 7
California Institute of Technology, Department of Astronomy, MC 249-17, Pasadena, CA 91125, USA;jmc@astro.caltech.edu 8
National Centre for Radio Astrophysics, Tata Institute for Fundamental Research, Pune 411 007, India;chengalu@ncra.tifr.res.in 9
INAF-Osservatorio Astrofisico di Arcetri, Largo E. Fermi 5, I-50125, Firenze, Italy;hunt@arcetri.inaf.it 10
Institute of Cosmology and Gravitation, Dennis Sciama Building, Burnaby Road, Portsmouth POI 3FX, UK;Karen.Masters@port.ac.uk 11
South East Physics Network, Portsmouth, UK;http://www.sepnet.ac.uk
12University College London, Department of Physics & Astronomy, Kathleen Lonsdale Building, Gower Place, London, WC1E 6BT, UK;a.saintonge@ucl.ac.uk
Received 2016 June 30; revised 2016 September 18; accepted 2016 September 27; published 2016 December 7
ABSTRACT
We present resolved HI and CO observations of three galaxies from the HIghMass sample, a sample of
HI-massive (MHI>1010M), gas-rich (MHI in the top 5% for their M*)galaxies identified in the ALFALFA survey. Despite their high gas fractions, these are not low-surface-brightness galaxies and have typical specific star formation rates(SFR M*)for their stellar masses. The three galaxies have normal SFRs for theirH2masses, but unusually short star formation efficiency scale lengths, indicating that the star formation bottleneck in these galaxies is in the conversion of HI to H2, not in converting H2 to stars. In addition, their dark matter spin parameters (λ) are above average, but not exceptionally high, suggesting that their star formation has been suppressed over cosmic time but is now becoming active, in agreement with prior Hαobservations.
Key words:galaxies: evolution –galaxies: individual (UGC 6168, UGC 7899, NGC 5230)–galaxies: spiral– radio lines: galaxies
1. INTRODUCTION
Star-forming galaxies in the local universe follow a tight correlation between specific star formation rate (SSFRº
*
M
SFR ) and stellar mass known as the star-forming main sequence: as stellar mass increases, SSFR slowly decreases(e.g., Brinchmann et al. 2004; Salim et al.2007; Schiminovich et al. 2007). This main sequence has been observed out to high stellar masses(M*>1010M)in the optically selected GASS survey
(the GALEX Arecibo SDSS survey; Catinella et al. 2010; Schiminovich et al.2010). However, optically selected samples are inherently biased toward galaxies with higher surface brightnesses. In comparison to optical samples, samples selected byHIare bluer and have higher gas fractions(GFºMHI M*),
lower star formation efficiencies(SFEºSFR MHI), and lower surface brightnesses than optically selected samples(e.g., Huang et al.2012b). Given the strong differences between optically and
HI-selected samples, it is not immediately clear whether galaxies with high HI masses also follow the star formation main sequence.
Consider the “HI Monsters” sample of Lee et al. (2014) and the Bluedisks sample of Wang et al. (2013), which were selected on the basis of HI mass, either directly from the ALFALFA survey (in the case of theHI Monsters) or as inferred from optical colors (Bluedisks), with each sample yielding HI masses of MHI>1010.5M and
< <
M M M
108.3 10
HI 10.4 , respectively. The HI Monsters
have highHImasses and correspondingly highM*~1011M
andMH2~1010M. They also have quite high SFRs, and their
SSFRs lie on the star-forming main sequence. The Bluedisks galaxies’ HI radii follow scaling relations derived for
lower-MHI galaxies. Additionally, their HI disks do not appear disturbed, suggesting that they had not recently acquired gas from a merger. It appears that selecting on the basis ofHImass alone yields samples that are similar to lower-mass spiral galaxies, but“scaled up”to higher total mass. As gas fraction decreases with increasing stellar mass, these samples consist of
HI-massive but not particularly gas-rich galaxies. Instead, the typical gas fractions of both samples are in the range0.1<GF<1.0.
Many galaxies that are both HI-massive (MHI>1010M)
and gas-rich (GF1) deviate from the star-forming main sequence. Some are giant, low-surface-brightness galaxies
(GLSBs) like Malin1 (MHI=1010.8M, GF»0.9; Bothun
et al.1987; Lelli et al.2010). GLSBs are also seen to also exhibit low surface densities ofHI. Lemonias et al.(2014)examined an optically selected sample of GASS galaxies with
>
MHI 1010M and high gas fractions. As a whole, the sample
has suppressed star formation, lying in the same region of *
-M SSFRspace as GLSBs. Karl G. Jansky Very Large Array
(VLA)observations of the sample show that these galaxies have extended, low average deprojectedHI surface density(SHI), as well as low deprojected SFR surface density(SSFR).
From the 40% sky area data release of the ALFALFA survey
(a.40; Haynes et al.2011), we have identified the HIghMass sample,first presented in Huang et al.(2012b). Like the sample of Lemonias et al. (2014), the HIghMass galaxies are selected to have both a highHI mass(MHI>1010M)and unusually
high gas fractions for their stellar masses (gas fraction is 1σ above average). This yields a sample withGF0.4;half have
*
>
MHI M . Despite these high gas fractions, unlike the
optically selected sample of Lemonias et al. (2014), the HIghMass galaxies do not have suppressed star formation: they fall along theSSFR-M*star-forming main sequence.
The only sample with properties similar to HIghMass isHI
GHz (Catinella & Cortese 2015). The HI GHz galaxies are similarly massive (MHI>1010M) and gas-rich (0.1<
<
GF 2), while also lying on or above the star-forming main sequence. The galaxies of the HI GHz sample lie at
z
0.17 0.25 and are massive galaxies that are still assembling their disks. The HIghMass galaxies are at a redshift of z<0.06, suggesting that the HIghMass galaxies are the low-redshift analogs of the HI GHz sample. But how can massive gaseous reservoirs like those observed in the HIgh-Mass galaxies survive to z=0 in galaxies whose star formation is not suppressed? Our hypotheses broadly fall into two categories. First, the galaxies have unusually high dark matter halo spin parameters, suppressing time-averaged star formation. Second, their cold gas has been recently acquired.
The dark matter spin parameter is a dimensionless way to quantify the angular momentum of a dark matter halo,
∣ ∣
lºJ E1 2G-1M-5 2. Theoretically, high spin parameters are associated with bluer colors, lower optical surface brightness, and higher gas fractions (e.g., Jimenez et al. 1998; Mo et al. 1998; Boissier & Prantzos 2000; Macciò et al. 2007). Unfortunately, λ is ultimately a parameter that is not directly observable. Despite this, several works have attempted to infer it for populations of galaxies based on optical (Hernandez et al. 2007; Cervantes-Sodi & Hernández 2009) and a combination of optical andHI properties(Huang et al.2012b), with results agreeing with theory. Huang et al.(2012b)found that the ALFALFA population as a whole has elevated values ofλ compared with a Sloan Digital Sky Survey (SDSS) selected sample (Hernandez et al. 2007). Huang et al. (2014) further suggest that the HIghMass galaxies have, on average, even higher values ofλthan the overall ALFALFA sample.
Recent gas can come from a“galactic fountain”effect, where supernovae have ionized and ejected gas(Fraternali & Binney 2006, 2008; Oppenheimer et al. 2010). While outside of the galactic disk, the gas is unable to form stars. Over time, the gas can cool, recombine, and return to the disk. Studies of NGC 891 and NGC 2403(Fraternali & Binney2008)at a distance of
<10 Mpc have inferred reaccretion rates as high as 1 3– M
yr−1, similar to their SFRs. Simulations by Marinacci et al.
(2010)find that, in most cases, this extraplanar gas is unlikely to be of high enough column density to be observed directly, but can contribute to a galaxy’s global profile—that is, there can exist gas that is unable to contribute to star formation but will contribute to theHI mass observed by ALFALFA. Such gas shares a common specific angular momentum with the existing gaseous disk, but can cause inflows (Fraternali et al. 2001). Alternatively, recently acquired gas may originate in the intergalactic medium, having been unassociated with any galaxy until now. Such gas has angular momentum that is
uncorrelated with the galaxy’s disk, leading to warps as well as flows(Fraternali & Binney2008).
Previous work by Hallenbeck et al.(2014)examined in detail two of the HIghMass galaxies using ∼3 kpc resolution VLA observations. The two galaxies have quite similar optical photometric and unresolved HI spectral properties:
*>
M 1010M , M >10
HI 10.3, specifically with MHI>M*. However, upon resolving theHI, we see that the two galaxies are drastically different. One (UGC 12506) is a low-surface-brightness(LSB)galaxy with a very high dark matter halo spin parameter (l=0.15), low surface density, extended HI (typically 1–5Mpc-2 at radii from 10–40 kpc), and low star
formation surface densities. The other (UGC 9037) has an elevated high spin parameter (l=0.07), but has both high centralHI surface density (>10Mpc-2 at radii less than 10
kpc)and centrally peaked star formation. In addition, UGC 9037 has what appear to be high-velocity inflows at all radii, with a peak noncircularv=0.09vrotation, suggesting that the galaxy is undergoing a transition to a more intense star-forming phase.
This paper is the second in a series, building on the results of Hallenbeck et al.(2014). We present observations of the12CO
(1–0) line (as a proxy for H2), observed using CARMA (the Combined Array for Research in Millimeter-wavelength Astronomy) for three galaxies, UGC 6168, UGC 7899, and NGC 5230 (which is also UGC 8573). These three galaxies were specifically selected for study because they had the highest predicted CO column density using the scaling relations derived by Saintonge et al. (2011a). These new observations are combined with the Hα studies of Huang et al. (2014) to examine disk stability and the SFE of theHIandH2phases and to determine whether the star formation bottleneck is in the conversion ofHItoH2, orH2to stars. In addition, in order to test the recent accretion hypothesis, we are studying the resolved gas velocityfields to search for gas inflows and warps. Finally, we directly derive values ofλfor each galaxy.
Much of our data reduction mirrors that in the previous work of Hallenbeck et al. (2014). We summarize and discuss differences from that previous work in Section2. Results for each individual galaxy are presented in Section3. We discuss possible evolutionary histories for each galaxy, as well as the HIghMass sample in general, in Section4. Our conclusions are summarized in Section5.
2. OBSERVATIONS AND DATA REDUCTION
In Table 1 we present the global gas, stellar, and star formation properties of the three HIghMass galaxies studied in this work, as well as the two galaxies studied by Hallenbeck et al.(2014). Except as described in the following sections, data reduction and analysis methods for gas are identical to those in Hallenbeck et al.(2014); methods for deriving stellar and star formation properties follow the methods of Huang et al.(2014). We provide a brief summary of those methods as follows:
1. TotalHImasses, recessional velocities, and distances are taken from thea.40catalog(Haynes et al.2011), which assumesH0=70 km s−1Mpc−1.
3. Rotation curves are derived by fitting tilted rings to the observed moment 1 velocityfields using the GIPSY task
ROTCUR, with radii spaced every half beam width. Noncircular velocities are then reexamined and confirmed using the DiskFit package(Spekkens & Sellwood2007; Sellwood & Sánchez2010; Kuzio de Naray et al.2012). 4. SFRs and surface densities are calculated from Hα imaging taken at Kitt Peak National Observatory
(KPNO). We take the resulting profiles directly from Huang et al.(2014).
5. Dark matter properties are determined by fitting to the observed rotation curves using the GIPSY taskROTMAS. We model each galaxy as having thin gas (HI,H2, and He)and stellar components along with dark matter. 6. A modified dark matter halo spin parameter l¢ is
calculated directly from the resolved gas properties and the dark matter halo fit(Equations(4),(5), and(6)from Hallenbeck et al. 2014):
∣ ∣ ·
( )
å
l¢ = J E =
GM
V r V GM 1
2 , 1
i M
M i i C
H 1 2 5 2 2 1 2 I i H I, H I
where MH ,Ii, Vi, and ri are the HI mass, velocity, and galactocentric radius of each tilted ring, respectively, VC is the maximum circular velocity of a fit pseudo-isothermal halo, and M is the mass of the dark matter halo. Mis obtained via abundance matching of both the combined stellar andHImasses(Papastergis et al.2012).
2.1. CO Observations and Inferred H2Properties
The three HIghMass galaxies were observed using CARMA in its compact E configuration. The CARMA visibilities for the three galaxies are exported from the native MIRIAD format into CASA before following the same data reduction techniques as were performed for the HI observations. The VLA has a primary beam FWHM of~ ¢30 when observing the 21 cm HI line. However, at 115 GHz, the CARMA primary beam scale is~ ¢1, similar to the sizes of our galaxies (major axes ~ ¢1). We image out to the 20% response contour and correct thefluxes accordingly.
Single-dish 12CO(1–0) observations of 18 HIghMass galaxies were performed with the 30 m IRAM telescope, including UGC 6168, UGC 7899, and NGC 5230. For all three
galaxies, we produced spectra from the CARMA data cubes corresponding to the22field of view of the 30 m IRAM dish. The fluxes derived from these spectra agree with the fluxes derived from the single-dish observations (S. Huang et al. 2017, in preparation).
We must assume a conversion factor between the observed CO luminosityLCO¢ (in units of K km s−1pc2)and the total H2 mass, known asaCO. The conversion factor is known to vary with metallicity (e.g., Wilson 1995; Arimoto et al. 1996; Bolatto et al. 2013; Sandstrom et al. 2013). However, even though the HIghMass galaxies are gas dominated, they all have
*
M 1010M , and thus we expect them to have metallicities
similar to the Milky Way. We follow Saintonge et al.(2011a) and use a Milky Way value for aCO averaged over several recent measurements (Strong & Mattox 1996; Dame et al. 2001; Blitz et al. 2007, Draine et al. 2007; Heyer et al. 2009; Abdo et al. 2010),aCO =3.2M(K km s−1pc
)
-2 1. Given the conversion factor, we then compute the total H 2 mass following Solomon et al.(1997):
( )
a a n
= ¢ = ´
-MH2 LCO CO 3.25 107 CO COS 2 2d 2
whereSCO is the total integrated COflux in Jy km s−1(which are our intensity map units),νis the rest frequency of the line in GHz, which for 12CO(1–0) is 115.271 GHz, and d is the Hubbleflow distance of the galaxy in Mpc.
Production ofH2 moment maps, fitting of rotation curves, and derivation of deprojected surface densities then follow the same method as for HI. However, in most cases, the CO is only partially resolved by CARMA, and so we must assume inclinations and position angles as derived by theHI rotation curves.
2.2. Stellar Masses
Hallenbeck et al.(2014)used a combination of two methods to calculate stellar masses. Global stellar masses were calculated based onfitting model spectral energy distributions to SDSS magnitudes (Salim et al.2007; Huang et al. 2012a, 2012b). These were then used to constrain the less precise surface density profiles following the method of Bell et al.(2003).
Here, instead of relying on optical photometry, we use infrared 3.6μm and 4.5μm photometry taken with Spitzer
IRAC (Fazio et al. 2004; Werner et al. 2004), which should
Table 1
Sample Optical and Radio Properties
Galaxy d logMHI logMH2 R25 logM*(SED) logM*(IRAC) log SFR
(Mpc) (M) (M) (kpc) (M) (M) (Myr-1)
(1) (2) (3) (4) (5) (6) (7) (8)
UGC 6168 120 10.35 8.96 23.8 10.37 10.59 0.57
UGC 7899 128 10.42 9.68 36.8 10.49 10.93 1.20
NGC 5230 101 10.53 10.02 36.3 10.89 11.22 0.96
UGC 9037 88 10.33 L 23.0 10.09 L 0.56
UGC 12506 98 10.53 L 40.0 10.46 L 0.40a
Note.Optical and radio properties of the HIghMass galaxies in this work and in Hallenbeck et al.(2014). Column(1): galaxy identifier. Column(2): Hubbleflow distance of galaxy, from Haynes et al.(2011). Column(3):HImass, from Haynes et al.(2011). Column(4): inferredH2mass from CARMA observations of12CO
(J=1 0– )line. Column(5): radius of the 25 mag arcsec−2isophote inrband. Column(6): stellar mass, derived fromfitting SEDs to SDSS magnitudes, from Huang et al.(2012b). Column(7): stellar mass, derived fromSpitzerobservations, and the mass-to-light ratios of Querejeta et al.(2014). Column(8): Hα-derived SFRs, from Huang et al.(2014).
a
trace the old stellar population. We then convert to stellar masses following Equation(4)of Querejeta et al. (2014):
([ ] [ ]) ( )
¡ = - -
-log 3.6 0.339 3.6 4.5 0.336 3
where ¡3.6 is the mass-to-light ratio of the 3.6μm band and [3.6]–[4.5]is the color from the 3.6μm and 4.5μm bands. For UGC 6168, UGC 7899, and NGC 5230, the IRAC stellar masses are larger by a factor of 2–3 compared with the SEDfit masses. It is possible that this method is overestimating our stellar masses because the IRAC bands may have hot dust contamination as a result of dust heating by active star formation.
2.3. Stability Criteria
When calculating the stability of the disk via the ToomreQ
parameter, the work of Hallenbeck et al.(2014)neglected the contribution from stars. For both galaxies, the stellar mass was quite centrally concentrated by comparison with the HI. In addition, M*<MHI. As a consequence, simple two-phase models of the galaxy disk, such as those by Wang & Silk
(1994)and Rafikov(2001), predicted essentially no change in
Qat all radii.
However, the inclusion ofH2requires serious consideration. As H2 is much cooler and has a higher per-particle mass than
HI, its turbulent velocity is lower. As a consequence, for the same gas surface density, H2 is less stable. Therefore, in this paper we also consider the method of Romeo & Wiegert(2011) and Romeo & Falstad (2013). Their N accounts for an arbitrary number of phases. It is defined as(see Equation(19) of Romeo & Falstad 2013)
( ) ( )
å
p s k
= GS
r W T 1 . 4 N i i i i i
Thefirst factor is the ToomreQparameter(Toomre1964)for each particular phase, consisting of Newton’s gravitational constant G, the surface density of the phaseSi, the velocity dispersion of the phase si, and the epicyclic frequencyk( )r calculated from the rotation curve.WiandTiare dimensionless parameters of order unity; these account for the overall stability being dominated by the most stable phase and the effect of the finite thickness of the disk, respectively(see Equations(16)and
(18) from Romeo & Falstad 2013). Following Romeo & Falstad(2013), we usesH2»6km s
−1(Wilson et al.2011)and sHI»11km s−
1(Leroy et al.2008).
In the rest of this work, when we refer to “ToomreQ,”we mean that we are treating all of the gas (HI,H2, and He)as a single phase with sgas=11 km s−1, with He included as a
factor of 1.33 correction to the mass. This will accurately model theHI, but will overestimate the stability of theH2from an artificially highsH2.“N”refers to the multiphase stability criterion of Romeo & Falstad(2013), which properly accounts for the coldH2.
3. RESULTS
3.1. Overview of UGC 6168
In the top panels of Figure1, we present the integratedflux maps for ourHI(left)and CO(right)synthesis observations of UGC 6168. The contours begin at and are spaced every 5Mpc-2ofHIor inferredH2mass, as projected onto the sky.
These contours are then overlaid on SDSSr-band images. The top left panel shows theHIintegratedflux map. Like the other two galaxies in this work, UGC 6168 is a spiral galaxy. Huang et al.(2014)note that the color gradient in UGC 6168 reverses, that is, as radius increases, the average color of the galaxyfirst becomes bluer and then redder in the outer disk. Color inversions may be related to declining star formation, dust-obscured central star formation, and outward migration of stars. This color gradient reversal is also a feature of UGC 7899 and NGC 5230.
TheHI is extended beyond the optical radius, as is typical for a gas-rich galaxy. In addition, theHI within 5 kpc of the galaxy’s center is clearly depleted, leaving a hole. This is unsurprising: the galaxies discussed in this work were specifically observed because they had the highest expected
H2masses out of the HIghMass sample. They are thus likely to be some of the most efficient at transforming gas into new stars. The top right panel shows theH2 distribution, as inferred from the CO emission. It very neatlyfills in the hole left by theHI. The bottom panels of Figure1show the velocityfields of the
HI(left)and CO(right). Isovelocity contours are spaced every 20 km s−1. The CO emission is not sufficiently resolved by our 10″ clean beam, and so no rotation curve can be fit. We nonetheless fit an average position angle, and the best fit for each phase is overlaid. We note that the rotational axis of each phase is clearly different, which is indicative of noncircu-larflows.
Figure2 presents the rotation curve of UGC 6168 derived from a tilted ring fit. The top left panel shows the rotation velocity as a function of radius. This rotation curve is derived with constant PA=296°. 1 north of west and i=59°. 2. UGC 6168ʼs rotation increases slowly to ∼200 km s−1 over the 35 kpc for which we can trace the gas, and appears to still be rising. Our ROTCUR model of the galaxy includes strong noncircular motions (top right panel) within 25 kpc of the galaxy’s center. These noncircular velocities reach 40% of the galaxy’s rotation speed, significantly higher than the 9% observed in the “marginally unstable” UGC 9037 by Hallenbeck et al.(2014). It must be noted, however, that the signs of the noncircular velocities are degenerate with galaxy geometry, and these could be associated with either inward or outwardflows.ROTCURunderestimates the uncertainties of the noncircular velocities. Fitting the galaxy’s rotation curve with DiskFit—which more accurately estimates the uncertainties— indicates that models of radial or bar-like flows are of 1σ–2σ significance.
Figure 3 shows the deprojected surface density profiles of both the HI (closed circles) and H2 (open circles). The solid black line is the total gas density. The stars depict the star formation surface density(from Huang et al.2014, Figure 15). In the inner disk, the total gas density remains relatively constant at∼10Mpc-2(cyan triple-dot-dashed line), a surface
density beyond which there is rarely HI at solar metallicities
Figure 1.Top:HI(left)and CO(right)integratedflux maps of UGC 6168. Contours begin at and are spaced every 5Mpc-2of eitherHIor inferredH2. Both contours are overlaid on an inverted SDSSr-band image. Bottom:HI(left)and CO(right)velocityfields, with isovelocity contours spaced every 20 km s−1. TheHI
is depleted in the center and appears in the shape of a ring. While the CO is just barely resolved, the major axes of rotation for theHIand CO are different(black lines), which suggests the presence of noncircularflows in the galaxy.
However, at surface densities corresponding toQ2.5(lower red dotted line), star formation is observed to be enhanced
(Kennicutt1989; Martin & Kennicutt2001; Leroy et al.2008). We refer to1 <Q<2.5as the“marginally unstable”regime. For UGC 6168, the gas disk is predicted to be stable in the interior 7 kpc and atr>18 kpc and is marginally unstable at intermediate radii. This marginal instability coincides with an SFR enhancement near 12–15 kpc. However, overall star formation is peaked at the center of the galaxy, where we predict the gas to be stable.
3.2. Overview of UGC 7899
Images, surface density contours, and velocityfields of UGC 7899 appear in Figure 4; the panels are identical to Figure 1. Like UGC 6168, UGC 7899 is an inclined spiral galaxy, with
~
i 72 . It also exhibits a color reversal, where the galaxy exhibits redder colors at larger radii than at intermediate radii
(Huang et al. 2014). A close inspection also reveals that the optical galaxy is not perfectly symmetric: it tapers, with the optical emission at the northern edge of the galaxy more extended than at the southern edge.
The HI and inferred H2 contours begin at projected 5Mpc-2 and increase by 5Mpc-2 at each additional
contour. The HI in the center of UGC 7899 is not depleted: there is no HI ring. Instead, its surface density becomes approximately constant. There are, however, high H2 surface densities—much higher densities than are observed in either UGC 6168 or UGC 7899, reaching a projected column density of ∼50Mpc-2 (corresponding to roughly 25Mpc-2 when
deprojected). The contours on the southern side of the galaxy suggest a slight warp in theHI disk at large radii.
The bottom panels show the velocityfields of the HI (left) and CO (right). The HI velocity field appears slightly asymmetric, suggesting a warp in the outermost part of the disk. Like UGC 6168, the CO is only marginally resolved at the scale of the CARMA beam, and no rotation curve can befit.
Figure5 presents the results of tilted ring fits to the UGC 7899ʼsHI velocityfield (black circles). The best-fit constant PA and i are PA=39°. 8 north of west and i=71°. 1. The rotation curve rises linearly to∼180 km s−1and then changes to a shallower slope, reaching a maximum of ∼230 km s−1. Thefit becomes uncertain at large radii because of the north– south mismatch mentioned above: wefind a declining rotation curve in the southern approaching half of the galaxy, but not in the northern receding half. DiskFit suggests that these observed noncircular flows are of marginal (1σ–2σ) significance, and only in the outer regions. Because geometry and noncircular velocities are degenerate, wefit a second model to the map to capture the effect of the galaxy’s warp(red circles). This model holdsfixed both the rotation curve and a radialflow of 0 km s−1. Here we observe a relatively constant position angle, which changes abruptly by 4 at a galactocentric radius of 25 kpc.
Figure6presents deprojected surface densities ofHIandH2 as a function of radius. Also included are our Q<1 and
<
Q 2.5 stability curves and a SHI=10Mpc-2 saturation
line. Unlike UGC 6168, there is noHIhole in the center of the galaxy. Instead, the HI saturates at 10Mpc-2, while SH2 reaches nearly 30Mpc-2, 50% higher than either of the other
two galaxies in this work. We predict that the disk is marginally unstable forr<30 kpc, with the disk at or near instability for
<
r 20 kpc. This is in agreement with the observation that the most active star formation in UGC 7899 is centrally located.
3.3. Overview of NGC 5230(UGC 8573)
Figure 7 presents the HI and CO moment maps of NGC 5230. NGC 5230 is a large spiral galaxy with a low inclination
(i~20). Its southern arm appears less tightly wound than the other two in the north. Like UGC 6168, there is a large central hole where theHIhas essentially all been converted into H2. However, theHIhole in NGC 5230 is larger, with a radius of 10–15 kpc, and has no HI down to our detection limits of
1.63Mpc-2. All three spiral arms show enhanced densities of H2, out to CARMA’s half-power response radius(dashed line). We thus cannot know whether all of the CO has been mapped. Regardless, we have adequately mapped the CO emission of the inner 30″(∼15 kpc).
Because of the low inclination of NGC 5230 (i<40), fitting a rotation curve and deriving surface densities fromHI
velocity fields via tilted ring fits (Begeman 1989) is highly unreliable. We thus remove it from our later surface density, rotation curve, and dark matterfitting except as noted.
3.4. Multiphase Stability Parameter
Figure 8 presents the multiphaseN of Romeo & Falstad (2013) for both UGC 6168 (red triangles) and UGC 7899
(green squares). The radii have been normalized byr-bandR25, the radius at which the isophotes reach 25 mag arcsec-2. The dashed line indicates a value ofN =1. For values ofN <1, the disk is unstable to perturbations, while forN >1, the disk
is stable.
Both galaxies show similar trends: they are predicted to be stable beyond the optical disk (R>R25) and are marginally unstable (N2.5)in the region 0.5<R R25<1.0. In the inner disk(R<0.5R25), UGC 6168 becomes stable again, but the high surface densities of H2 cause UGC 7899 to become unstable. Neither disk is predicted to be unstable to ring-like perturbations.
These results are not greatly different from the one-phase ToomreQresults discussed in the previous sections. The only significant change is that for UGC 6168, the multiphase model predicts a marginally unstable(N2.5)disk at intermediate
radii, while the single-phase model predicts a fully unstable disk.
3.5. HIRadii
For both typical spiral galaxies and more massive spiral galaxies, there exists a tight linear correlation between the total
HI gas mass and the radius at which the deprojected surface density reaches 1Mpc-2 (Broeils & Rhee 1997; Wang
et al.2013,2016). This relationship can be expressed as(from
Figure 5.Rotation curve of UGC 7899 derived byfitting a tilted ring model(black circles). Panels are identical to Figure2. The rotation curve quickly rises to a maximum speed of 200–250 km s−1at a radius of 10 kpc and remainsflat. The noncircular velocitiesfit here prove to be only of marginal significance when reexamined with DiskFit. Instead, a model without noncircular velocities(red circles)isfit, which captures the warp with the abrupt change of the position angle at 25 kpc.
Figure 7.Integratedflux maps and velocityfields of NGC 5230. Panels are identical to Figure1. The inclination of NGC 5230 is lower than for the other two galaxies
(i~40), allowing a clear view of theHIring. CO emission reaches beyond the 50% response radius of CARMA(~ 30 ;dashed line), but not beyond the 20% response radius. The CO emission is resolved enough by CARMA to produce a rotation curve.
Equation(13)in Broeils & Rhee 1997)
ˆ
( )
=
-R M
M log
kpc 0.51 log 3.63. 5
HI HI
Figure 9 presents this line, along with the Broeils & Rhee
(1997)sample(grayfilled circles). The HIghMass galaxies are plotted in black. This relationship also holds true for the galaxies discussed by Hallenbeck et al. (2014)—UGC 9037 and UGC 12506. TheHIdisks of UGC 6168, UGC 7899, and NGC 5230 lie to the left of the line and so are more compact than expected. For NGC 5230, we have plotted assuming that
=
i 0 , which yields the largest value of RHI. For the three galaxies this difference is near the edge of significance
(1.5s–2.9s), but taken together, the difference is reasonably significant(3.6s). Theoretically, the baryonic disk scale radius should increase with λand the rotational velocity of the disk
(e.g., Mo et al.1998; Hernandez et al.2007; Berta et al.2008). This could indicate that these galaxies have somehow had their
HIcompressed, or that instabilities in the disk are allowing the normally extended, low-surface-density gas to flow inward. Table 2 presents theHI radii of all five galaxies, along with their expectedHI radii.
3.6. Star Formation Efficiencies
It has already been observed that the HIghMass galaxies have moderate to high values of SFE(HI)º SFR MHI relative to the ALFALFA sample as a whole (Huang et al. 2012b). In addition, our CARMA observations show that their SFRs are also typical for their H2 masses: the H2 depletion timescales (tH2ºMH2+He SFR)are 0.3, 0.4, and1.6´10
9 yr
for UGC 6168, UGC 7899, and NGC 5230, respectively. These values are below the timescale observed by the THINGS survey of (1.3 3.6– )´109 yr (Leroy et al. 2008), as well as the 2.35´10 yr9 found by Bigiel et al. (2011). However, they overlap the predicted range found by the COLD GASS
survey for galaxies of similar stellar masses (Saintonge et al. 2011a,2011b;(0.8 1.25– )´109yr).
However, the globally averaged SFEs ofHIandH2 are just part of the story: the resolved SFE of our sample is likely to shed more light. The THINGS survey found several ways to parameterize the efficiency of the total gas(HI,H2, and He)as a function of galactic radius, normalized byR25(see Equation (21)of Leroy et al.2008). If we just consider the spiral galaxies in THINGS,
(
)
( )
( )
=
´ <
´ - >
--
-⎧ ⎨ ⎪ ⎩⎪
R R
R R
SFE gas
5.9 10 0.4
3.0 10 exp RR 0.4 yr 6
10
25
10
0.25 25
1
25
This form represents a constant value ofSFE H( 2) and thus a
constant SFE gas( ) in the region of the interstellar medium
(ISM)that isH2dominated(S > SH2 HI;R0.4R25). Outside of this region, the disk isHI dominated and the conversion of
Figure 9. HImass as a function of radius for the spiral and irregular galaxies of Broeils & Rhee(1997) (small grayfilled circles), along with the best-fit line; the dashed line is the1sof the line. The larger blackfilled circles are HIghMass galaxies. The three HIghMass galaxies presented in this paper along with UGC 9037 lie to the left of the best-fit line(i.e., they have smallerRHIthan predicted), while only the LSB galaxy UGC 12506 is within the error of the line. For some of the HIghMass
galaxies, the uncertainties are smaller than the plotted points.
Table 2
Observed and ExpectedHIRadii
Galaxy RHI RˆHI
(kpc) (kpc)
(1) (2) (3)
UGC 6168 36.6(±0.7) 45.0(±5.2)
UGC 7899 38.2(±1.5) 48.9(±5.7)
NGC 5230 36.1(±0.9)a 55.6(±6.6)
UGC 9037 42.1(±0.7) 43.9(±3.5)
UGC 12506 57.8(±1.9) 55.6(±4.5)
Note.Observed and expectedHIradii of the three galaxies in this work and in Hallenbeck et al.(2014). Column(1): galaxy identifier. Column(2): observed radius where theHIreaches a deprojected surface density of 1Mpc-2, based onfitting the surface density profiles. Column(2): predictedHIradius, based on Equation(5)and Broeils & Rhee(1997).
a
gas to stars becomes inefficient, declining exponentially with radius.
Figure10presents thisfit, along with SFE(gas)for the three HIghMass galaxies in this work. Red triangles, green squares, and blue crosses represent data for UGC 6168, UGCC 7899, and NGC 5230, respectively. Here, we include NGC 5230 because SFE(gas)depends on the ratio of two surface densities and so is independent of the assumed inclination. The dashed line is the parameterization in Equation (6). The HIghMass galaxies in this work all exhibit the same overall trend of the THINGS parameterization: there is a core with nearly constant SFE(gas), and then at some radius, SFE begins to drop. At small radii, where theH2dominates the ISM, we see essentially no difference between the galaxies in our sample and the average spiral galaxy in the THINGS survey. In the outer disk, where the HI dominates the ISM, the SFE of our sample is significantly lower than for THINGS. The dot-dashed line is a best fit to the HIghMass data, assuming an exponential decrease in SFE(gas) beyond R>0.4R25. This has a significantly shorter scale length of0.190(0.001)R25.
Given that the global SFE(HI)for these galaxies is typical, it is somewhat surprising tofind that the resolved SFE(gas)is low where the ISM is primarilyHI. This may be a consequence of the gas being unusually compact in these galaxies. The Hα emission has been traced to only approximately R R25 <1.0.
Of the totalHImass, 30% resides beyond this radius for UGC 6168 but only 3% for NGC 5230. For UGC 7899, this explanation is less conclusive: the star formation is only traced toR R25<0.6, with 70% of the totalHImass residing beyond
that radius.
A related possibility is that the relatively lower mass spiral sample of THINGS is a poor comparison sample. R25for the THINGS galaxies varies between 10 and 20 kpc, while the three galaxies in this work have radii of 24–36 kpc (the HIghMass sample as a whole has an average R25 of 20 kpc). The THINGS-derived SFE(gas)relationship has a factor of 2–3 scatter, and in general the galaxies with larger R25 in the
THINGS sample tend to fall below the relationship (Leroy et al.2008). This may hint at a possible decrease in SFE scale radius at large galactic radii.
3.7. Dark Matter Properties
We model each galaxy with four components: anHIdisk, an
H2disk, a stellar disk, and dark matter. We use theHIandH2 surface densities derived in Sections2and2.1and treat each as a thin disk. The stellar component is also modeled as a thin disk, using the stellar masses described in Section 2.2. The contribution of the dark matter can be determined via
( ) *
= + + +
Vobs2 VH2I VH22 V2 VDM2 7
whereVobsis the rotation curve, and the other velocities are the contributions from each phase. Both a Navarro–Frenk–White
(NFW)and a pseudo-isothermal profile(ISO)are separatelyfit to the remainingVDMcomponent.
Using the methods of Querejeta et al.(2014)predicts mass-to-light ratios(¡3.6)that are too high: the resulting stellar mass surface densities yieldV*2>Vobs2 or unphysical parameters for dark matterfits(c<0, for example). The¡3.6distribution has a spread of roughly 0.1 dex, which is insufficient to explain the difference. Instead, this is likely because we have not accounted for the effect of dust or stars of intermediate age contaminating the Spitzer 3.6 mm and 4.5 mm bands, which together can account for 20%–60% of the total infrared emission(Meidt et al.2012). If we allow¡3.6to vary from its nominal value, best fits for both galaxies yield similarly inappropriate¡ »3.6 0. Instead, we set the average value of¡3.6 such that theSpitzer-derived mass equals the mass from SED fitting. In such cases, we get goodfits for both UGC 6168 and UGC 7899. This requires values of¡3.6a factor of 2–3 lower than the nominal values derived by Querejeta et al.(2014).
In Figure 11, we present both the dark matter fits to each galaxy’s rotation curve, using the NFW (left) and pseudo-isothermal (right) halo profiles. Black filled circles with
uncertainties are the observed rotation curve. The thin solid black line is the total gas(HI+H2+He)contribution, the short-dashed line is the stellar mass contribution, and the long-short-dashed line is the halo fit. The thick solid line is the summed contribution from each of the mass terms. For each galaxy, the dark matter is the dominant contribution to the rotation curve in the best-fit model at all radii. For UGC 6168 and UGC 7899, both the ISO and NFW profiles fit well (cn2~1). Numerical results of the dark matterfits can be found in Table3.
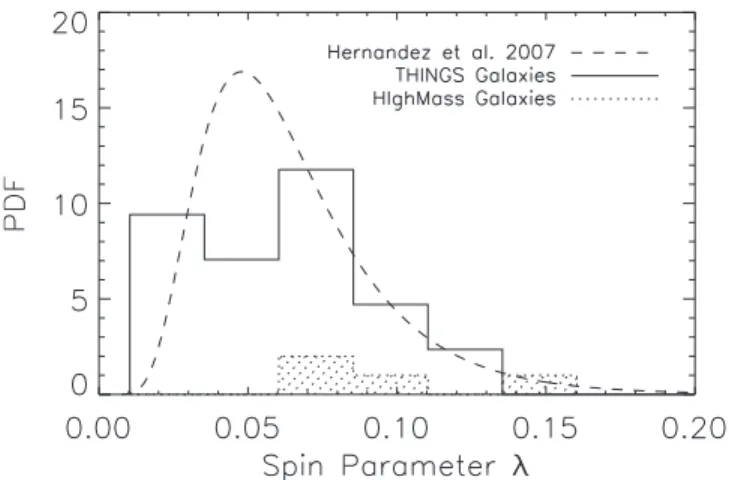
Figure 12 plots a histogram of dark matter halo spin parameters of three different samples. The solid histogram is the THINGS sample calculated as described in Hallenbeck
et al.(2014)and is normalized to unit area. For comparison is the volume-limited sample from the SDSS taken by Hernandez et al.(2007)and calculated from the global optical properties alone. The two distributions(and thus calculation methods)are roughly the same, especially accounting for the differences in sample size (19 THINGS galaxies versus 11,597 SDSS-selected galaxies). The remaining filled dotted bars are non-normalized counts of the galaxies from this work combined with Hallenbeck et al. (2014). UGC 12506 clearly has a high spin (l=0.15). UGC 6168, UGC 7899, and UGC 9037 all have values that are somewhat high, but not far into the tail(l»0.09).
Figure 11.Rotation curves(blackfilled circles)and best-fit mass models(thick black lines)for UGC 6168 and UGC 7899. Long-dashed lines are dark matter halofits using an NFW(left)or a pseudo-isothermal(right)profile. The thin black line is the total gas(HI,H2, and He)contribution to the rotation curve, while the short-dashed line is the contribution from the stellar disk, afterfitting¡3.6. The dark matter is the dominant contributor to the rotation curve for every model. Fits for UGC 6168 and UGC 7899 are excellent for both halo profiles(cn2~0.5).
Table 3
Dark Matter Fits
Galaxy NFW Fit ISO Fit Halo Spin
á¡ ñ3.6 á¡3.6SEDñ c R200 cn2 rC RC cn2 λ
(M L) (ML) (kpc) (10-3Mpc-2) (kpc)
(1) (2) (3) (4) (5) (6) (7) (8) (9) (10)
UGC 6168 0.45 0.27 1.47±0.51 203±36 1.03 9.2±1.6 10.4±1.3 0.41 0.09
UGC 7899 0.43 0.16 1.75±0.29 224±23 0.10 13.60±0.52 9.00±0.28 0.02 0.08
4. DISCUSSION
UGC 9037 and UGC 12506—the two HIghMass galaxies previously studied in detail by Hallenbeck et al.(2014)—were found to have very different properties. UGC 12506 has low surface densities of HI (typically 1–5Mpc-2 at radii from
10–40 kpc)and is an LSB galaxy. These properties can all be explained by its very high dark matter halo spin parameter
(l=0.15). UGC 9037, on the other hand, has an above average but unexceptional spin parameter (l=0.07). Its HI
has high (>10Mpc-2) surface densities atr<10 kpc, and
correspondingly the Toomre Q at most radii was moderately unstable, especially in comparison with the stable HI disk of UGC 12506. UGC 9037 also has high-velocity gas inflows at all radii. UGC 9037ʼs above average spin parameter may have suppressed star formation over much of cosmic history. However, the high surface densities of HI and inflowing gas suggest a recent enhancement in star formation in comparison with its time-averaged rate. We thus see two very different states for these two galaxies: UGC 12506 remains in a low-surface-density, suppressed star formation state, while UGC 9037 is beginning a phase of enhanced star formation— possibly triggered by recently acquired gas.
Overall, the three galaxies discussed in this work (UGC 6168, UGC 7899, and NGC 5230)appear more like UGC 9037 than UGC 12506. First, none of the three are LSB galaxies. They all have typical SFRs for theirH2masses and have short SFE scale lengths—that is, their star formation quickly becomes extremely inefficient where the ISM isHIdominated in comparison with the THINGS sample. These properties strongly suggest that any possible star formation bottleneck is in theHI-to-H2 conversion, and not in the conversion ofH2to
HI. In addition, for the two galaxies for which a spin parameter can be measured(UGC 6168 and UGC 7899),λis found to be above average, but not exceptionally so, and gas surface densities are found to reach typical values(~10Mpc-2)over
a range of radii. This is in contrast with the theoretical prediction that higher spin parameters are theoretically associated with lower gas and star formation surface densities
(e.g., Boissier & Prantzos 2000). We thus claim that the galaxies in this work are transitioning from a long history of suppressed star formation to a more active phase. These findings are in agreement with Huang et al.(2014), who came to the same conclusion based on studying the Hα emission of the HIghMass galaxies.
UGC 6168, like UGC 9037, is observed to have a moderately unstable gas disk across a wide range of radii. It is also possible that UGC 6168 has inflowing gas, but the observed noncircularflows in the galaxy are of only marginal
(1σ–2σ) significance. The strongest indication of noncircular flows is the misalignment between the average position angle of the HI and CO gas phases. It does not have the high HI
surface densities observed in UGC 9037, instead saturating at the typical10Mpc-2. Finally, we have calculated its spin
parameter to bel=0.09, an above average but not extremely large value.
UGC 7899 shares many properties with UGC 6168 and UGC 9037: it is not an LSB, it has a moderately unstable disk, and it has an above average λ. Like the previously studied UGC 9037, theHI in the center of the galaxy is not depleted, but saturates at10Mpc-2; we also see high surface densities
ofH2. Unlike UGC 6168 and UGC 7899, there is no evidence of noncircular motion in the gas disk of the galaxy. It is unique among the HIghMass galaxies so far presented in that its disk shows some warping, which could be indicative of recent cold accretion from the intergalactic medium. However, warps in
HIdisks at large radii have long been observed to be common, even in relatively isolated galaxies(Sancisi1976; Bosma1981; Briggs1990; van der Kruit & Freeman2011).
Because we are unable to make a clear case for the inclination—and thus the surface densities or dark matter profile—the case for NGC 5230 is more difficult. It is easiest to compare it with the other galaxies in this work: despite highHI
gas masses and gas fractions, all three show typical values of SFE(HI)and SFE(gas)in comparison with otherHI-selected galaxies and the optically selected GASS sample, respectively. All three show a shorter SFE length scale than for the local spirals of THINGS. In addition, all three show evidence for a much smaller RHI than is expected for their HI masses, regardless of what inclination is assumed for NGC 5230.
NGC 5230ʼs neighbors may be the most important clues to understanding the galaxy. There are two galaxies of similar size within 1 Mpc of NGC 5230: NGC 5222, at a projected distance of 300 kpc to the west, and NGC 5221, 400 kpc to the northwest. NGC 5222 is an elliptical galaxy hosting an active galactic nucleus and has an optically much smaller blue companion. More interesting is NGC 5221, an irregular spiral with a long tail pointing to the northwest. An optical image of NGC 5230 and its neighbors can be found in Figure13, with contours from ALFALFA overlaid. These three galaxies are embedded in a commonHIenvelope with a significant amount of gas: both NGC 5222ʼs blue companion and NGC 5221 are detected in ALFALFA, with logMHI=9.96 and 10.02,
respectively. A number of tidal tails and otherwise extragalactic gas can be observed in the ALFALFA data cubes. A bridge between NGC 5230 and NGC 5221 is visible, and tails between NGC 5222 and its neighbors are possible but unresolved due to the large(∼120 kpc at 88 Mpc)ALFALFA beam. It is thus a strong possibility that NGC 5230ʼs current state is due to its clear interaction with its neighbors. Its gas is likely compressed due to tidal torques, yet its SFE can remain low because much
of the gas nominally associated with it is extended and at low column density.
5. CONCLUSIONS
The HIghMass sample is a selection of 34 galaxies from the ALFALFA 40% data release that all have highHImasses and are all gas-rich for their stellar masses. We have presented resolvedHI andH2studies of three HIghMass galaxies, UGC 6168, UGC 7899, and NGC 5230. Along with UGC 9037 and UGC 12506, this brings the total number of resolved gas studies of the HIghMass galaxies tofive. None of the galaxies in this work appear to host extremely high dark matter spin parameters like UGC 12506. Instead, most of the galaxies so far appear more like the previously studied UGC 9037: galaxies in transition from a gas-rich but inactive phase to a phase of active star formation. The galaxies in this work display the following properties:
1.High HI masses and high gas fractionscompared with an optically selected sample, like all HIghMass galaxies. 2.More concentrated HI disksare observed than are
expected for their HI masses. This was not observed in either of the HIghMass galaxies previously studied. 3.Moderately unstable disks, with values of both ToomreQ
and theN of Romeo & Falstad(2013)2over a wide range of radii, are observed in UGC 6168 and UGC 7899. 4.TypicalH2 SFEs compared with two optically selected samples: the local spiral galaxies of THINGS and COLD GASS galaxies of similar stellar mass. This comparison holds for both global (both samples)and resolved SFEs
(THINGS).
5. Mixed HI SFEs. Globally, their SFE(HI)is typical for an
HI-selected sample, but in theHI-dominated region of each galaxy, SFE as a function of radius declines with a shorter scale length (0.19R25) than the spirals of the THINGS sample(0.25R25).
6. Above average spin parameterscompared with an optically selected sample are observed for UGC 6168 and UGC 7899(l=0.09 and 0.08); we cannot directly measureλfor NGC 5230.
Individually, there are a few unique features in each galaxy, which hint at their past and why theirHIcontent is so large for their stellar masses:
1. For UGC 6168, the average position angles in theHIand
H2 phases do not match, which indicates noncircular motions in its gas disk.
2. UGC 7899is the only HIghMass galaxy thus far for which a warp has been observed in the outer HI disk, which may be indicative of accretion of cold gas from the intergalactic medium.
3. NGC 5230has two lower-mass neighbors, all sharing a commonHIenvelope. Its highHImass but typical SFR may be partially explained by gas taken from its neighbors that has not yet settled into the galactic disk.
This work has been supported by NSF-AST-0606007 and AST-1107390, NASA/JPL Spitzer RSA/73350, grants from the Brinson Foundation, and a Student Observing Support award from NRAO.
This work is based in part on observations made with the Combined Array for Research in Millimeter-wavelength Astronomy (CARMA). Support for CARMA construction
was derived from the Gordon and Betty Moore Foundation, the Kenneth T. and Eileen L. Norris Foundation, the James S. McDonnell Foundation, the Associates of the California Institute of Technology, the University of Chicago, the states of California, Illinois, and Maryland, and the National Science Foundation. CARMA development and operations were supported by the National Science Foundation under a cooperative agreement and by the CARMA partner universities.
This work is based in part on observations made with the Karl G. Jansky Very Large Array, a facility of the National Radio Astronomy Observatory (NRAO). The NRAO is a facility of the National Science Foundation operated under cooperative agreement by Associated Universities, Inc.
This work is based in part on observations made with the Arecibo Observatory. The Arecibo Observatory is operated by SRI International under a cooperative agreement with the National Science Foundation (AST-1100968), and in alliance with Ana G. Méndez-Universidad Metropolitana and the Universities Space Research Association. This work is based in part on observations made with theSpitzer Space Telescope, which is operated by the Jet Propulsion Laboratory, California Institute of Technology, under a contract with NASA.
This work has made use of THINGS, “The HI Nearby Galaxy Survey”(Walter et al.2008).
REFERENCES
Abdo, A. A., Ackermann, M., Ajello, M., et al. 2010,ApJ,710, 133 Arimoto, N., Sofue, Y., & Tsujimoto, T. 1996,PASJ,48, 275 Begeman, K. G. 1989, A&A,223, 47
Bell, E. F., McIntosh, D. H., Katz, N., & Weinberg, M. D. 2003, ApJS, 149, 289
Berta, Z. K., Jimenez, R., Heavens, A. F., & Panter, B. 2008, MNRAS, 391, 197
Bigiel, F., Leroy, A., Walter, F., et al. 2008,AJ,136, 2846 Bigiel, F., Leroy, A. K., Walter, F., et al. 2011,ApJL,730, L13
Blitz, L., Fukui, Y., Kawamura, A., et al. 2007, in Protostars and Planets V, Giant Molecular Clouds in Local Group Galaxies, ed. D. Reipurth, D. Jewitt, & K. Keil(Tucson, AZ: Univ. Arizona Press),81
Boissier, S., & Prantzos, N. 2000,MNRAS,312, 398
Bolatto, A. D., Wolfire, M., & Leroy, A. K. 2013,ARA&A,51, 207 Bosma, A. 1981,AJ,86, 1791
Bothun, G. D., Impey, C. D., Malin, D. F., & Mould, J. R. 1987,AJ,94, 23 Briggs, F. H. 1990,ApJ,352, 15
Brinchmann, J., Charlot, S., White, S. D. M., et al. 2004,MNRAS,351, 1151 Broeils, A. H., & Rhee, M.-H. 1997, A&A,324, 877
Catinella, B., & Cortese, L. 2015,MNRAS,446, 3526
Catinella, B., Schiminovich, D., Kauffmann, G., et al. 2010, MNRAS, 403, 683
Cervantes-Sodi, B., & Hernández, X. 2009, RMxAA,45, 75 Dame, T. M., Hartmann, D., & Thaddeus, P. 2001,ApJ,547, 792 Draine, B. T., Dale, D. A., Bendo, G., et al. 2007,ApJ,663, 866
Fazio, G. G., Hora, J. L., Allen, L. E., et al. 2004,ApJS,154, 10 Fraternali, F., & Binney, J. J. 2006,MNRAS,366, 449 Fraternali, F., & Binney, J. J. 2008,MNRAS,386, 935
Fraternali, F., Oosterloo, T., Sancisi, R., & van Moorsel, G. 2001, ApJL, 562, L47
Hallenbeck, G., Huang, S., Spekkens, K., et al. 2014,AJ,148, 69 Haynes, M. P., Giovanelli, R., Martin, A. M., et al. 2011,AJ,142, 170 Hernandez, X., Park, C., Cervantes-Sodi, B., & Choi, Y.-Y. 2007,MNRAS,
375, 163
Heyer, M., Krawczyk, C., Duval, J., & Jackson, J. M. 2009,ApJ,699, 1092 Huang, S., Haynes, M. P., Giovanelli, R., et al. 2012a,AJ,143, 133 Huang, S., Haynes, M. P., Giovanelli, R., et al. 2014,ApJ,793, 40 Huang, S., Haynes, M. P., Giovanelli, R., & Brinchmann, J. 2012b,ApJ,
756, 113
Jimenez, R., Padoan, P., Matteucci, F., & Heavens, A. F. 1998,MNRAS, 299, 123
Kennicutt, R. C., Jr. 1989,ApJ,344, 685
Kuzio de Naray, R., Arsenault, C. A., Spekkens, K., et al. 2012,MNRAS, 427, 2523
Lee, C., Chung, A., Yun, M. S., et al. 2014,MNRAS,441, 1363 Lelli, F., Fraternali, F., & Sancisi, R. 2010,A&A,516, A11
Lemonias, J. J., Schiminovich, D., Catinella, B., Heckman, T. M., & Moran, S. M. 2014,ApJ,790, 27
Leroy, A. K., Walter, F., Brinks, E., et al. 2008,AJ,136, 2782
Macciò, A. V., Dutton, A. A., van den Bosch, F. C., et al. 2007,MNRAS, 378, 55
Marinacci, F., Binney, J., Fraternali, F., et al. 2010,MNRAS,404, 1464 Martin, C. L., & Kennicutt, R. C., Jr. 2001,ApJ,555, 301
Meidt, S. E., Schinnerer, E., Knapen, J. H., et al. 2012,ApJ,744, 17 Mo, H. J., Mao, S., & White, S. D. M. 1998,MNRAS,295, 319 Oppenheimer, B. D., Davé, R., Kereš, D., et al. 2010,MNRAS,406, 2325 Papastergis, E., Cattaneo, A., Huang, S., Giovanelli, R., & Haynes, M. P. 2012,
ApJ,759, 138
Querejeta, M., Meidt, S. E., Schinnerer, E., et al. 2014, arXiv:1410.0009 Rafikov, R. R. 2001,MNRAS,323, 445
Romeo, A. B., & Falstad, N. 2013,MNRAS,433, 1389 Romeo, A. B., & Wiegert, J. 2011,MNRAS,416, 1191
Saintonge, A., Kauffmann, G., Kramer, C., et al. 2011a,MNRAS,415, 32 Saintonge, A., Kauffmann, G., Wang, J., et al. 2011b,MNRAS,415, 61 Salim, S., Rich, R. M., Charlot, S., et al. 2007,ApJS,173, 267 Sancisi, R. 1976, A&A,53, 159
Sandstrom, K. M., Leroy, A. K., Walter, F., et al. 2013,ApJ,777, 5 Schiminovich, D., Catinella, B., Kauffmann, G., et al. 2010, MNRAS,
408, 919
Schiminovich, D., Wyder, T. K., Martin, D. C., et al. 2007,ApJS,173, 315 Sellwood, J. A., & Sánchez, R. Z. 2010,MNRAS,404, 1733
Solomon, P. M., Downes, D., Radford, S. J. E., & Barrett, J. W. 1997,ApJ, 478, 144
Spekkens, K., & Sellwood, J. A. 2007,ApJ,664, 204 Strong, A. W., & Mattox, J. R. 1996, A&A,308, L21 Toomre, A. 1964,ApJ,139, 1217
van der Kruit, P. C., & Freeman, K. C. 2011,ARA&A,49, 301 Walter, F., Brinks, E., de Blok, W. J. G., et al. 2008,AJ,136, 2563 Wang, B., & Silk, J. 1994,ApJ,427, 759
Wang, J., Kauffmann, G., Józsa, G. I. G., et al. 2013, arXiv:1303.3538 Wang, J., Koribalski, B. S., Serra, P., et al. 2016,MNRAS,460, 2143 Werner, M. W., Roellig, T. L., Low, F. J., et al. 2004,ApJS,154, 1 Wilson, C. D. 1995,ApJL,448, L97