NESTED SHELLS REVEAL THE REJUVENATION OF THE ORION
–
ERIDANUS SUPERBUBBLE
Bram B. Ochsendorf1, Anthony G. A. Brown1, John Bally2, and Alexander G. G. M. Tielens11
Leiden Observatory, Leiden University, P.O. Box 9513, NL-2300 RA, The Netherlands;[email protected]
2
CASA, APS, UCB389, University of Colorado, Boulder, CO 80389, USA Received 2015 January 5; accepted 2015 June 5; published 2015 July 27
ABSTRACT
The Orion–Eridanus superbubble is the prototypical superbubble owing to its proximity and evolutionary state. Herewe provide a synthesis of recent observational data fromWISEandPlanckwith archival data, allowing us to draw a new and more complete picture on the history and evolution of the Orion–Eridanus region. We discuss the general morphological structures and observational characteristics of the superbubbleand derive quantitative properties of the gasand dust inside Barnard’s Loop. We reveal that Barnard’s Loop is a complete bubble structure that, together with the λ Ori region and other smaller-scale bubbles, expands within the Orion–Eridanus superbubble. We argue that the Orion–Eridanus superbubble is larger and more complex than previously thought, and that it can be viewed as a series of nested shells, superimposed along the line of sight. During the lifetime of the superbubble, HIIregion champagne flows and thermal evaporation of embedded clouds continuously mass-load the superbubble interior, while winds or supernovae from the Orion OB association rejuvenate the superbubble by sweeping up the material from the interior cavities in an episodic fashion, possibly triggering the formation of new stars that form shells of their own. The steady supply of material into the superbubble cavity implies that dust processing from interior supernova remnants is more efficient than previously thought. The cycle of massloading, interior cleansing, and star formation repeats until the molecular reservoir is depleted or the clouds have been disrupted. While the nested shells come and go, the superbubble remains for tens of millions of years.
Key words:HIIregions–ISM: bubbles– ISM: clouds– ISM: kinematics and dynamics–stars: formation
1. INTRODUCTION
The Orion–Eridanus superbubble is a nearby (~400pc) expanding structure that is thought to span 20°× 45°on the sky(Reynolds & Ogden1979; Bally2008; Pon et al.2014b). Because of its proximity and evolutionary stage, it is traced at a multitude of wavelengths (Heiles et al. 1999), serving as a benchmark to the study of superbubbles. The expansion of the bubble is most likely connected to the combined effects of ionizing UV radiation, stellar winds, and a sequence of supernova (SN) explosions from the Orion OB association, Orion OB1(Blaauw1964; Brown et al.1994).
The line-of-sight expansion of the Orion–Eridanus superb-ubble is previously estimated at ∼15 km s−1 through line -splitting of Hα, which also revealed a total ionized gas mass of 8 × 10⁴ M and a kinetic energy of Ekin > 1.9 × 1050erg
(Reynolds & Ogden1979). Large-scale spectroscopic mapping of the entire Orion–Eridanus region in HI reported a larger expansion velocity of the superbubble of ∼40 km s−1 with a mass of 2.5´105M
, containing a kinetic energy of 3.7´1051 erg(Brown et al.1995), which is shown to be consistent with the integrated mechanical luminosity exerted by Orion OB1 (∼1052erg; Brown et al. 1995). The expansion of the superbubble is also traced through high-velocity (HV) and intermediate-velocity (IV)gas in several lines of sight toward Orion (Cowie et al. 1979; Welty et al. 2002). Soft X-rays emanate from the million-degree plasma in the interior of the superbubble (Burrows et al.1993; Snowden et al. 1995).
Herewe present observations of recent all-sky surveys with WISEandPlanckand combine them with existing sky surveys to provide a new and more complete insight into the history and evolution of the Orion–Eridanus region. In particular, we will reveal that Barnardʼs Loop is part of a complete bubble structure, separate from the Orion–Eridanus superbubble, that
sweeps up the mass-loaded interior of the preexisting superb-ubble. It is argued that the Orion–Eridanus superbubble is larger and more complex than previously thought, and that the entire morphological appearance of the superbubble can be viewed as a series of nested shells, superimposed along the line of sight. The shells originate from explosive feedback from Orion OB1 that accelerates, sweeps up, and compresses the superbubble interior plasmas in an episodic fashion to form nested shells within the Orion–Eridanus superbubble. We explore the origin of the shells, their relation with the subgroups of Orion OB1, and their impact on the molecular clouds and star formation efficiency within Orion. We discuss our findings in terms of the long-term evolution of the superbubble. We present the obervations in Section2and our results in Section3. We discuss ourfindings in Section4and summarize in Section5.
2. OBSERVATIONS
We made use of the all-sky surveys from Planck (Planck Collaboration et al. 2014c), the Wide-field Infrared Explorer (WISE; Wright et al.2010), the Leiden/Argentina/Bonn survey of Galactic HI (LAB; Kalberla et al. 2005), the ROSATsoft X-ray background (Snowden et al.1997), and an all-sky Hα map that combines several large-scale surveys ( Finkbei-ner 2003), including the Southern H-alpha Sky Survey Atlas (Gaustad et al.2001), the VirginiaTech Spectral-line Survey (Dennison et al. 1998), and the Wisconsin Hα Mapper (WHAM; Haffner et al.2003).
3. RESULTS
filamentary structures, including Barnardʼs Loop ( Bar-nard 1894) and the Eridanus filaments (e.g., Pon et al.
2014a). Projected on top of Barnardʼs Loop are the Orion A and Orion B molecular clouds (OMC A and OMC B), the Orion NebulaCluster (ONC) associated with the Orion Nebula, and the IC 434 emission nebula that is characterized by a champagne flow of ionized gas (Tenorio-Tagle 1979;
Section 3.3.4). Another prominent feature is the λ Orionis bubble, a 10°circular HIIregion, encapsulated by a swept-up shell of gas and dust. Belowwe refer to different parts of the superbubble in R.A./decl. space (see the orientation in Figure1).
Figure 2 shows cross-cuts through the Orion–Eridanus superbubble, revealing the gas and dust structures of the Figure 1.(a)Three-color image of the Orion–Eridanus superbubble. Hα(blue)reveals ionized gas, surrounded by a layer of polycyclic aromatic hydrocarbons or stochastically heated small grains, traced by theWISE12μm band(green). Red isPlanck353 GHz that probes columns of cold(20 K)dust. The polycyclic aromatic hydrocarbons/small grains trace the UV-illuminated edges of the clouds containing cold dust, resulting in that red and green blend to form yellow. To the northeast (top part the image)lies the Galactic plane, while to the northwest(right part of the image)lie high-latitude clouds(e.g., Schlafly et al.2014). The numbered boxes define the apertures discussed in Section3.2, while the light-green labeled solid lines mark the positions of cross-cuts used in Figure2.(b)Same region as panel(a), but only showing the Hαemission using a different stretch to accentuate the faint shell structure that envelops the Orion region in Hα. The white dot reveals thefl ux-weighted center of the Hαbubble(Reynolds & Ogden1979).(c)HIemission from the LAB survey, integrated in velocity space along the full extent of the Orion– Eridanus superbubble,−40 km s−1<v 40
superbubble and its interior components. Note that Barnardʼs Loop peaks dramatically in the ionized gas, while in the dust and neutral hydrogen it is only seen as a modest increase in the Planck,WISE, and LAB channels (Figures 2(a)–(c)). At this point, wefind no evidence that a dense shell encapsulates the ionized portion of Barnardʼs Loop, whose presence was predicted by Cowie et al. (1979) (Section 4). In contrast, the cross-cut shown in Figure 2(d)that traces the western bubble shell at high latitudes reveals a stratified structure, where a dust/ HI shell is clearly observed to encapsulate the Eridanus C filament. The absence of an HIshell associated with Barnardʼs Loop is surprisingand encouraged us to investigate the gas and dust content of Barnardʼs Loop and the Orion–Eridanus superbubble in more detail; our findings are presented in the next sections.
3.1. Dust in Barnardʼs Loop
3.1.1. Optical Depth
Heiles et al.(2000)defined two small regions of Barnardʼs Loop that are clear of any dense molecular clouds along the line of sight; we use the same apertures in the following analysis (“BLtop” and “BLbot”; Figure 1) to characterize the
dust contained in Barnardʼs Loop. The distance toward Barnardʼs Loop is uncertain; herewe assume that Barnardʼs Loop lies at the distance of the Orion Nebula(400 pc; Menten et al. 2007; Sandstrom et al. 2007). Electron densities inside Barnardʼs Loop are estimated at ne = 2.0 cm−3 (Heiles
et al. 2000)and at ne=3.2 cm−3from the surface brightness
of the Hβ line(O’Dell et al.2011). A similar analysis of the Hα surface brightness here leads to ne = 3.4 cm−3, after
correcting for limbbrightening (a factor of 7; O’Dell et al.2011)of a constant density shell with an apparent radial thickness of1, which amounts to 7 pc at the distance of 400 pc. Usingne=3.4 cm−3and a radial thickness of 7 pc, adopting
a normal gas-to-dust ratio of NH/AV=1.9 × 1021cm−2mag−1
(Bohlin et al. 1978), where NH is the column density of
hydrogen andAVthe visual extinction, and a UV-to-visual dust
absorption ratio of 1.8(Tielens & Hollenbach1985), the radial dust optical depth for UV photons with energies between 6 and 13.6 eV istUV=0.07.
Through a modified-blackbody fit to the Planck data, the PlanckR1.20 dust model provides all-sky maps of dust optical depth(at 353 GHz), temperature, spectral index, and the total dust emission integrated over frequency. We obtain an observed optical depth of Barnardʼs Loop at 353 GHz,
353,obs
t , by correcting the value of the optical depth from the Planck model at the location of Barnardʼs Loop for a background value. For this method we use the bins defined in Figures2(b)and(c): as Barnardʼs Loop is not encapsulated by a dense shell(Figure2and Section3.2), we determine the background in a region just outside of the ionized portion of Barnardʼs Loop(which is significant:∼60% of the total value for both regions). In this way, we isolate the dust grains contained within the ionized part of Barnardʼs Loop. Then, the observedoptical depths aret353,obs=9.0 × 10⁻⁶(forBLtop)and
353,obs
t = 5.1 × 10⁻⁶ (BLbot). We can compare this to the
expected optical depth, t353,cal, from the density (3.4 cm−3),
estimated line-of-sight depth(45 pc for a 1°thickness), and the opacity at 353 GHz(sn=7.9 × 10⁻²⁷cm2H−1)appropriate for
the diffuse interstellar medium (ISM; Planck Collaboration et al. 2014a). We calculate t353,cal = 4.0 × 10⁻⁶, in close
agreement witht353,obs, which implies that dust mixed with the
ionized shell of Barnardʼs Loop is similar to dust seen in the diffuse ISM.
3.1.2. Temperature
Heiles et al. (2000) concluded that grain temperatures in Barnardʼs Loop are higher than in HI regionsand proposed that Lyαphotons might contribute to the heating of the dust. However, direct heating from the radiationfield of Orion OB1 was not considered in their study. We derive an intensity of G0=14 reaching Barnardʼs Loop in units of the Habingfield
(Habing 1968), taking into account the radiation from the seven most massive stars in Orion OB1(θOri C,δOri,ιOri,
θ Ori A,σ Ori, ϵ Ori,ζ Ori), using stellar parameters from Martins et al. (2005). However, O’Dell (2001) shows that radiation from the Orion Nebula(θOri C andθOri A)might not reach Barnardʼs Loop, as the nebula is optically thick to ionizing radiation in all directions, except possibly to the southwest. This would decreaseG0to 11.
The observed dust temperatures from the Planck model in BLtopandBLbotareTd=18.7 K andTd=20.5 K, respectively.
These values are consistent with temperatures found by Heiles et al.(2000),Td=19.6 K andTd=20.3 K forBLtopandBLbot,
respectively, and the mean valueTd=19.7 K for the entire sky
(Planck Collaboration et al.2014a), even thoughG0 in BL is
significantly raised above the average interstellar radiationfield of the solar neighborhood (=1.7 Habingfield; Tielens2005). For comparison, at G0 = 14 a “typical” 0.1 μm silicate
(graphite)grain would be heated towardTd =19.2 (22.5)K
(Tielens2005). AtG0=11, this would beTd=18.6(21.8)K.
In this respect, Planck Collaboration et al.(2014a)and Planck Collaboration et al. (2014b) argue that observed dust temperatures do not simply trace the intensity of the radiation fieldbut also reflectchanges in grain properties, such as the size distribution, grain structure, and material changes. In any case, for bothBLtopandBLbot, we do not see the necessity of
an extra heating source to account for the observed grain temperatures, such as Lyα heating(Heiles et al.2000).
3.2. Dust and Gas in the Orion–Eridanus Superbubble
3.2.1. Global Observational Characteristics
The all-sky surveys listed in Section2allow us to determine the global observational characteristics of the Orion–Eridanus superbubble, which is of potential use to the study of more distant superbubbles that lack the spatial information of the Orion–Eridanus region. We use apertures that encompass the entire superbubble, the OMCs, and Barnardʼs Loop, respec-tively. For the OMCs and Barnardʼs Loop, these apertures coincide with the outlines depicted in Figure 1(d). While the full extent of the Orion–Eridanus superbubble will be thoroughly discussed in the remainder of this paper, here we already choose the“entire superbubble aperture”to encompass the majority of the Hαemission observed in Figure1(b), while tracing the outside of HIfilaments seen at−40 km s−1>vLSR
>40 km s−1(Figure1(c)), corresponding to the velocity extent in which the Orion–Eridanus superbubble has previously been identified(Brown et al.1995). We measure the Hαluminosity and total far-IR to submillimeter luminosity contained within the apertures, which are compared with stellar parameters of Orion OB1.
For the entire superbubble, we proceed as follows. The northand east sides of the superbubble aperture extend close to the Galactic plane and high-latitude clouds. The encompassed IR emission will therefore be contaminated by emission along the line of sight not related to the superbubble. While disentangling the separate contributions to the IR is not straightforward, we attempt to isolate the emission from our region of interest by measuring the average far-IR integrated intensity,IIR,fil, within the aperture labeled as“IRfil.”(Figure1
(d)), i.e., the dusty shell that encapsulates the limb-brightened Eridanus B and C filaments known to be associated with the superbubble. The intensities are taken from the Planck R1.20 dust model(Planck Collaboration et al.2014a)that usesIRAS 100μm andPlanck857, 545, and 353 GHz data to determine the total integrated far-IR intensity. Subsequently, we define emission from regions that are much brighter than observed in the limb-brightened filaments, i.e., IIR ⩾ 3IIR,fil, as not being
part of the superbubble. This procedure provides a mask tracing the regions of high IR brightness toward the Galactic planeand high-latitude foregroundand background clouds well. Note
that this procedurefilters out the emission from, e.g., the OMCs as well;we ultimately add the contributions of the OMC and Barnardʼs Loop apertures to get the full IR intensity of the superbubble and the relative contributions of the components (see Table1). For the Hαmap, the background contamination is much less severe and a masking procedure is not necessary. In this respect, we will argue below that all of the observed Hα in Figure1(b)is caused by photoionization from Orion OB1. While the masking procedure accounts for the high IR intensities of contaminating clouds toward the Galactic plane, it does not correct for the diffuse low-level background observed over the entire images. Therefore, we apply a global background subtraction to both the far-IR and Hα maps by measuring the background level within a circular region of 0◦. 4 radius at (l, b) = (229.6, −33.7) outside of the superbubble aperture that appears to be free of obvious emission features and provides a proper representation of the diffuse background emission averaged over latitude. For both maps, we do not include the λ Ori region in our analysis as it appears to be encircled by an ionization-bounded HII region (Warren & Hesser 1977; Wall et al. 1996)and can be regarded as being separated from Orion OB1.
Table1 lists two different values of LIR. The first value is
obtained by filling the masked region with the average IR brightness from the unmasked part of the superbubble aperture. In this way, we get an estimate of the full IR intensity of the entire superbubble if it were unaffected by foregroundor background emission along the line of sight. The second value is obtained by setting the masked part to zero, therefore neglectingthe masked part of the superbubble. The choice of including or excluding the masked part of the superbubble affects the inferred luminosities from the OMC and Barnardʼs Loop as well, as these apertures are completely immersed in the masked region of the image, and the chosen intensity of the masked region thus effectively acts as a “global”background for both regions. Belowwe include the masked region in our interpretations, as we believe that the inclusion of this part of the superbubble is essential to the analysis of the total energetics of the region. However, we refer the reader to Table1for the implications of this choice and its impact on the derived parameters. The total far-IR luminosity isLIR=4πItot
S, where Itot and S are the total integrated intensity and
projected surface area of the emitting region, respectively. For simplicity, we assume that the entire bubble is located at 400 pc. The measured IR luminosity is compared with stellar
Table 1
Global Observational Characteristics of the Orion–Eridanus Superbubble
Region Td LIR x LLya xion
(K) (105L) (105L)
Superbubble 19.5 7.9(5.7)a 0.47(0.34) 1.08 0.94 OMC 17.9 2.8(2.9) 0.16(0.17) 0.16 0.14 Barnardʼs Loop 19.6 0.5(0.6) 0.03(0.04) 0.20 0.17
Notes.Listed arethe dust temperature,Td; the infrared luminosity,LIR; fraction ofLIRto the total luminosity of Orion OB1,x; luminosity measured from Hα and converted to Lyα,LLya; and fraction of Lyαphotons to the total amount of ionizing photons of Orion OB1,xion. The values in parentheses denote the values measured when the masked part of the superbubble is set to zero(see the text). Uncertainties on derived numbers are discussed in the text.
a
parameters of Orion OB1 throughx=LIR/L, whereLis the total luminosity of the Orion OB region (1.7 × 10⁶ L, reevaluated at d = 400 pc, and excluding λ Ori; Warren & Hesser 1977; Wall et al. 1996). The parameterx defines the fraction of stellar radiation that is captured by the dust and reemitted in the IR averaged over all solid angles.
The Lyαphoton rate,NLya, is calculated by converting the
observed Hαphoton rate to an Lyαphoton rate using the ratio
B
a /aHa, whereaHais the effective recombination coefficient
of Hα (1.31 × 10⁻¹³cm3s−1 at T = 6000 K, which is the electron temperature in Barnardʼs Loop and the Eridanus filaments from Heiles et al.2000; Madsen et al.2006; O’Dell et al.2011; we use this value throughout the superbubble), and
B
a is the total recombination coefficient of hydrogen to all levels but the ground state(2.6 × 10⁻¹³cm−3s−1; Osterbrock & Ferland2006). Case B recombination requires thatNLyaequals
the total amount of recombinations, which is a quantity that can directly be compared to Orion OB1 throughxion =NLya/
Nion, whereNion is the total number of ionizing photons from
Orion OB1 (2.7 × 1049photons s−1, O’Dell et al.2011). This ratio measures the fraction of ionizing photons captured by the gas and converted to Lyα. In order to directly compare with the IR luminosity LIR, we convert NLya to a luminosity through
LLya = NLya hna, where hna is the Lyα photon energy, and
defineLion =Nionhva, such thatxion =NLya/Nion =LLya/Lion.
Absolute uncertainties on the Haintensity map are less than 10% (Finkbeiner 2003), while Planck (2011) reports an uncertainty of ∼2% for the Planck 353 Ghz channel measurements. However, total errors for the values reported in Table 1 are also dependent on the determination of the background level, as well as the adopted values for Orion OB1 (L andLion). We estimate a 10% uncertainty on the values of LIR,x,LLya, andxion, denoted in Table1. The error on the dust temperatureTd measured from thePlanckR1.20 dust model is of order of 3% within bright regions of the sky(Abergel 2013) such as the OMC and Barnardʼs Loop apertures, whereas the error is somewhat higher (8%)in regions that contain diffuse emission such as the Orion-Eridanus superbubble aperture.
The calculated luminosities, LIR and LLya, are denoted in
Table1. Table 1shows that half of the total amount of stellar radiation of Orion OB1 is trapped in the superbubble and reradiated in the IR,x∼0.5. The molecular clouds account for about 35% of the total IR emission of the superbubble; the contribution from Barnardʼs Loop is negligible. In contrast,xion of the OMC (0.14) and Barnardʼs Loop (0.17) are roughly similar, which is because the Orion Nebula and IC 434 emission nebula are currently breaking out of the molecular clouds (Section 3.3) and are contained within the OMC aperture. Eventually, all ionizing photons are absorbed within the superbubble aperture (xion ∼ 1). This implies that, on average, Orion OB1 can provide the necessary ionizing power to illuminate the Hα structures detected in Figure 1(c), including the Hα filaments that run along the outer edge of the superbubble aperture. Nonetheless, it is possible that individual small-scale structures may still be too bright given their size and distance from Orion OB1 (Pon et al. 2014a). Note that some of these filaments lie outside of what has previously been thought to be the edges of the Orion–Eridanus superbubble (Reynolds & Ogden 1979; Heiles et al. 1999; Bally2008; Pon et al.2014b). The dust temperatures measured inside the superbubble aperture and Barnardʼs Loop are similar to that observed for the entire diffuse sky by Planck (see
discussion in Section 3.1.2). Inside the OMC, this value is somewhat lower, which is what is expected for dense regions (Planck Collaboration et al.2014a).
3.2.2. Tracing the Superbubble Structure through Dust and Gas
To investigate the gas and dust content in specific regions throughout the Orion–Eridanus region, we use apertures depicted in Figure1 that are defined such that the majority of Hα and far-IR emission from the regions is enclosed (for example, the stratified emission from the limb-brightened emission of the superbubble wall; Figure 2(d)), while a low background level is ensured through comparison with the Planckand LAB maps(the Hαemission does not show a high background in general). As the diffuse background emission varies significantly over the entire Orion–Eridanus region, here we use local background values to properly measure the luminosities contained in the apertures scattered over the Orion–Eridanus region. For the apertures at b > −30°, we define a background at(l,b) = (233.2,−28.6)within a circle of 0◦. 4 radius. For the apertures at b < −30°, we define a background at(l,b) = (221.9,−49.5). Region 5 is an exception to this rule, as the previously defined background levels were not representative of the local value because of its location among high-latitute clouds. For region 5, (l,b) = (176.3,
−15.0)was chosen.
Lyα photons will be resonantly scattered many times in the HII region because of its large line cross section, but they eventually be absorbed by dust, contributing to the heating of the dust. The ratio of heating rate by stellar photons,GUV, to
Lyα photons,GLya, can be written as(Tielens2005)
a n Q L r n h
¯
4 . (1)
UV Ly 2 d abs 2 2 B p
p a n
G
G a = a
Hereπa2andnd are the geometrical cross section and number
density of the grains, respectively,Q¯absis the average radiation
absorption efficiency of the dust,L is the total luminosity of Orion OB1, ris the distance to the source, and n is the hydrogen number density of the gas. Assuming equilibrium between photoionization and recombination, for a shell surrounding an empty cavity we have fionNion = 4πr2n2aB
Δr, where fion is the fraction of incident ionizing photons available that are absorbed by the gas locally. Then, Equation(1)reduces to
a n Q r f
L
N h f
L N h ¯ , (2) UV Ly 2 d abs ion ion d ion ion p n t n G G = D æ è çç çç ö ø ÷÷÷ ÷= æ è çç çç ö ø ÷÷÷ ÷
a a a
where td is the(radial)absorption optical depth of the shell.
With L = 1.7 × 10⁶ L and Nion = 2.7 × 1049photons s−1
(Section 3.2.1), we have (L/Nion hna)» 15 for Orion OB1,
and therefore the ratioGUV GLyaequals unity fortd/fion»0.07.
We can make a priori estimates of fionfor the regions defined in Figure1. For Barnardʼs Loop, we have measured an average
ion
pass through the half sphere encompassing Barnardʼs Loop. Hence, we estimate that fion is in the range∼0.33–0.50 for the Barnardʼs Loop apertures BLbot and BLtop. The fact that
Barnardʼs Loop is optically thin for the ionizingflux of Orion OB1 can also be inferred from the morphological appearance of the cometary clouds L1617 and L1622, which are located behind Barnardʼs Loop as measured from the Orion OB association and have sharp I-fronts on their sides facing the Belt stars(Bally et al.2009). We note that the internal structure of Barnardʼs Loop may be more complex than that of a homogeneously distributed half-sphere assumed here. A patchy structure containing optically thick clumps(fion∼ 1)and holes through which the photons would leak unhindered(fion ∼ 0) could, in principle, lead, on average, to an fion of order 0.33–0.50. However, Barnardʼs Loop, similar to region 1 and region 6, is not associated with HI. The remaining regions are associated with neutral hydrogen, where fionwill be of order∼1 because of the small mean free path of ionizing photons through HI (Tielens2005).
We measure both LIR andLLyawithin the apertures shown
in Figure1and compare these measurements with luminosities from Orion OB1. The structures contained in each defined aperture will subtend a solid angle Ωas measured from Orion OB1. Now, any ionizing photon that is absorbed by hydrogen and converted to Lyαwill eventually contribute to the heating of the dust, andthereforethe total IR luminosity that emanates from each region can be written as
LIR=LUV+LLya=tdLWUV+fionNionhnaWLya, (3)
whereLUVis the dust luminosity provided by direct absorption
of stellar photons. In the classical picture of an expanding superbubble, a dense, neutral shell will wrap around the 104K region created by the reverse shock traced by bright Hα emission(Weaver et al.1977). Therefore, we can assume that the IR and Hα trace structures that measure the same solid
angle with respect to Orion OB1, WUV =WLya, and we can
write
(
)
(
L L)
L L f
N h
L , (4)
IR
Ly ion
d
ion
ion
t n
= +æ è çç çç
ö ø ÷÷÷ ÷
a
a
which describes the ratio between the amount of energy that is captured by the dust and reemitted in the IRand the amount of energy that is captured by the gas and converted to Lyα.
Our results are shown in Figure3. All studied regions show LIR >LLya (Figure 3(a)), which reveals that a (substantial)
amount of stellar radiation is directly absorbed by the dust. Here we note that LIR = 2LLya when GUV = GLya (see
Equation(3)). An interesting trend can be seen from Figure3
(a). Regions 2–5, positioned on filamentary structures seen in gas and dust along the outside of the superbubble aperture depicted in Figure1, reveal significantly higher fractions oftd/
fioncompared to the regions located in Barnardʼs Loop(BLbot,
BLtop). This implies that stellar photons, provided by Orion
OB1(Section 3.2.1), are more efficiently absorbed in regions 2–5 compared to those in Barnardʼs Loop. In other words, the dust optical depth for stellar photons associated with Barnardʼs Loop is very small. In Figure3(b), we rewrite Equation(4)for
d
the λ Ori bubble detected in Hα (Figure 4) reveals that the champagne phase, if present, may not have fully developed (Section 3.3.3), andthereforewe will assume that the λ Ori HIIregion is still ionizationbounded.
For the BL apertures, we plot the results fortd versusdproj
assuming fion =0.5(Section 3.2.2). For regions 1 and 6, the absence of a clear neutral HI filament prohibited us from predicting fion, and only an upper limit to td is given. The
results plotted in Figure3(b), albeit suffering from low-number statistics, indicate a trend wheretd rises with increasingdproj.
From Figure3, it becomes apparent that dust associated with Barnardʼs loop is not able to capture all of the radiation emitted by the Orion OB1 association. In this context, the bright Hα filament to the southeast that surrounds Barnardʼs Loop, from region 1 up to the Galactic plane (Figure 1), is lit up by ionizing photons breaking through Barnardʼs Loop. A straight line from the flux-weighted center of the superbubble (Figure 1), through Barnardʼs Loop to the outer filament in region 1, reveals aflux ratio ofFBL/Freg.1∼ 5, whereFBL and
Freg.1are the measured peak Hα fluxes in Barnardʼs Loop and
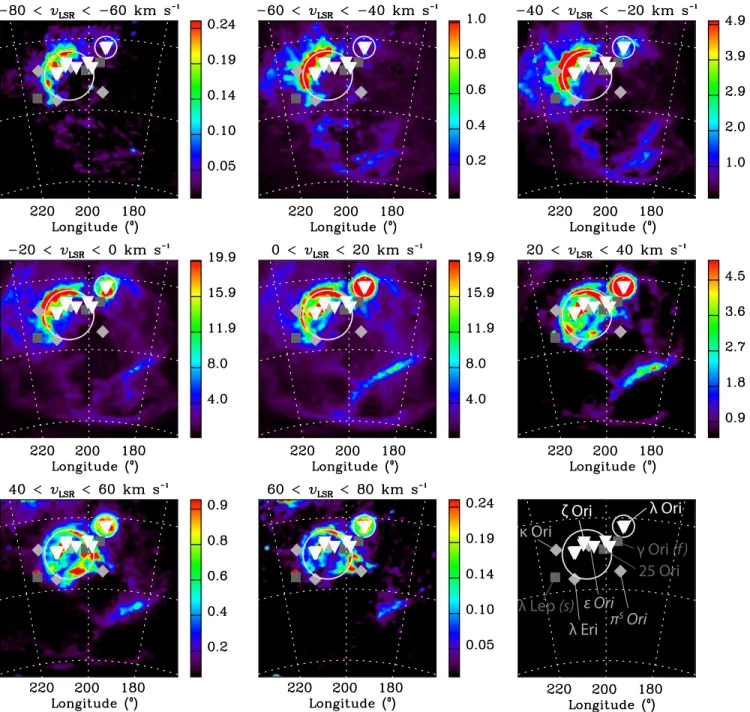
Figure 4.WHAM Hαobservations of the Orion–Eridanus superbubble. Shown are color-coded intensity maps(in units of Rayleigh)integrated over a velocity range invLSRthat is indicated on top of each panel. Note the different scaling of each individual panel. Overplotted are lines of sight from absorption-line studies(Cowie & York1978; Cowie et al.1979; Huang et al.1995; Welty et al.2002)that showbothhigh-velocity and intermediate-velocity gas(inverted triangles), lines of sight that showonlyintermediate-velocity gas(diamonds), and lines of sight that do not show a clear detection of high-velocity or intermediate-velocity gas(squares). The classes are plotted in different gray scalings to make them discernible, and we have explicitely labeled some of the stars in the lower right panel for orientation. The starsp5Ori andϵOri are denoted in italics as observations only covered velocities of v 60
LSR <
∣ ∣ km s−1and∣vLSR∣<100km s−1, respectively(Cowie et al.1979).
the outerfilament in region 1, respectively. At a distance ratio of dBL/dreg.1∼ 2.5, this is consistent with both the structures
absorbing a similar amount of ionizing photons, confirming fion ∼0.5 for the Barnardʼs Loop apertures, as was assumed in our derivations oftd above.
As a sanity check to our methodology, we also plot in Figure3the results for region 6(corresponding to the southern end of the Eri A filament), which reveals lowtd compared to
the other Eridanus filaments. However, the association of the Eridanus A filament with the superbubble is still controversial and is discussed thoroughly in Pon et al. (2014a). For completeness, we show the results for apertures located on the G203-37 and GS204-31 clouds (regions 7 and 8), which are thought to be inside and at the nearside of the Orion– Eridanus superbubble (Snowden et al. 1995). The clouds are highly opaque to 0.25 keV radiation with intervening hydrogen column densities of ∼8 × 1020cm2 (Snowden et al. 1995), translating to an optical depth at UV wavelength of tUV ∼0.8
using the relations given in Section 3.1.1, in rough agreement with our measurements shown in Figure3.
With fion =0.5 for the Barnardʼs Loop apertures, the dust optical depth as measured from the IR(td=0.06 andtd=0.08
for BLtop andBLbot, respectively; Figures3(a)and (b))is in
agreement with a homogeneous shell containing dust similar to that seen in the diffuse ISM(tUV=0.07; Section3.1). Finally,
we note that while Lyαcontributes about 25%–50% of the total energy absorbed by dust in Barnardʼs Loop(Figure3(a)), this will have little effect on the dust temperature(Section3.1.2)as Td only weakly depends on the heating rate. In particular,Tdµ
(GUV+ GLya)1 6for silicate grains(Tielens2005).
3.3. Expanding Shells within the Orion–Eridanus Region
3.3.1. High- and Intermediate-velocity Gas
The presence of HV absorption features of ionized gas between −120 km s−1 vLSR −80 km s−1 was detected in
multiple lines of sight toward Orion(Cowie et al.1979; Welty et al. 2002). In addition, IV features were detected between
−80 km s−1vLSR−20 km s−1(Cowie & York1978; Cowie
et al. 1979; Huang et al. 1995; Welty et al. 2002). Both components show similar depletions, ion ratios, and physical conditions, albeit the IV gas contains column densities that exceed that of the HV gas by a factor of 3 (e.g., Welty et al. 2002). The HV gas, dubbed by Cowie et al. (1979) as “Orionʼs Cloak,”has an angular diameter of at least15and is ascribed to a recent SN that, from its dynamical expansion scale, should have occurred some 3 × 10⁵yrago.
Figure 4 shows Hα velocity maps from the WHAM Hα spectral survey (Haffner et al. 2003) of the Orion–Eridanus superbubble, covering the velocity space between −80 km s−1
vLSR +80 km s−1. Overplotted are sightlines from
absorption-line studies (Cowie & York 1978; Cowie et al. 1979; Huang et al. 1995; Welty et al. 2002). The HV gas and IV gas tracestructures around Barnardʼs Loop and the
λ Ori ring that extend outside of the traditional limits of the Orion–Eridanus superbubble(Reynolds & Ogden1979; Heiles et al.1999; Bally2008; Pon et al.2014b), as demonstrated by the sightlines of κ Ori, λ Ori, and λ Eri. While it must be recognized that the distribution of the gases is somewhat patchy (Cowie et al.1979), it is clear that the IV gas and HV gas trace two distinct components. Moreover, the HV gas seems to be
confined to a more limited area compared to the IV gas, as reflected by the sightlines that show onlythe IV gas.
We note upfront that electron temperatures within Barnardʼs Loop andλOri are determined at∼6000–7500 K(Reich1978; Heiles et al. 2000; Madsen et al. 2006; O’Dell et al. 2011), which excludes that the HV gas originates from HV wings of a thermal Gaussian line profile(the thermal broadening can be estimated with 2kT mH∼10 km s−1, wherekis Boltzmannʼs
constant andmHis the mass of a hydrogen atom). The velocity
information of the Eridanusfilaments is discussed in Pon et al. (2014a). Of particular interest here are the encircled regions toward the east of the superbubble, covering the Barnardʼs Loop region and the λ Ori region, as well as smaller-scale bubbles.
3.3.2. Barnardʼs Loop Bubble
The intensity peak of Barnardʼs Loop lies between
−20 km s−1 vLSR +20 km s−1, but the structure is visible
throughout the entire velocity space covered by the WHAM survey. Herewe reveal the presence of an ionized filament, visible only at positive velocities vLSR > +20 km s−1. This
filament appears to form a complete bubble structure together with the bright crescent of Barnardʼs Loop, centered on (l, b) = (193,−20)with radius 14°. The lines of sight covered by the absorption survey of Cowie et al.(1979)indicate that the HV gas originates from the encircled Hα bubble structure, or the “Barnardʼs Loop Bubble” (Figure 4), suggesting a connection between both components. Cowie et al. (1979)
estimated the size of Orionʼs Cloak at a minimum of 15°that matches the size of the Barnardʼs Loop bubble. Thus, the Barnardʼs Loop bubble may well be part of the supernova remnant(SNR)associated with Orionʼs Cloak.
The most pronounced radial velocity effects are expected to originate from the center of an expanding bubble. For the HV gas, these velocities lie outside of the velocity range covered by the WHAM survey(−80 km s−1vLSR 80 km s−1; Haffner
et al.2003), rendering WHAM unable to pick up the HV gas detected byCopernicus(Cowie et al.1979)andHubble Space Telescope (Welty et al. 2002), although it is questionable whether WHAM would be able to pick up the low surface brightness of the HV gas expected in Hα(∼3 × 10⁻³Rayleigh; Cowie et al.1979). The OMCs are roughly centered onvLSR
= 10 km s−1 in velocity space (Wilson et al. 2005); if we assume a systemic velocity toward the Orion region of vLSR
=10 km s−1and connect the HV gas with the expansion of the Barnardʼs Loop bubble, we estimate its expansion velocity at vexp =100 km s−1. However, it is not clear how much of the
mass within the Barnardʼs Loop bubble (Section 4.3.1) is associated with this expansion velocity. The coverage of sightlines of the Orion–Eridanus region is limited, and the HV gas could in principle trace small, HV components related to the Barnardʼs Loop bubble, rather than tracing the bulk expansion of the bubble itself. Here we implicitly assume that the bulk of the gas in the expanding shell is expanding at the adopted expansion velocity. The preshock densities for the HV gas towardζOri(n0 =3 × 10⁻³cm−3; Welty et al.2002)then
3.3.3.λOri Bubble
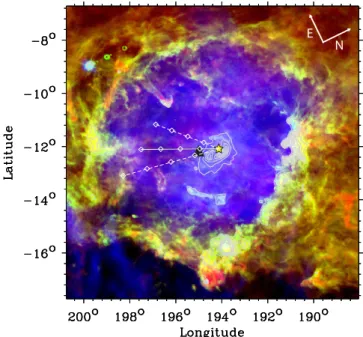
The circular-symmetric HII region surrounding λ Ori has been known for a long time. Through a study of the star formation history of theλOri region, Dolan & Mathieu(1999)
hypothesized that about 1 Myr ago, an SN disrupted the parent molecular cloud and created the giant HIIregion seen to date, which is maintained by the remaining population of massive stars in the region. The expansion velocity of the HIIregion is traced by observations of the dense molecular shell surrounding the ionized gasand is estimated atvexp=16.5 km s−1expanding
from the point (l, b) = (195.8, −12.1) centered at vLSR
=3.8 km s−1in velocity space(Lang & Masheder1998). The main ionizing star λ Ori lies right at the (projected) heart of the bubble, which seems inconsistent with its proper motion (ma cosδ = −0.34 ± 0.60 mas and md = −2.94 ± 0.33 mas;van Leeuwen 2007) with respect to the dense, molecular shell (Maddalena & Morris 1987; Lang & Masheder 1998). We calculate the LSR space velocity of λ Ori following the method described in Cox et al.(2012), using its proper motion(van Leeuwen2007)andradial velocity(vrad
= 30.1 km s−1; Gontcharov 2006), while correcting for the solar motion using parameters from Coşkunoǧlu et al.(2011). We adopt a distance of 450 pc to the star (Dolan & Mathieu 2001). The calculated space motion of λOri is vrad
= 18.2 km s−1 with a position angle of 330° (from north -toeast)inclined by 55°in the plane of the sky. The trajectory is overplotted in Figure 5and reveals that it is unlikely that its current motion has been imparted at birth, since λOri would have then originated at the boundary between the molecular and ionized gas (the expected age ofλOri is ∼3–5 Myr; see Hernández et al. 2010, and references therein). However, its motion and distance from the center of expansion (Figure 5)
are consistent with the SN hypothesis that would have launched
λOri on its current trajectory about 1 Myr ago.
We recognize the arc-shaped mid-infrared emission aroundλ Ori, which is the telltale signature of a dust wave, created by the interaction of dust entrained in a champagne flow with radiation pressure from the star, which is a common phenomenoninside interstellar bubbles (Ochsendorf et al. 2014a, 2014b). Indeed, the radio continuum maps presented by Reich(1978)reveal an emission gradient within the ionized gas that is expected for a champagneflow( Tenorio-Tagle1979). The emission gradient and the location of the dust wave revealthat the interior of theλOri bubble is venting into the surrounding medium toward the southeast. However, the overall distribution of the ionized gas is still roughly spherical (Figure4); an extended emission region that would accompany a developed HIIregion champagneflow is not detected. This may indicate that the champagne phase has just commenced and the bubble is on the verge of breaking out. The implications of these observations shall be addressed in Section4.3.
The WHAM observations in Figure4 reveal that theλOri HII region lights up at positive vLSR (Figure 4), extending longwardofvLSR>80 km s−1. In addition, elevated emission
surrounding theλOri region can be seen at the other velocity extreme of WHAM, i.e., −80 km s−1 vLSR −60 km s−1,
possibly tracing the same component from Cowie et al.(1979), who detected faint HV gas features towardλOri. The FWHM of the Hαline in theλOri region is∼80 km s−1, much broader than the thermal line width(∼10 km s−1; Section3.3.1). Thus, both the HV gas and Hα suggesthigher velocities than theobserved expansion velocity of the molecular shell (vexp
= 16.5 km s−1; Lang & Masheder 1998). The discrepancy between velocities observed for the dense molecular ring and the ionized gas could indicate a fast blisterflow(see above), which can lead to large line-of-sight variations, or a recent explosive event that has accelerated the gas in the bubble interiorbut has not yet coupled to the dense molecular ring.
3.3.4. GS206-17+13 and the Orion Nebula
Besides the obvious large-scale shells that are associated with Barnardʼs Loop andλOri, we note that the Orion complex harbors shell structures on all detectable scales. Belowwe discuss the degree-sized GS206-17+13 shell (Ehlerová & Palouš 2005) and the shell surrounding the Orion Nebula (O’Dell 2001; Güdel et al.2008), but on even smaller scales there have been detections of many regions within the Orion A cloud that appear to have shell-like structures, presumably driven by HII regions from massive young stellar objects (Bally et al.1987; Heyer et al.1992). Both GS206-17+13 and the Orion Nebula emit at positivevLSR (Figure4) with large
linewidths (FWHM ∼70 km s−1) that can both be related to ionized(blister)flows as described below.
Ochsendorf & Tielens (2015) discussed the GS206-17+13 shell, which is directly adjacent to the OMC B, has dimensions of 2°× 4° (14 × 28 pc), and is approximately centered on theσ Ori star cluster. The formation of the shell is likely caused by the stellar winds of the Orion OB1b subgroup that formed the protrusion out of the OMC B. The bright HIIemission that is projected inside part of the shell(the IC 434 emission nebula) is not related to the formation or history of GS206-17+13, as this gas originates from the champagne flow driven by the ionizing flux of the σ Ori cluster that has entered the Figure 5.Three-color image of theλOri bubble. The color codes are the same
preexisting bubble cavity and is now approaching OMC B (Ochsendorf & Tielens2015). Ionization of the cloud edge sets up a pressure discontinuity between the cloud and intercloud mediumand drives a shock front into the low-density bubble, while a rarefaction wave travels into the OMC B cloud. In panel(2a)of Figure 2, the shock front is visible atrs, whereas
the rarefaction wave is located atrrw. Between the shock fronts,
a champagne flow of ionized gas is set up ( Tenorio-Tagle1979),flowing fromrrw towardrs.
The density structure of the champagne flow of the IC 434 region is wellcharacterized by an exponential density gradient (Ochsendorf & Tielens2015), reaching fromnH=35 cm−3at
the IF on the OMC B cloud surfaceto 3.5 cm−1at the location of σ Ori (r; Figure 2), where the flow reaches ∼30 km s−1 (Mach number 3 for a 104K gas), which is the typical maximum velocity reached for champagne flows ( Tenorio-Tagle 1979). Therefore, the ionized gas will not accelerate much further (also reflected by theflattening of the emission profile behindr; Figure2), and the density in theflow remains roughly similar up until the shock front, i.e., r1 3.5 cm−3. Then the preshock density r0 in which the shock front is moving can be determined through r1/2 =
0
r (Bedijn & Tenorio-Tagle 1981), from which we infer r0 = 0.4 cm−3, which is far below that observed for electron densities within evolved Galactic HII regions of similar size (50 cm−3; Paladini et al. 2012), but typical for densities observed within the Warm Ionized Medium (WIM; Tielens 2005). Moreover, the existence of the cometary clouds L1617 and L1622, which are located behind Barnardʼs Loop as measured from the Orion OB association and have sharp I-fronts on their sides facing the Belt stars(Bally et al. 2009), reveals that the ionizingflux of the Belt stars must escape the GS206-17+13 shell, from which we conclude that the shell is incomplete and the bubble has likely“burst.”Hence, we posit that the bubble interior has been emptied in its pastand its contents were channeled into the Orion–Eridanus superbubble cavity.
The Orion Nebula is a prototypical blister HIIregion created by the young stars of the Trapezium (<1Myr; Hillen-brand 1997; Bally 2008), with q1 Ori C as the dominant
ionizing source. The ionized gas is streaming from the nearside of the OMC at about 10 km s−1(O’Dell 2001)and accelerates into the surrounding medium. Recent velocity measurements ofq1Ori C reveal that the star may be moving away from the OMC at a velocity of 13 km s−1 (see O’Dell et al. 2009, and references therein), which would imply a dynamical timescale of the Orion Nebula of only 1.5 × 10⁴yr, since the star is currently located ∼0.2 pc away from the ionization front (IF). Indeed, the measured emission measure (EM)reveals that the thickness of the ionized gas layer is only 0.13 pc (Wen & O’Dell 1995) assuming a constant density, which is known to be∼6 × 103cm−3at the IF(O’Dell 2001). X-ray emission from the ∼106K gas of the shocked stellar wind of θOri C(Güdel et al.2008)has been detected in the Extended Orion Nebula(EON)and confirms the leakage of the (hot) gas toward the southwest, with the Orion–Eridanus superbubble as the most likely outlet of the flow of material.
4. DISCUSSION
Cowie et al. (1979) interpreted neutral absorption lines at vLSR
∣ ∣20 km s−1toward stars in Orion as a thick, dense shell of swept-up material, partially ionized on the inside by the
Orion OB association. This ionized component would be evident as the IV gas and Barnardʼs Loop. However, the LV gas and IV gas are clearly separated in velocity space (Welty et al. 2002) toward ζ Ori at (l b, ) = (206.5, −16.6). This velocity separation makes it unlikely that LV and IV trace the same component of the Orion–Eridanus superbubble. In this respect, Bally(2008)already noted that the velocity dispersion of the ensemble of atomic and molecular clouds in Orion ranges over >20 km s−1. Therefore, we attribute the low-velocity neutral gas to clouds in the Orion region instead of a dense, neutral shell surrounding Orion. In addition, we have revealed the absence of a dense neutral shell surrounding Barnardʼs Loop(Section3.2)and have shown that the Loop is part of a (separate) complete shell structure that is spatially correlated with HV gas detected toward Orion (Cowie et al.1979; Welty et al.2002), as discussed in Section3.3.
The above-described results call for a thorough revisit of the structure, history, and subsequent evolution of the Orion– Eridanus superbubble. In Section 4.1.1we connect the different gas tracers to the components of the superbubbleand combine this with our observational work in order to derive a new and improved picture of the Orion–Eridanus region in Sections 4.1.2and 4.1.3. We relate our findings to the stellar content of Orion OB1 in Section4.2and present a scenario for the future evolution of the Orion–Eridanus superbubble in Section4.3.
4.1. Connecting the Dots: An Updated Picture of the Orion–Eridanus Superbubble
4.1.1. Probing the Superbubble through Absorption Lines
IV gas components are detected over a wide wavelength range, i.e., −80 km s−1 vLSR −20 km s−1 (Cowie &
York 1978; Cowie et al. 1979; Huang et al. 1995; Welty et al. 2002). However, with high spectral resolution, high signal-to-noise ratio, and broad spectral coverage data, Welty et al.(2002)were able to locate the bulk of the IV gas towardζ Ori in two single components at vlsr =−35.3 km s−1and vlsr
=−31.6 km s−1.
We link the IV gas to the outer superbubble wall through several observations. First, the bulk of the IV gas lies within the velocity space reported for the superbubble wall in HI (−40 km s−1vLSR40 km s−1; Brown et al.1995). We note
that by connecting the(ionized)IV to the superbubble wall, we assume that the outer wall toward ζ Ori is predominantly ionized along the line of sight. This might connect with our result that the eastern part of the superbubble wall does not exhibit a neutral shell, as was observed in region 1 of Figure1
and will be further discussed in Section4.1.3. Second, the total HII column density (log[N(HII)] = 18.44 cm−2) and the postshock conditions of the IV gas toward ζ Ori (n1
=0.16 cm−3,T1=9e3 K; Welty et al.2002)imply an ionized
the Orion–Eridanus superbubble described in previous works (Reynolds & Ogden1979; Heiles et al.1999; Bally2008; Pon et al.2014b).
The above results reveal that the IV gas may be linked to the outer superbubble wall, whose neutral component was defined in Brown et al.(1995). In Section3.3, we have argued that the HV gas traces the fast expansion of the Barnardʼs Loop bubble through the correlation between the sightlines that exhibit HV features and the morphology of the Barnardʼs Loop bubble from Hα(Figure4). A similar result was obtained for theλOri bubble. Both the Barnardʼs Loop bubble and theλOri bubble may be connected to recent SN explosions(Sections3.3.2and
3.3.3)that could be at the origin of the HV gas. Finally, the LV gas is attributed to the ensemble of clouds in Orion (Bally
2008). As a caveat, we note that these conclusions are based on the study of a limited amount of sightlines that may not fully reflect the complexity of the Orion region(see Section4.1.4). Nonetheless, based on the currently available data, we hypothesize that the different gas tracers trace separate components of the superbubble, summarized in Table2.
4.1.2. Extent of the Outer Superbubble Wall
The extent and connection of the IV gas to the superbubble wall (Section4.1.1)imply that the size of the Orion–Eridanus superbubble may be larger than previously thought. Indeed, Barnardʼs Loop is part of a separate closed bubble structure, suggesting that it is not associated with the large-scale expanding superbubble structure defined in earlier works (e.g., Reynolds & Ogden 1979; Heiles et al. 1999; Bally
2008; Pon et al. 2014b). Herewe argue that the outer Hα filament toward the southeast in Figure 1 offers a prime candidate for representing the outer superbubble wall.
We have concluded that Barnardʼs Loop is completely ionized by Orion OB1 and that ionizing photons are able to penetrate through. Moreover, in Sections 3.2.1 and 3.2.2, we have shown that Orion OB1 can provide the necessary ionizing photons to illuminate the Hα emission seen in Figure 1, indicating that the IF lies well outside the previously defined bounds of the Orion–Eridanus superbubble, which may be possible for superbubble walls in general (Basu et al. 1999). However, the large-scale, coherent Hαfilament to the southeast is indicative of a limb-brightened shell, rather than a mere haphazard ISM structure that happened to be illuminated by ionizing photons piercing through Barnardʼs Loop.
We note that oftenthe extent of superbubbles is traced through diffuse X-ray emission. The photoelectric cross section for 0.25 keV photons is ∼4 × 10⁻²¹cm2H−1 (Morrison & McCammon 1983). By integrating the total foreground emission from the LAB survey (Kalberla et al. 2005), i.e.,
−400<vLSR<0 km s−1(which includes the nearside of the
superbubble shell at velocities−40<vLSR<0 km s−1; Brown
et al.1995), we infer that the 0.25 keV emission is confined to foreground HI column densities of NH 3 × 1019cm−2 (the
superbubble cavity), where the optical depth for 0.25 keV X-ray photons istx0.1, while emission at 0.25 keV is absent
from regions ofNH2 × 1020cm−2(e.g., the east side of the
superbubble near the Galactic plane, the northwest side of the superbubble near the high-lattitude clouds, and the superbubble wall in the west), wheretx0.6. Thus, the clear anticorrelation
of the 0.25 (and 0.75)keV emission (Figure 1) with fore-ground HIlimits the use of this tracer for many parts of the Orion–Eridanus region, especially toward the Galactic plane.
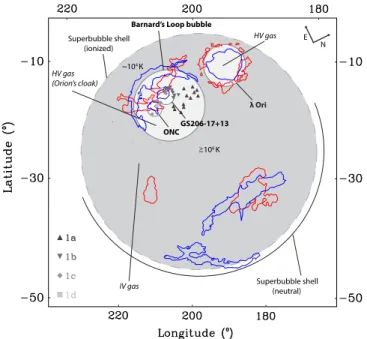
The association of Barnardʼs Loop with a closed separate bubble, the IV gas that traces a region larger than the previously defined bounds of the Orion–Eridanus superbubble, and the mere presence of the large-scale, coherent Hαfilament to the southeasthaveled us to believe that regions 1–5 (Figure3)trace the actual outer shell of the Orion–Eridanus superbubble. Projected in the interior of the outer shell are the Barnardʼs Loop bubble, theλOri bubble, and the smaller-scale expanding bubbles discussed in Section 3.3.4. This indicates that the superbubble in its entirety consists of separate structures, or successive nested shells, possibly connected to a series of SN explosions originating from Orion OB1 over the past 15 Myr(Bally2008; Sections4.1.4and4.3.2). While hot plasma could exist between the Hα filament and Barnardʼs loop, the detection of the accompanying X-ray emission is hampered because of foreground absorption. Our hypothesis sprouted from studying the energetics of gas and dust(Sections
3.2.1 and 3.2.2) and their morphological appearances ( Fig-ure 1), combined with the connections of the different gas tracers with the components of the superbubble (Table 2). In the next subsectionwe discuss the temperature of the superb-ubble interior gas, as well as the global structure of the outer wall, in order to substantiate our claim regarding the structure and extent of the Orion–Eridanus superbubble.
4.1.3. Temperature of the Superbubble Interior and Structure of the Outer Wall
The evidence discussed in Section 4.1.2 indicates that the outer superbubble wall lies outside of Barnardʼs Loop (Section 4.1.2), possibly extending toward the outer Hα filament to the southeast (Figure 1). Herewe quantify the temperature structure of the superbubble interior. First, we derive that the Barnardʼs Loop bubble is moving supersonically toward the east, from which we conclude that the temperature in this direction cannot be as high as 106K. After comparison with the cooling timescale for a gas at<106K, Table 2
The Connection between Observed Gas Velocities and Components within the Orion–Eridanus Region
Component vLSR n0 n1 log[NH] Ion. State Reference Tracing
(km s−1) (cm−3) (cm−3) (cm−2)
Low-velocity(LV) −20 to 20 L L 20.43 neutral 1 Atomic/molecular clouds in Orion Intermediate-velocity(IV) −80 to−20 L 0.16 18.44 ionized 1, 2, 3, 4 Orion–Eridanus superbubble wall
High-velocity(HV) −120 to−80 3 × 10⁻³ 0.1–0.2 17.88 ionized 1, 2 Nested shells(Barnardʼs Loop bubble,λOri)
Note.Listed quantities are(if known)observed velocity extents,vLSR; preshock densities,n0; postshock densities,n1; total hydrogen column densities,NH; ionization state;and the components of the Orion–Eridanus superbubble that is traced by the specific gas velocities. The(column)densities quoted are observed in the line of sight towardζOri.
we infer that the medium between Barnardʼs Loop and the outer Hαfilament must have cooled to∼104K, appropriate for a gas photoionized by Orion OB1. We argue that mass loading may cause temperature gradients within superbubble interiors, place ourfindings in the context of superbubble evolution, and discuss the structure of the outer wall.
The temperature structure of the superbubble interior can be estimated as follows. First, we define the isothermal sound speed, cs = (kT/μmH)1 2, where μ is the mean mass per
hydrogen nucleus(=0.61 for a fully ionized medium). Toward the west of the Barnardʼs Loop bubble, the temperature of the superbubble interior traced by the X-ray-emitting gas is estimated at Tx = 2.1 × 10⁶K (Burrows et al.1993), giving
cs = 170 km s−1. We compare this with the Barnardʼs Loop
bubble expanding at ∼100 km s−1 (Section 3.3.2), which implies that the remnant of the recent SN explosion (Sections 3.3.2 and 4.3.1) is well within the radiative expansion phase (see below). During this phase, the velocity of the SNR decelerates with time asµt-5 7(Tielens2005)if
we assume that the ambient density in which the SNR propagates is distributed homogeneously. Adopting this time– velocity relation, the adiabatic expansion phase (vexp
250 km s−1) ended just below 105yr, and the bright crescent of Barnardʼs Loop has been moving subsonically for∼0.2 Myr (in casecs =170 km s−1). When moving subsonically, sound
waves will travel ahead of the shell and the structure would dissolve and merge with the ISM within a fadeaway timescale of (McKee & Ostriker 1977; Draine2011)
E n c
1.87
10 km s Myr, (5)
fade 51
0.32 0.37 s
1 7 5
t = æ
è
ççç öø÷÷÷
-whereE51is the kinetic energy in numbers of 1051erg, andnis
the ambient hydrogen number density. The current kinetic energy of the eastern half of the Barnardʼs Loop bubble measures E51 ∼ 0.34 (Section 4.3.1), part of which may
already have been thermalized (Mac Low & McCray 1988). However, the total kinetic energy delivered by an SN explosion typically does not exceedE51∼1(Veilleux et al.2005), orE51
∼0.5 for the eastern half of the bubble. With E51 = 0.5and
parameters for the X-ray-emitting gas of the superbubble interior toward the west(Tx=2.1 × 10⁶K,nx=6 × 10⁻³cm−3;
Burrows et al. 1993; Section 4.3.1), we calculate tfade ∼
0.2 Myr, similar to the time Barnardʼs Loop has been moving subsonically in case it is moving within hot gas at a temperature exceeding 106K.
The above-derived fadeaway timescale reveals that if Barnardʼs Loop would be moving to the east in an X-ray-emitting gas such as that traced byROSATin the west part of the superbubble (Figure1), it must be long in the process of merging and dissolving with the hot gas. This actual process may cause the faintness of the Hα emission of the Barnardʼs Loop bubble toward the west (Section 3.3.2), where the superbubble interior temperature is known to be at a temperature ofTx=2.1 × 10⁶K(Burrows et al.1993; Figure1).
Clearly, this does not affect the eastern part of the Barnardʼs Loop bubble in the same way, as exemplified by the bright crescent of Barnardʼs Loop. Alternatively, there may be a density gradient within the superbubble interior that may cause the brightness difference of the Barnardʼs Loop bubble between its east and west sides. Either way, the conclusion is that the Barnardʼs Loop bubble moves supersonically toward the east,
in line with the findings of Cowie et al. (1979), who argued that the HV gas(associated with the nearside of the Barnardʼs Loop bubble; Section 3.3.2) traces a radiative shock. Conse-quently, the interior superbubble temperature toward the east cannot be at106K, as is observed for the X-ray-emitting gas toward the west.
Temperature differences within a superbubble interior can originate from thermal conduction and evaporation of the swept-up superbubble shell. This mechanism may cool the interior of the superbubble by increasing the interior density (Weaver et al. 1977; Mac Low & McCray 1988) such that radiative losses become important. Champagne flows and photoablation of molecular clouds enclosed in the superbubble can inject mass into the hot plasma, further lowering the temperature compared to that predicted by idealized models(a full discussion on the mass-loading mechanisms is deferred to Section 4.3). Gas below temperatures of 106K cools rapidly. At an interior density of nx = 6 × 10⁻³cm−3 (Burrows
et al.1993), the cooling timescale for a gas at 105K equalstcool
∼kT nL( )T ∼105yr, whereL( )T ∼ 5 × 10⁻²²erg cm3s−1is the average value of the cooling function for gas at temperatures 104KT106K(Dalgarno & McCray1972). Massloading of the interior will shorten the cooling timescale. The detection of NVgas (Welty et al. 2002) toward ζ Ori traces ∼105K gas and confirms the presence of a thermally conductive layer (Chu 2008), providing information on the temperature structure of the superbubble wall and the interior temperature, but it is unclear whether this conductive layer traces the outer superbubble wallor the interior shell associated with the Barnardʼs Loop bubble. Furthermore, it is uncertain whether this layer extends toward the outer Hαfilament given the lack of coverage of absorption-line studies in this region (Figure4). In any case, the cooling timescale is short compared to that of the estimated age of the superbubble(8 Myr; Brown et al.1994)and the SN rate in Orion OB1(1–1.5 Myr−1; Bally
2008; Section4.3.2)that may reheat the interior gas(see below and Section4.3). Consequently, if the temperature drops below 106K, the medium between Barnardʼs Loop and the outer filament will settle at a temperature of ∼104K, as it is kept photoionized by Orion OB1 by photons piercing through Barnardʼs Loop (Section 3.2.2). Depending on the internal density, the medium between Barnardʼs Loop and the outer filament may not be in pressure equilibrium with the( higher-density)outer Hα filament.
timescale (∼105yr) is shorter than the pressure timescale or sound-crossing time. Currently, the distance between Barnardʼs Loop and the outer Hαfilament is roughly∼100 pc, such that the pressure timescale can be anywhere up to ∼10 Myr for a 104K medium, depending on the exact moment the region cooled toward this temperature. However, the medium between Barnardʼs Loop and the outerfilament must have cooled within the time between successive expanding shells(regulated by the SN rate,1–1.5 Myr−1; Bally2008). Thus, it may well be that the pressure inside the interior cannot adjust rapidly enough to the change in temperature and, in case no mass loading occurs, it can reach a lower pressure compared to the ambient galactic medium. In the case of an underpressurized interior, the expansion of the superbubble wall may halt and even reverse its movement if the pressure difference between the interior and the ambient medium is strong enough.
Given that the medium between Barnardʼs Loop and the outer Hαfilament is at 104K and we are not able to constrain its density, one may question whether this medium in fact represents the WIM or the Warm Neutral Medium (WNM; Tielens 2005). In this case, the outer Hα filament is not the superbubble wall, but merely an ISM feature illuminated by photons escaping from Barnardʼs Loop. However, we have revealed that Barnardʼs Loop is part of a separate closed structure (Section 3.3.2), and we have argued that the superbubble wall extends beyond Barnardʼs Loop (addressed in Sections 4.1.1 and 4.1.2). Surely, if one accepts that Barnardʼs Loop is expanding at 100 km s−1 and represents an SNR of age 0.3 Myr(Sections3.3.2and4.3.1), it may not be surprising that the superbubble wall lies further outwardas measured from Orion OB1, given that star formation has occurred over 15 Myr in Orion and that 10–20 SNe have gone off in its past(Bally2008). Herewe argue that successive SN explosions may lead to the appearance of successive shells. In this scenario, the large-scale, coherent Hα filament to the southeast represents a prime candidate to trace the actual outer superbubble wall. We defer a further discussion on the idea of successive shells and the evolution of the outer superbubble wall to Section 4.3.2.
We note that the outer Hα filament (Figure 1) does not contain a neutral shell that is expected for a sweeping superbubble wall (Figures 2 and 3). The lack of a neutral shell may simply suggest that the swept-up ISM did not contain enough material to fully absorb the ionizing photons from Orion OB1. Alternatively, the east side of the superbubble, which is racing up the density ramp toward the Galactic plane, may not be moving supersonically anymore and has changed character from a shock wave to a sound wave, rendering it unable to sweep up additional mass. Using Equation (5) and E51 ∼ 10 (the total kinetic energy exerted byOrion OB1;
Brown et al.1995; Bally2008), we calculate for the east side of the bubble expanding toward the WNM of the Galactic plane (n ∼ 0.5 cm−3,cs ∼ 10 km s−1)tfade 4 Myr, well below the
estimated age of the superbubble(8 Myr; Brown et al.1994). Thus, we may be observing the east side of the superbubble as it is in the process of dissolving, already having lost its neutral shell and currently being completely ionized before it merges with the local material of the ISM. Equation(5)does not apply to the west side of the superbubble as its expansion velocity (traced through HI, ∼40 kms-1; Brown et al.1995) implies that it moves supersonically through the WNM/WIM. How-ever, for the ionized east side of the superbubble the expansion
velocity is not constrained, and the question whether or not it is moving supersonically remains unanswered.
4.1.4. Summary: The Structure of the Orion–Eridanus Superbubble
(Section 4.1.3). The expansion of this outer Hα filament may not be pressuredriven anymore. While this is an inevitable outcome during late stages of superbubbles and SNRs (Tielens 2005), the interior pressure drop may be accelerated through the effects of mass loading and radiative energy losses (Section 4.3). The observations (Figure 1) indicate that the outer superbubble wall is surrounded by a shell of HI toward the west, whereas it may be completely ionized toward the east (Section4.1.3).
We stress that the association of gas velocities with components in the superbubble (Table2)islargely based on the analysis of a dozen sightlines throughout the Orion side of the superbubble (Figure4). It is not clear how much mass is associated with these velocities (Section 4.3.1). Moreover, some of the gas tracers are not seen in particular lines of sight. This may be because we are tracing foreground stars, such as the sightline towardγOri located at 77 pc(van Leeuwen2007), which could provide a constraint to the elongation of the bubble toward the Local Bubble (e.g., Bally2008; Pon et al.
2014b), or incomplete spectral coverage (Cowie et al.1979). Alternatively, the distribution of the gas components might be patchy(Cowie et al.1979). Surely, the connections laid out in Table 2 may be oversimplified, as the Orion region is highly complex, containing dozens of filamentary clouds, and must bear the marks of multiple SNRs(Bally2008)that are breaking out of a region that contains a lot of substructure. Further observations are needed to firmly constrain the extent of the distinct gas components in order to derive the detailed structure of the Orion–Eridanus superbubbleand to recognize the existence of conductive layers that would provide more insight in the temperature distribution throughout the superbubble interior.
The observations of the gas and dust have revealed that Orion OB1 can be the source of ionization of the Hαfilaments encompassed within the entire region shown in Figure 1
(Section 3.2). We have connected the IV gas with the outer superbubble wall. We note that the preshock density of the IV is not known. However, given a postshock density of 0.16 cm−3 (Welty et al.2002)and a shock velocity of 40 km s−1(Brown et al.1995), a shock moving through the WNM(T=8000 K, cs ∼ 10 km−1) would have a preshock density of order
∼0.01 cm−3 (J-type shocks increase densities by 2;
Tie-lens 2005), which is somewhat low for the WNM in the Galactic plane. Higher densities for the Orion–Eridanus shell of 1–5 cm−3are quoted toward the Eridanusfilaments in the west (e.g., Reynolds & Ogden1979), indicating that the expansion occurs somewhat anisotropically, which can also be inferred by appreciating the complex morphology of the superbubble. In any case, the shock velocity of the IV gas (∼40 km s−1)is not fast enough to ionize hydrogen;therefore, the Eridanus filaments (and the IV gas) are photoionized by Orion OB1, which was already noted by Reynolds & Ogden (1979) and Welty et al.(2002). We note that Pon et al.(2014b)explored other mechanisms of ionizationbut concluded that Orion OB1 most likely causes the observed ionization state of the IV gas. When the spherical geometry from Figure6is adopted for the outer superbubble wall, and assuming a diameter of the supershell of 45° (equivalent to a radius of 160 pc) with expansion velocity of ∼40 km s−1, the dynamical age of the shell is ∼4 Myr, consistent with the age of the Orion OB1a subgroup, minus a main-sequence lifetime of 3–5 Myr for its most massive stars (Bally 2008). Naturally, stellar winds
during thefirst few Myr of the lifetime of the OB association may have contributed to the formation and expansion of the superbubble wall as well.
In conclusion, considering that star formation had been occurring for 10–15 Myr in Orion OB1 and the presence of at least four distinct subgroups (Blaauw 1964; Bally 2008), it may not be surprising that the Orion–Eridanus superbubble consists of a set of nested shells. Our results connect well with recent work from Schlafly et al. (2015), who show that the OMCs are in turn part of an ancient ring of dust. Possibly, the ring represents the remainder of a large bubble that pushed the OMCs out of the Galactic plane toward their current location. Still, the hierarchy of bubbles does not end at the possible progenitor of the Orion–Eridanus superbubble defined by Schlafly et al. (2015). Indeed, it has been argued that the Gouldʼs Belt that includes all nearby OB associations is associated with a large expanding ancient(30–60 Myr) super-shell known as Lindbladʼs ring(see Bally2008, and references therein). The Gouldʼs Belt of stars and OB associations may therefore represent sequential star formation when the Lind-bladʼs ring cooled and collapsed to form dark clouds, out of which the evolution of the Orion region commenced.
4.2. The Nested Shells and Their Relation to Orion OB1 The recent discovery that the OMCs may be part of an ancient ring of dust(Schlafly et al.2015), the uncovering of an extended foreground population toward Orion A (Alves & Bouy 2012; Bouy et al. 2014), and the mysterious origin of some of the brightest stars in Orion(αOri, βOri, andκOri; Bally 2008) illustratethat our current understanding of the Orion region is still limited. Bally (2008) proposed that the bright stars may be part of a foreground group about 150 pc in front of Orion OB1and together constitute the three most massive members of this population still present to date. Alternatively, some of the massive stars from Orion OB1 may have been ejected as runaways (space velocities in excess of >40 km s−1) in the direction of the Local Bubble before exploding as SNe: up to 25% of the OB stars end up as runaways (Zinnecker & Yorke 2007). Such stars could be linked to the odd geometry of the Orion–Eridanus superbubble (Pon et al.2014b), which appears to be elongated toward the Local Bubble.