Systemic HIV and SIV latency reversal via
non-canonical NF-κB signalling in vivo
Christopher C. Nixon1,2,3,20, Maud Mavigner4,20, Gavin C. Sampey2,3,5,6, Alyssa D. Brooks4, Rae Ann Spagnuolo1,2,3, David M. Irlbeck6,7, Cameron Mattingly4, Phong T. Ho1,2,3, Nils Schoof4, Corinne G. Cammon1,2,3, Greg K. Tharp8, Matthew Kanke9,10, Zhang Wang11,
Rachel A. Cleary1,2,3, Amit A. Upadhyay8, Chandrav De1,2,3, Saintedym R. Wills2,3,5,6, Shane D. Falcinelli2,3,5,12, Cristin Galardi6,7, Hasse Walum8, Nathaniel J. Schramm1,2,3, Jennifer Deutsch11, Jeffrey D. Lifson13, Christine M. Fennessey13, Brandon F. Keele13, Sherrie Jean8, Sean Maguire11, Baolin Liao1,2,3,14, Edward P. Browne2,3,5, Robert G. Ferris6,7, Jessica H. Brehm6,7, David Favre6,11, Thomas H. Vanderford8, Steven E. Bosinger8,15, Corbin D. Jones9,10, Jean-Pierre Routy16,17, Nancie M. Archin2,3,5, David M. Margolis2,3,5,6,12,18, Angela Wahl1,2,3, Richard M. Dunham2,3,5,6,7,21*, Guido Silvestri8,15, Ann Chahroudi4,8,19,21* & J. Victor Garcia1,2,3,21*
Long-lasting, latently infected resting CD4+ T cells are the greatest obstacle to
obtaining a cure for HIV infection, as these cells can persist despite decades of treatment with antiretroviral therapy (ART). Estimates indicate that more than 70 years of continuous, fully suppressive ART are needed to eliminate the HIV reservoir1. Alternatively, induction of HIV from its latent state could accelerate the
decrease in the reservoir, thus reducing the time to eradication. Previous attempts to reactivate latent HIV in preclinical animal models and in clinical trials have measured HIV induction in the peripheral blood with minimal focus on tissue reservoirs and have had limited effect2–9. Here we show that activation of the non-canonical NF-κB
signalling pathway by AZD5582 results in the induction of HIV and SIV RNA expression in the blood and tissues of ART-suppressed bone-marrow–liver–thymus (BLT) humanized mice and rhesus macaques infected with HIV and SIV, respectively. Analysis of resting CD4+ T cells from tissues after AZD5582 treatment revealed
increased SIV RNA expression in the lymph nodes of macaques and robust induction of HIV in almost all tissues analysed in humanized mice, including the lymph nodes, thymus, bone marrow, liver and lung. This promising approach to latency reversal—in combination with appropriate tools for systemic clearance of persistent HIV
infection—greatly increases opportunities for HIV eradication.
Latently infected cells carrying an integrated replication-competent provirus that contribute to viral rebound after the interruption of ART (termed the HIV reservoir) are not detected and eliminated by the immune system or current therapeutics. Therefore, the HIV res-ervoir has been targeted by approaches to reverse latency and induce viral antigen production (that is, ‘HIV reactivation’)2–9, which renders
infected cells susceptible to virus-induced cell death or clearance by the immune system. Previous approaches to HIV reactivation have
been modestly effective and have not demonstrated reactivation of HIV in resting CD4+ T cells in tissues2–9.
HIV induction in vitro by SMAC mimetics
The lack of specificity of molecules that activate the NF-κB pathway as latency-reversal agents (LRAs) often leads to toxicities that pre-vent clinical implementation10. We tested the induction of HIV and
https://doi.org/10.1038/s41586-020-1951-3 Received: 12 April 2019
Accepted: 16 December 2019 Published online: 22 January 2020
1International Center for the Advancement of Translational Science, University of North Carolina at Chapel Hill, Chapel Hill, NC, USA. 2Division of Infectious Diseases, Department of Medicine,
University of North Carolina at Chapel Hill, Chapel Hill, NC, USA. 3Center for AIDS Research, University of North Carolina at Chapel Hill, Chapel Hill, NC, USA. 4Department of Pediatrics, Emory University School of Medicine, Atlanta, GA, USA. 5UNC HIV Cure Center, University of North Carolina at Chapel Hill, Chapel Hill, NC, USA. 6Qura Therapeutics, Chapel Hill, NC, USA. 7HIV Drug Discovery, ViiV Healthcare, Research Triangle Park, NC, USA. 8Yerkes National Primate Research Center, Emory University, Atlanta, GA, USA. 9Department of Biology, University of North Carolina at Chapel Hill, Chapel Hill, NC, USA. 10Department of Genetics, University of North Carolina at Chapel Hill, Chapel Hill, NC, USA. 11GlaxoSmithKline Research and Development, Collegeville, PA, USA. 12Department of Microbiology and Immunology, School of Medicine, University of North Carolina at Chapel Hill, Chapel Hill, NC, USA. 13AIDS and Cancer Virus Program, Frederick National Laboratory for Cancer Research, Frederick, MD, USA. 14Department of Infectious Diseases, Guangzhou Eighth People’s Hospital, Guangzhou Medical University, Guangzhou, China.
15Department of Pathology and Laboratory Medicine, Emory University School of Medicine, Atlanta, GA, USA. 16Chronic Viral Infection Service, McGill University Health Centre, Montreal,
SIV transcription in latently infected cells by the non-canonical (nc) NF-κB pathway. This pathway activates a limited number of cellular genes and a more-gradual but persistent activation of NF-κB-driven transcription than the canonical (c)NF-κB pathway11. Mimetics of the
second mitochondrial-derived activator of caspases (SMAC) activate the ncNF-κB pathway by inhibiting the cellular inhibitor of apoptosis protein 1 (cIAP1) and cIAP2. cIAP1 continually represses the ncNF-κB pathway by constitutively degrading the NF-κB-inducing kinase, thus preventing processing of p100 into p5212; this repression can be relieved
in CD4+ T cells by in vitro treatment with the SMAC mimetic AZD5582
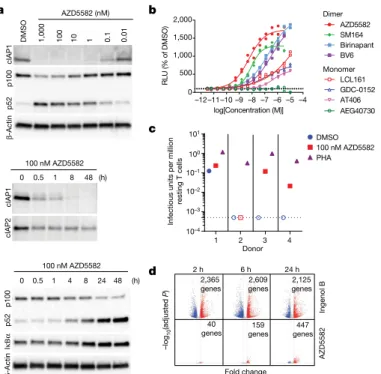
(Fig. 1a and Extended Data Fig. 1). Compared with other SMAC mimet-ics, AZD5582 had a superior capacity to reverse HIV latency in vitro13
(Fig. 1b). AZD5582 also induced replication-competent HIV expres-sion in resting CD4+ T cells from ART-suppressed HIV-infected donors
(Fig. 1c). AZD5582 induced five- to tenfold fewer genes than the protein kinase C agonist ingenol B (Fig. 1d), a cNF-κB pathway inducer and activator of several transcription factors. By specifically targeting the
ncNF-κB signalling pathway, AZD5582 has limited pleotropic effects, which may translate to fewer off-target effects14.
Latency reversal in BLT humanized mice
BLT mice were infected with HIV-1JR-CSF (Supplementary Table 1) and
sup-pressed with ART15–18 (Fig. 2a, b). Mice then received a single
intraperi-toneal injection of 3 mg kg−1 AZD5582 or vehicle. No changes in plasma
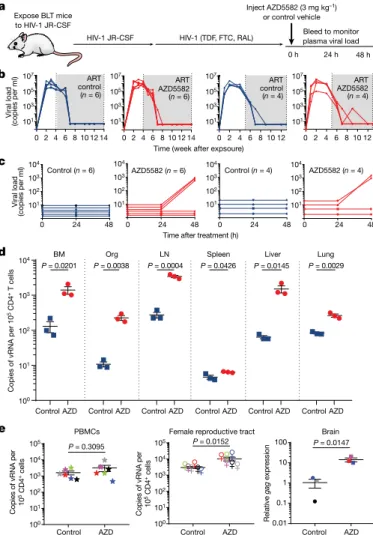
HIV RNA levels were detected in vehicle-control-treated mice at 24 or 48 h nor in AZD5582-treated mice 24 h after AZD5582 administration (Fig. 2c). However, 48 h after AZD5582 treatment increased HIV RNA expression was detected in the plasma of 3 out of 6 (50%) and 3 out of 4 (75%) mice in two independent experiments (Fig. 2c). These data demonstrate that a single dose of AZD5582 can induce HIV production, resulting in significant viraemia (up to 1,574 HIV RNA copies per ml plasma) in ART-treated BLT mice (Supplementary Table 2).
The hallmark of HIV persistence in humans is the presence of inducible HIV in resting CD4+ T cells. Therefore, resting cells from primary (bone
marrow and thymic organoid), secondary (lymph node and spleen) and effector (liver and lung) immune tissues were isolated from HIV-infected ART-suppressed BLT mice 48 h after treatment with vehicle control or AZD558217,19,20. The levels of HIV RNA in resting CD4+ T cells from
AZD5582-treated mice were 11-fold (bone marrow, P = 0.0201), 21-fold (thymic organoid, P = 0.0038), 12-fold (lymph node, P = 0.0004), 1.4-fold (spleen, P = 0.0426), 24-fold (liver, P = 0.0145) and 3.2-fold (lung, P = 0.0029) higher than controls (Fig. 2d). These results were confirmed in a second inde-pendent experiment (Extended Data Fig. 2). No notable differences in cell-associated HIV DNA were noted between mice treated with vehicle control or AZD5582 (Supplementary Table 3). These results demonstrate that AZD5582 induces systemic HIV RNA production in resting CD4+
T cells, indicative of latency reversal in this important cellular source of persistent HIV infection. We also isolated cells from the peripheral blood, female reproductive tract and brain of HIV-infected ART-suppressed BLT mice 48 h after treatment with AZD5582 or vehicle control. As too few CD4+ T cells were available for cell sorting from these compartments,
RNA was extracted from total cells and analysed for the presence of HIV RNA in each tissue. The levels of HIV RNA were significantly higher in the female reproductive tract (3.4-fold, P = 0.0152) and brain (8.7-fold, P = 0.0147) of AZD5582-treated mice compared with vehicle controls, but not in the blood (P = 0.3095) (Fig. 2e). Together, these results show that AZD5582 treatment induces systemic HIV RNA production in BLT mice.
Pharmacodynamics and safety in BLT mice
Target engagement after treatment with AZD5582 was confirmed ex vivo by the degradation of cIAP1 (proximal) and p100 (distal), targets of SMAC in the ncNF-κB pathway (Extended Data Fig. 3a). In vivo tar-get engagement was demonstrated in resting CD4+ T cells isolated
from thymus, spleen, lymph nodes, liver, lung and bone marrow of BLT mice treated with a single dose of 3 mg kg−1 AZD5582 or vehicle
control (Extended Data Fig. 3b). These results were confirmed by immunohistochemical analysis of the thymic organoid of HIV-infected ART-suppressed BLT mice. This analysis showed a marked reduction in cIAP1 expression in the thymic organoid of AZD5582-treated mice (Extended Data Fig. 3c).
To study off-target or immune-mediated toxicities of AZD5582, we measured serum chemistry, T cell activation and a panel of plasma cytokines after in vivo treatment of immunocompetent BALB/c mice. AZD5582 administration resulted in mild and transient increases in alanine aminotransferase and aspartate aminotransferase that resolved a few days after treatment. No other changes in serum chemistries were noted (Sup-plementary Table 4). In addition, no differences were noted in the levels of activated (CD38+HLA-DR+) CD4+ or CD8+ T cells in BLT mice treated with
AZD5582 or vehicle control (Supplementary Table 5) or in plasma levels of 41 human cytokines and chemokines that serve as indicators of systemic
Fold change –log 10 (adju st ed P ) Ingenol B AZD5582
2 h 6 h 24 h
159 genes 40
genes genes447
2,365
genes genes2,609 2,125genes 0 500 1,000 1,500 2,000 log[Concentration (M)] RLU
(% of DMSO
) GDC-0152 BV6 SM164 AT406 Birinapant AZD5582 LCL161 AEG40730 c
DMSO 1,000 100 10 1 0.1 0.01
cIAP1 p100 p52 β -Actin AZD5582 (nM) cIAP1 cIAP2
0 0.5 1 8 48 (h)
0 0.5 1 4 8 24 48 (h)
100 nM AZD5582
d
100 nM AZD5582
I κΒα p100 p52 β -Actin b –4 –12–11–10–9–8–7–6–5
a 10–4 10–3 10–2 10–1 100 101
Infectious units per millio
n
resting T cell
s
DMSO 100 nM AZD5582 PHA
1 2 3 4
Donor
Monomer Dimer
Fig. 1 | Efficient in vitro AZD5582 target engagement and induction of HIV transcription. a, Total CD4+ T cells were treated with a broad range of
concentrations (10 pM–1 μM) of AZD5582 overnight, and cell lysates were analysed by immunoblot, probing for cIAP1 and p100/p52 as indicated (top; representative of 10 experiments). Immunoblot analysis of isolated total CD4+
T cell lysates after treatment with 100 nM AZD5582, examining components of the cNF-κB and ncNF-κB pathways over a 48-h time course after treatment (middle and bottom; representative of three and four experiments,
respectively). b, DMSO-normalized reporter signal induced by a dose titration of a panel of mono- and bivalent SMAC mimetics in a Jurkat luciferase reporter model of HIV-1 latency with 48 h exposure. Symbols represent technical replicates from a single run and are representative of three independent experiments. Lines represent a four-parameter logistic-regression model fit. c, Infectious units per million resting CD4+ T cells induced by DMSO or 100 nM
AZD5582 were determined in a limiting dilution quantitative viral outgrowth assay. PHA, phytohaemagglutinin. d, Volcano plots summarizing mean up- and downregulated genes at 2, 6 and 24 h after treatment with ingenol B or AZD5582 compared with treatment with DMSO alone. The mean log2
-transformed fold change is shown on the x axis and log10-adjusted P values
(two-sided Wald test) are shown on the y axis. Dashed lines represent thresholds of log2-transformed fold change of 1 and adjusted P < 0.05. The data
infection (Fig. 3a and Supplementary Table 7)22,23. Suppression of SIV
viraemia below 60 copies per ml (standard assay limit of detection) was achieved in all macaques in 2–20 weeks and ART was continued for 55–67 weeks before further treatment (Fig. 3b). On the basis of phar-macokinetic and pharmacodynamic data from uninfected macaques (Extended Data Fig. 4a) as well as protocols for SMAC mimetics used in oncology, intravenous infusions of 0.1 mg kg−1 AZD5582 were
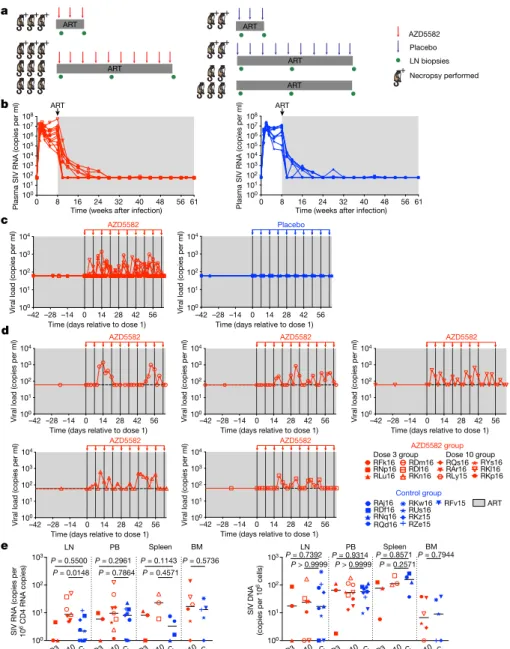
admin-istered weekly to 12 SIV-infected ART-suppressed rhesus macaques for 3 or 10 weeks (Fig. 3a). Nine SIV-infected ART-suppressed rhesus macaques served as controls (Fig. 3a). Plasma concentrations of AZD5582 measured after the first, third, sixth and tenth dose showed that drug exposures in SIV-infected ART-suppressed macaques were consistent across the treatment period and comparable to those observed in uninfected rhesus macaques (Extended Data Fig. 4b).
Latency reversal, defined as on-ART viraemia increasing from less than 60 copies per ml of plasma to more than 60 copies per ml of plasma after AZD5582 treatment, was observed as early as 96 h after the first dose and reached levels as high as 1,390 copies per ml in SIV-infected rhesus macaques (Fig. 3c, d). On-ART viraemia >60 copies per ml of plasma was observed in 5 out of 12 rhesus macaques (42%), cor-responding to 5 out of 9 rhesus macaques (55%) that received 10 doses of AZD5582 (Fig. 3c, d). Multiple instances of sustained viraemia >60 copies per ml between AZD5582 doses were observed. Out of 140 viral load measurements performed on the 5 macaques that exhibited on-ART viraemia during AZD5582 treatment, 64 were >60 copies per ml (46%); in the macaque with the greatest frequency of reactivation, this proportion was 15 out of 28 (53%). Longitudinal examination of plasma virus by single-genome sequencing analysis of the SIVmac239 env gene
in all rhesus macaques that experienced AZD5582-induced on-ART viraemia was performed at four selected time points: 2 weeks after infection (near peak viraemia), 8 weeks after infection (immediately before ART initiation), and at 2 time points separated by 26–42 days during AZD5582 treatment. Phylogenetic analyses showed several patterns of virus reactivation (Extended Data Fig. 5). In two rhesus macaques (RDl16 and RKn16), most of the reactivated virus sequences were phylogenetically closer to sequences at eight weeks after infection rather than peak viraemia and were unique, indicating that the variants produced during AZD5582 treatment originated from multiple cells that were seeded at the time of ART initiation24. In two other rhesus
macaques (RKl16 and RDm16), a large fraction of the viruses produced during AZD5582 treatment showed identical sequences, suggesting that latency reversal occurred from a single cell or a clonally expanded population of infected cells. These clones clustered with both peak and pre-ART time points and were accompanied by additional unique sequences. In one rhesus macaque (RLy15), a single virus sequence was amplified at each time point during AZD5582 treatment and these were both phylogenetically similar to sequences found before ART treat-ment. Taken together, these results indicate that AZD5582 induced virus reactivation from a diverse population of cells, some of which may be clonally expanded25,26.
We quantified cell-associated SIV RNA and SIV DNA in resting CD4+
T cells sorted from SIV-infected ART-suppressed rhesus macaques treated or not with AZD5582. Cell-associated SIV RNA levels in resting CD4+ T cells isolated from lymph nodes were significantly higher in
macaques who received ten doses of AZD5582 compared with controls (P = 0.0148) (Fig. 3e). A similar trend was observed in resting CD4+ T cells
isolated from the spleens of a subgroup of six macaques that were euthanized. Levels of cell-associated SIV DNA in resting CD4+ T cells
were similar in each compartment across groups (Fig. 3e). To further understand whether latency reversal induced by AZD5582 resulted in a perturbation of the overall level of infected CD4+ T cells, we performed
longitudinal measurements of cell-associated SIV DNA in total (rather than resting) CD4+ T cells isolated from lymph nodes and blood as
well as quantitative viral outgrowth assays using CD4+ T cells from
lymph nodes and spleen at the end of the treatment period (Extended b
c
0 24 48
Control (n = 6) AZD5582 (n = 6) Control (n = 4)
Time after treatment (h)
AZD5582 (n = 4)
d
P = 0.0145
P = 0.0201 P = 0.0038 P = 0.0004 P = 0.0426 P = 0.0029
BM Org LN Spleen Liver Lung
a Relative ga g expressio n
Expose BLT mice to HIV-1 JR-CSF
Inject AZD5582 (3 mg kg–1) or control vehicle
Bleed to monitor plasma viral load
0 h 24 h 48 h
Viral load
(copies per ml)
Time (week after expsoure)
PBMCs
Copies of vRNA per 10 5 CD4 + cell
s
Female reproductive tract Brain
P = 0.3095 P = 0.0152 P = 0.0147
HIV-1 (TDF, FTC, RAL) HIV-1 JR-CSF 101 103 105 107 101 103 105 107 101 103 105 107 101 103 105 107 ART control (n = 6)
0 2 4 6 8 10 12 14 0 2 4 6 8 10 1214 0 2 4 6 8 10 12 0 2 4 6 8 10 12
ART AZD5582 (n = 6)
ART control (n = 4)
ART AZD5582 (n = 4)
104 103 102 101 104 103 102 101 104 103 102 101 104 103 102 101 Viral load
(copies per ml)
0 24 48 0 24 48 0 24 48
100 100 101 102 103 104 105 100 101 102 103 104 105 101 102 103 104 Co
pies of vRNA per 10
5 CD
4
+ T cell
s
Control AZD Control AZD Control AZD Control AZD Control AZD Control AZD
e 0.01 0.1 1 10 100
Control AZD Control AZD Control AZD
Copies of vRNA per 10 5 CD4 + cell
s
Fig. 2 | AZD5582 induces HIV RNA expression in resting CD4+ T cells from tissues of HIV-infected ART-suppressed BLT mice. a, BLT mice were infected with HIV-1JR-CSF. After 10 weeks of ART treatment, mice received vehicle control
or AZD5582. FTC, emtricitabine; RAL, raltegravir; TDF, tenofovir disoproxil fumarate. b, HIV RNA copies per ml−1 of plasma of HIV-infected ART-treated BLT
mice before treatment with vehicle control (left; blue lines) or AZD5582 (right; red lines). Two independent experiments were performed (left, n = 6 mice per group; right, n = 4 mice per group). Grey shading, period of ART administration. c, Plasma HIV RNA levels in HIV-infected ART-suppressed mice from b treated with vehicle control or AZD5582. d, HIV viral RNA (vRNA) levels in resting CD4+
T cells isolated from the bone marrow (BM), thymic organoid (Org), lymph nodes (LN), spleen, liver and lung of control or AZD5582-treated mice (cells pooled from n = 6 mice per group for each tissue) were analysed in triplicate. Data are mean ± s.e.m. Statistical significance was determined using a two-sided Student’s t-test. e, Cell-associated HIV RNA copies in the blood (n = 6), female reproductive tract (n = 6) and brain (n = 3). PBMCs, peripheral-blood mononuclear cells. Statistical significance was determined using a two-sided Mann–Whitney test (peripheral-blood mononuclear cells and female reproductive tract) or Student’s t-test (brain). Colours indicate samples from the same mice. Data are mean ± s.e.m.
activation and inflammation21 (Supplementary Table 6). Together, these
results demonstrate that AZD5582 does not cause generalized toxicity or activation of the immune system in the BLT model.
Latency reversal in rhesus macaques
We next evaluated the latency-reversal activity of AZD5582 in 21 MamuB*08− and MamuB*17− rhesus macaques infected with
SIVmac239 and treated with a potent ART regimen comprising
Data Fig. 6a–c). Despite the high level of virus reactivation induced by AZD5582, these experiments did not reveal a consistent reduction in the total or replication-competent SIV reservoir compared with controls.
Pharmacodynamics in rhesus macaques
Pharmacological target engagement of the ncNF-κB pathway was confirmed by western blot analysis of the degradation of p100 to p52
in lymph-node mononuclear cells after in vivo exposure to AZD5582 (Extended Data Fig. 4c) and in splenocytes treated ex vivo with AZD5582 (Extended Data Fig. 4d–g). Transcriptomic profiling of CD4+ T cells
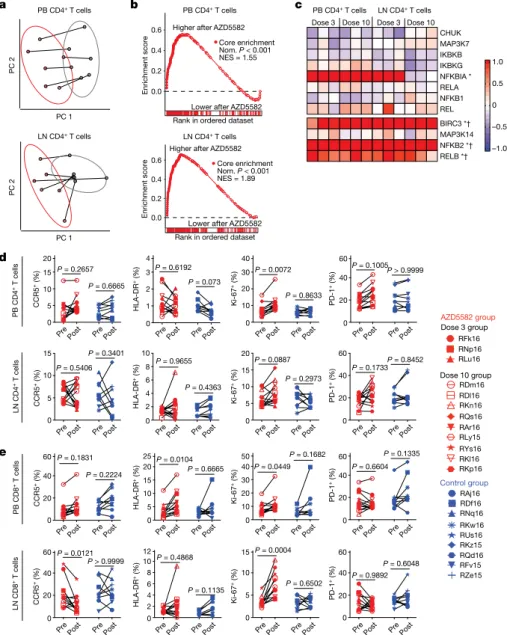
from the peripheral blood and lymph nodes isolated from AZD5582-treated rhesus macaques showed a distinct effect of AZD5582 on gene expression based on principal component (Fig. 4a) and DAVID pathway (Extended Data Fig. 7a) analyses. Enrichment of NF-κB targets after AZD5582 treatment was demonstrated by gene-set enrichment analysis
0 16 24 32 40 48 56
100 101 102 103 104 105 106 107 108 100 101 102 103 104 105 106 107 108 100 101 102 103 100 101 102 103 a b e d c
–42 –28 –14 0 14 28 42 56 –42 –28 –14 0 14 28 42 56
100 101 102 103 104 100 101 102 103 104 RDm16 RDl16 RKn16 RQs16 RAr16 RLy15 RYs16 RKl16 RKp16 RFk16 RNp16 RLu16
Dose 3 groupAZD5582 groupDose 10 group
ART RQd16 RAj16 RDf16 RNq16 Control group RFv15 RKw16 RUs16 RKz15 RZe15
D3D10 C D3D10 C D3D10 C D10 C D3 D10 C D3 D10 C D3D10 C D10 C Plasma SIV RNA (copies per ml) 8 Plasma SIV RNA (copies per ml)
ART
61 0 8 16 24 32 40 48 56 61
Time (weeks after infection) Time (weeks after infection)
AZD5582 Placebo
Viral load (copies per ml)
100 101 102 103 104
Viral load (copies per ml) 100
101 102 103 104
Viral load (copies per ml) 100
101 102 103 104
Viral load (copies per ml)
100 101 102 103 104
Viral load (copies per ml) 100
101 102 103 104
Viral load (copies per ml)
Viral load (copies per ml)
Time (days relative to dose 1)
–42 –28 –14 0 14 28 42 56
Time (days relative to dose 1)
–42 –28 –14 0 14 28 42 56
Time (days relative to dose 1)
–42 –28 –14 0 14 28 42 56
Time (days relative to dose 1)
–42 –28 –14 0 14 28 42 56
Time (days relative to dose 1)
–42 –28 –14 0 14 28 42 56
Time (days relative to dose 1) Time (days relative to dose 1)
AZD5582 AZD5582 AZD5582
AZD5582 AZD5582
SIV RNA (copies per 610
CD4 RNA copies)
SIV DNA
(copies per 10
6 cells)
LN PB Spleen BM
P = 0.5500 P = 0.0148
P = 0.2961 P = 0.7864
P = 0.5736 P = 0.1143
P = 0.4571
LN PB Spleen BM
P = 0.7392 P > 0.9999PP = 0.9314 > 0.9999
P = 0.8571 P = 0.2571
P = 0.7944 ART ART ART ART ART AZD5582 Placebo LN biopsies Necropsy performed + + + + + + + + + + + ART
Fig. 3 | AZD5582 induces SIV RNA expression in the plasma and lymph nodes of ART-suppressed SIV-infected rhesus macaques. a, Experimental design during AZD5582 treatment phase. Three rhesus macaques received three doses of AZD5582 and were euthanized 48 h after the last dose. Nine rhesus macaques received 10 doses of AZD5582 and 3 were euthanized 48 h after the last dose. The first dose of AZD5582 was administered after 55–67 weeks of ART (3-dose group, 55 weeks; 10-dose group, 55–67 weeks). Four control rhesus macaques received a weekly placebo infusion; 2 were euthanized 48 h after 3 infusions and 2 were euthanized 48 h after 10 infusions. Five control macaques received ART only. b, Plasma SIV RNA levels in the 21 SIV-infected rhesus macaques before treatment with AZD5582 (left, n = 12) and equivalent time period for controls (right, n = 9). b–d, Grey shading represents the period of ART administration. c, Plasma SIV RNA levels in ART-suppressed SIV-infected rhesus macaques during AZD5582 treatment (left, n = 12) and the equivalent
time period for controls (right, n = 9). d, Individual representation of plasma SIV RNA levels in the five rhesus macaques that experienced on-ART viraemia during AZD5582 treatment. e, Cell-associated SIV RNA (left) and SIV DNA (right) levels in resting CD4+ T cells isolated from lymph nodes, peripheral
blood (PB), spleen and bone marrow of AZD5582-treated (red) and control (blue) ART-suppressed SIV-infected rhesus macaques. Resting CD4+ T cells
were analysed from AZD5582-treated rhesus macaques 48 h after receiving 3 doses (D3; lymph nodes, peripheral blood and spleen, n = 3) or 10 doses (D10; lymph nodes, n = 7; peripheral blood, n = 9; spleen, n = 3; bone marrow, n = 6) of AZD5582. Resting CD4+ T cells were analysed from control rhesus macaques
(GSEA) (Fig. 4b; a heat map of differentially expressed gene targets of NF-κB is shown in Extended Data Fig. 7b). The hallmark ncNF-κB sig-nalling genes NFKB2 and RELB were significantly upregulated in CD4+
T cells from the peripheral blood and lymph nodes after AZD5582 treat-ment, whereas cNF-κB signalling molecules were mostly unaffected except for the inhibitor NFKBIA (Fig. 4c). The baculoviral IAP repeat-containing 3 (BIRC3) gene, which encodes cIAP2 and regulates both the cNF-κB and ncNF-κB pathways, was also significantly upregulated in CD4+ T cells from the peripheral blood and lymph nodes (Fig. 4c).
Notably, activation of ncNF-κB signalling genes was evident in rhesus macaques with and without on-ART viraemia of more than 60 copies per ml (Fig. 4c and Extended Data Fig. 7c) and GSEA showed similar changes in overall gene expression when AZD5582-treated rhesus macaques were grouped according to the presence or absence of on-ART viraemia of more than 60 copies per ml (Supplementary Table 8), suggesting that the lack of a virological response measured by the standard viral load assay was not due to compromised target engagement.
We next used an ultrasensitive assay to measure SIV RNA in plasma, comparing 2–3 baseline time points during ART in the 4 weeks before AZD5582 treatment (when plasma SIV RNA was less than 60 copies per ml in all rhesus macaques using the standard viral load assay) and 3–4 time points during AZD5582 treatment (Extended Data Fig. 8a). We found significantly higher plasma SIV RNA values during the period
of AZD5582 treatment compared with pre-treatment (Extended Data Fig. 8b, P = 0.008), with 8 out of 12 rhesus macaques demonstrating ≥2 SIV RNA measurements above the median of their baseline values. This group of eight rhesus macaques with evidence of latency rever-sal induced by AZD5582 could be segregated from the four rhesus macaques with unchanged viral loads based on two parameters: higher levels of plasma SIV RNA immediately before ART initiation and SIV DNA in peripheral CD4+ T cells before AZD5582 treatment (P = 0.004
for each) (Extended Data Fig. 8c).
Safety and immune effects in rhesus macaques
The potential for AZD5582 toxicity in SIV-infected ART-suppressed rhesus macaques was examined and transient increases in liver enzymes (aspartate aminotransferase and γ-glutamyltransferase) were observed (Extended Data Fig. 9a). Total white-blood cell counts were decreased in all rhesus macaques 48 h after the first dose of AZD5582 but returned to normal levels when measured before the second dose and over time (Extended Data Fig. 9b). After the seventh and eighth doses, one macaque experienced a reaction characterized by fever, emesis, fatigue and lack of appetite, and had elevated liver enzyme and creatinine levels and bandaemia as shown by laboratory examination. All abnormalities resolved within a two-week period; however, this rhesus macaque did
Pre Post Pre Post Pre Post Pre Post Pre Post Pre Post Pre Post Pre Post
Pre Post Pre Post Pre Post Pre Post Pre Post Pre Post Pre Post Pre Post
Pre Post Pre Post Pre Post Pre Post Pre Post Pre Post Pre Post Pre Post
Pre Post Pre Post Pre Post Pre Post Pre Post Pre Post Pre Post Pre Post 0 5 10 15 20 0 5 10 15
P = 0.5406 P = 0.3401
0 20 40 60 P = 0.1831
P = 0.2224
0 20 40 60
P > 0.9999 0 1 2 3 4 0 2 4 6 8 10
P = 0.9655
P = 0.4363
0 5 10 15 20 25
P = 0.6665
0 2 4 6 8 10 12
P = 0.1135 0 10 20 30 40 0 5 10 15 20
P = 0.0887
P = 0.2973
0 10 20 30 40
50 P = 0.1682
0 5 10 15 0 20 40 60 0 20 40 60
P = 0.1733P = 0.8452
0 20 40 60
P = 0.6604 P = 0.1335
0 20 40 60
P = 0.9892 P = 0.6048
Enrichment score
Rank in ordered dataset !"#$%&#%'()*(*)%+","-*, Rank in ordered dataset
Enrichment score
a b c
d REL NFKB1 RELA NFKBIA * IKBKG IKBKB MAP3K7 CHUK –1.0 –0.5 0 0.5 1.0 Dose 3 Dose 10 Dose 3 Dose 10
RELB *† NFKB2 *† MAP3K14 BIRC3 *† PC 2 PC 1 PC 1 PC 2
Lower after AZD5582 Lower after AZD5582 Higher after AZD5582
Higher after AZD5582
RDm16 RDl16 RKn16 RQs16 RAr16 RLy15 RYs16 RKl16 RKp16 RFk16 RNp16 RLu16 AZD5582 group RQd16 RAj16 RDf16 RNq16 Control group RFv15 RKw16 RUs16 RKz15 RZe15 Core enrichment
Nom. P < 0.001 NES = 1.89 Core enrichment Nom. P < 0.001 NES = 1.55
e
0.0 0.2 0.4 0.6 PB CD4+ T cells
LN CD4+ T cells
0.0 0.2 0.4 0.6
LN CD4+ T cells
PB CD4+ T cells
PB CD4+ T cells LN CD4+ T cells
CCR5 + (%) HLA-DR + (%) PD-1 + (%) Ki-67 + (%) PB CD4
+ T cells
LN CD4
+ T cells
CCR5 + (%) HLA-DR + (%) Ki-67 + (%) PD-1 + (%) P = 0.2657
P = 0.6665
P = 0.6192 P = 0.073
P = 0.0072
P = 0.8633
P = 0.1005P > 0.9999
PB CD8
+ T cells
CCR5 + (%) HLA-DR + (%) Ki-67 + (%) PD-1 + (%) P = 0.0104
P = 0.0449
LN CD8
+ T cells
CCR5 + (%) HLA-DR + (%) Ki-67 + (%) PD-1 + (%)
P = 0.0121 P = 0.4868 P = 0.0004
P = 0.6502
Dose 3 group
Dose 10 group
Fig. 4 | AZD5582 specifically activates the ncNF-κB pathway in SIV-infected ART-suppressed rhesus macaques without generalized T cell activation. a–c, Gene expression in CD4+ T cells from the
peripheral blood and lymph nodes of SIV-infected ART-suppressed rhesus macaques before and after treatment with AZD5582 (n = 6 for both lymph nodes and peripheral blood; for each, n = 3 for 3 doses of AZD5582 and n = 3 for 10 doses of AZD5582). a, Principal component (PC) analyses of the transcriptomes of CD4+ T cells from the peripheral
blood (top) and lymph nodes (bottom), before (grey) and after (red) treatment with AZD5582. Ellipses, two standard deviations. b, GSEA plots of NF-κB-induced genes in CD4+ T cells from the peripheral
blood (top) and lymph nodes (bottom). Gene set: ‘hallmark TNF signalling via NF-κB’ (MSigDB). NES, normalized enrichment score. c, Heat map of cNF-κB (top) and ncNF-κB (bottom) pathway gene expression. Colour scale, log2-transformed fold
changes after AZD5582 treatment compared with before treatment. Genes that are differentially expressed after treatment with AZD5582 in the peripheral blood (asterisks) or lymph nodes (daggers) CD4+ T cells are highlighted.
d, e, Expression of activation markers in CD4+ (d)
and CD8+ (e) T cells in the peripheral blood (top)
not receive further doses. Notably, weights did not significantly fluctu-ate over the course of the treatment period (Extended Data Fig. 9c). In summary, 97 doses of AZD5582 were administered to 12 SIV-infected ART-suppressed rhesus macaques, of which 95 were well-tolerated and 2 resulted in a mild adverse reaction.
Markers of T cell activation (both CD4+ and CD8+) were assessed
in AZD5582-treated rhesus macaques and controls, and expression of CCR5, HLA-DR and PD-1 on CD4+ T cells from the blood and lymph
nodes was similar before and after treatment with AZD5582 (Fig. 4d, e). Levels of intracellular Ki-67 expression were increased in CD4+ T cells in
the blood and CD8+ T cells in the blood and lymph nodes after AZD5582
treatment (Fig. 4d, e). CD8+ T cell expression of HLA-DR was higher in
the blood after exposure to AZD5582 (Fig. 4e). These results indicate that AZD5582 does not induce global CD4+ T cell activation in rhesus
macaques but the combined pharmacological and virological effects may have a stimulatory effect on CD8+ T cells. Longitudinal analyses
of CD4+ T cell counts and frequencies, CD4+ T cell viability, CD4+ T cell
subset frequencies and their Ki-67 expression are shown in Extended Data Fig. 10a–d. The increased Ki-67 observed within CD4+ T cells after
AZD5582 treatment may provide a note of caution as the proliferation of latently infected memory CD4+ T cells is hypothesized to contribute
to the maintenance of the viral reservoir over time25,27; however, we did
not find an increase in infected cells after AZD5582 treatment (Fig. 3e and Extended Data Fig. 6).
We next determined whether AZD5582 would impair SIV-specific T cell responses in SIV-infected ART-suppressed rhesus macaques, a poten-tial adverse outcome of treatment that has been suggested for other LRAs28. However, the frequency of SIV Gag- or Env-specific CD8+ T cells
measured by IFNγ ELISPOT did not decrease after AZD5582 treatment (Extended Data Fig. 10e), and CD8+ T cell polyfunctionality and
prolifera-tive responses were largely unaffected by AZD5582 treatment ex vivo, with the exception of IL-2+IFNγ+TNF+ triple-positive cells, which were
slightly reduced (P = 0.0476) (Extended Data Fig. 10f, g). Furthermore, longitudinal assessment of plasma levels of inflammatory cytokines and chemokines did not reveal any marked changes induced by AZD5582 (Extended Data Fig. 10h). Overall, our work in the rhesus macaque model indicates that AZD5582 treatment is safe in most macaques and can induce appreciable increases in plasma SIV RNA as well as SIV RNA expres-sion in resting CD4+ T cells from the lymph nodes during ART.
Discussion
Eradication of HIV infection after prolonged viral suppression is the focus of intense research and latency reversal has been a cornerstone of this effort. LRAs have been widely recognized as important (but previously mostly theoretical) tools to induce HIV expression in resting CD4+ T cells in humans. Future clinical applications of HIV
cure strategies must be relevant to the majority of people living with HIV for whom the treatments of the Berlin and London patients29,30
(whose non-HIV life-threatening haematological malignancies war-ranted aggressive, toxic therapies) pose an unacceptable level of risk. Therefore, LRAs must be identified that are highly effective but have minimal side effects. Here, we used two different but highly comple-mentary animal models31 to show that treatment with AZD5582 had
minimal and transient side effects but resulted in significant increases in HIV and SIV RNA levels both in the plasma and in resting CD4+ T cells
isolated from all analysed tissues from BLT mice and from the lymph nodes of macaques. Our results provide in vivo evidence of systemic HIV and SIV latency reversal from resting CD4+ T cells. The
concord-ance between the results obtained in two fundamentally different animal models highlights the robust and reproducible nature of the effect of AZD5582 on HIV and SIV reservoirs. The fact that there is little toxicity associated with the use of AZD5582 strongly suggests that activators of the ncNF-κB pathway may be well-suited for HIV eradication approaches in humans.
Online content
Any methods, additional references, Nature Research reporting sum-maries, source data, extended data, supplementary information, acknowledgements, peer review information; details of author con-tributions and competing interests; and statements of data and code availability are available at https://doi.org/10.1038/s41586-020-1951-3.
1. Finzi, D. et al. Latent infection of CD4+ T cells provides a mechanism for lifelong persistence of HIV-1, even in patients on effective combination therapy. Nat. Med. 5, 512–517 (1999). 2. Archin, N. M. et al. Interval dosing with the HDAC inhibitor vorinostat effectively reverses
HIV latency. J. Clin. Invest. 127, 3126–3135 (2017).
3. Archin, N. M. et al. Administration of vorinostat disrupts HIV-1 latency in patients on antiretroviral therapy. Nature 487, 482–485 (2012).
4. Elliott, J. H. et al. Activation of HIV transcription with short-course vorinostat in HIV-infected patients on suppressive antiretroviral therapy. PLoS Pathog. 10, e1004473 (2014).
5. Gutiérrez, C. et al. Bryostatin-1 for latent virus reactivation in HIV-infected patients on antiretroviral therapy. AIDS 30, 1385–1392 (2016).
6. Kulkosky, J. et al. Intensification and stimulation therapy for human immunodeficiency virus type 1 reservoirs in infected persons receiving virally suppressive highly active antiretroviral therapy. J. Infect. Dis. 186, 1403–1411 (2002).
7. Prins, J. M. et al. Immuno-activation with anti-CD3 and recombinant human IL-2 in HIV-1-infected patients on potent antiretroviral therapy. AIDS 13, 2405–2410 (1999). 8. Rasmussen, T. A. et al. Panobinostat, a histone deacetylase inhibitor, for latent-virus
reactivation in HIV-infected patients on suppressive antiretroviral therapy: a phase 1/2, single group, clinical trial. Lancet HIV 1, e13–e21 (2014).
9. Søgaard, O. S. et al. The depsipeptide romidepsin reverses HIV-1 latency in vivo. PLoS
Pathog. 11, e1005142 (2015).
10. Ke, R., Conway, J. M., Margolis, D. M. & Perelson, A. S. Determinants of the efficacy of HIV latency-reversing agents and implications for drug and treatment design. JCI Insight 3, e123052 (2018).
11. Sun, S. C. The noncanonical NF-κB pathway. Immunol. Rev. 246, 125–140 (2012). 12. Fulda, S. Molecular pathways: targeting death receptors and Smac mimetics. Clin.
Cancer Res. 20, 3915–3920 (2014).
13. Pache, L. et al. BIRC2/cIAP1 is a negative regulator of HIV-1 transcription and can be targeted by Smac mimetics to promote reversal of viral latency. Cell Host Microbe 18, 345–353 (2015).
14. Hennessy, E. J. et al. Discovery of a novel class of dimeric Smac mimetics as potent IAP antagonists resulting in a clinical candidate for the treatment of cancer (AZD5582).
J. Med. Chem. 56, 9897–9919 (2013).
15. Honeycutt, J. B. et al. T cells establish and maintain CNS viral infection in HIV-infected humanized mice. J. Clin. Invest. 128, 2862–2876 (2018).
16. Kessing, C. F. et al. In vivo suppression of HIV rebound by didehydro-cortistatin A, a “block-and-lock” strategy for HIV-1 treatment. Cell Reports 21, 600–611 (2017). 17. Tsai, P. et al. In vivo analysis of the effect of panobinostat on cell-associated HIV RNA and
DNA levels and latent HIV infection. Retrovirology 13, 36 (2016).
18. Melkus, M. W. et al. Humanized mice mount specific adaptive and innate immune responses to EBV and TSST-1. Nat. Med. 12, 1316–1322 (2006).
19. Choudhary, S. K. et al. Latent HIV-1 infection of resting CD4+ T cells in the humanized Rag2−/− γ
c−/− mouse. J. Virol. 86, 114–120 (2012).
20. Denton, P. W. et al. Generation of HIV latency in humanized BLT mice. J. Virol. 86, 630–634 (2012).
21. Wahl, A. et al. Precision mouse models with expanded tropism for human pathogens. Nat.
Biotechnol. 37, 1163–1173 (2019).
22. Mavigner, M. et al. Simian immunodeficiency virus persistence in cellular and anatomic reservoirs in antiretroviral therapy-suppressed infant rhesus macaques. J. Virol. 92, e00562-18 (2018).
23. Mavigner, M. et al. Pharmacological modulation of the Wnt/β-catenin pathway inhibits proliferation and promotes differentiation of long-lived memory CD4 T cells in antiretroviral therapy-suppressed simian immunodeficiency virus-infected macaques.
J. Virol. 94, e01094-19 (2019)
24. Abrahams, M. R. et al. The replication-competent HIV-1 latent reservoir is primarily established near the time of therapy initiation. Sci. Transl. Med. 11, eaaw5589 (2019). 25. Anderson, E. M. & Maldarelli, F. The role of integration and clonal expansion in HIV
infection: live long and prosper. Retrovirology 15, 71 (2018).
26. Ferris, A. L. et al. Clonal expansion of SIV-infected cells in macaques on antiretroviral therapy is similar to that of HIV-infected cells in humans. PLoS Pathog. 15, e1007869 (2019).
27. Kuo, H. H. & Lichterfeld, M. Recent progress in understanding HIV reservoirs. Curr. Opin.
HIV AIDS 13, 137–142 (2018).
28. Clutton, G. T. & Jones, R. B. Diverse impacts of HIV latency-reversing agents on CD8+ T-cell function: implications for HIV cure. Front. Immunol. 9, 1452 (2018).
29. Gupta, R. K. et al. HIV-1 remission following CCR5Δ32/Δ32 haematopoietic stem-cell transplantation. Nature 568, 244–248 (2019).
30. Hütter, G. et al. Long-term control of HIV by CCR5 Delta32/Delta32 stem-cell transplantation. N. Engl. J. Med. 360, 692–698 (2009).
31. Nixon, C, C., Mavigner, M., Silvestri G. & Garcia, J. V. In vivo models of human
immunodeficiency virus persistence and cure strategies. J. Infect. Dis. 215, S142–S151 (2017).
Methods
Experimental designThe purpose of this study was to determine the efficacy of the SMAC-mimetic AZD5582 as an HIV and SIV LRA in vivo. To this end, two animal models of HIV-1 infection were used: the HIV-infected BLT humanized mouse model and the SIV-infected rhesus macaque (Macaca mulatta) nonhuman primate (NHP) model. In each model, animals were infected with HIV-1 or SIV and viraemia was durably suppressed with ART. AZD5582 was administered to infected ART-suppressed animals that were then assessed for changes associated with the reactivation of the viral reservoir. Mice were maintained under specific-pathogen-free conditions by the Division of Comparative Medicine at the University of North Carolina, Chapel Hill. Mouse experiments were conducted in accordance with NIH guidelines for the housing and care of laboratory animals and in accordance with protocols reviewed and approved by the Institutional Animal Care and Use Committee (IACUC) at the University of North Carolina, Chapel Hill. Healthy rhesus macaques for pharma-cokinetic studies were housed at GlaxoSmithKline and all procedures were conducted in accordance with the GlaxoSmithKline policy on the care, welfare and treatment of laboratory animals and were reviewed by the IACUC at GlaxoSmithKline. Rhesus macaques infected with SIV were housed at the Yerkes National Primate Research Center and treated in accordance with Emory University and Yerkes National Pri-mate Research Center IACUC regulations (PROTO201800308). Animal-care facilities are accredited by the US Department of Agriculture and the Association for Assessment and Accreditation of Laboratory Animal Care International.
Preparation of Jurkat HIV–luciferase cell clones
Cell clones Jurkat-C16 and Jurkat-I15 were prepared by infecting Jur-kat cells (JurJur-kat clone E6-1 cells, American Type Culture Collection TIB-152, authenticated by morphological identification and virus-susceptibility profiles, tested for mycoplasma by the supplier) with a full-length, infectious HIV-1NL4-3-based virus engineered to express
a luciferase reporter in place of the HIV-1 nef gene (NLCH-Luci). The Jurkat-N6 cell clone was generated using the same virus as described above with an additional mouse heat-stable antigen (HSA) reporter located just downstream of the luciferase open-reading frame and separated by a T2A element (NLCH-Luci-HSA). NLCH, provided by R. Swanstrom, is the parent molecular infectious clone used to make the Jurkat clones and is a modification of HIV-1NL4-3 (GenBank U26942)
in which flanking sequences were removed. All viruses were derived by transfection of human embryonic kidney 293 cells (HEK 293T, European Collection of Authenticated Cell Cultures, authenticated by morphological identification, tested for mycoplasma by the sup-plier) with 1 μg of the HIV-1NL4-3-derived infectious molecular plasmid
DNA using the FuGENE HD Transfection reagent (Promega) according to the manufacturer’s recommendations. Supernatants were collected 48 h after transfection, passed through a 0.2-μm filter, and used to infect wild-type Jurkat cells. After infection, cells expressing high levels of HIV-encoded mouse HSA were removed using biotin-labelled rat anti-mouse CD24 antibody (clone M1/69, BD Biosciences) that was adsorbed to streptavidin-labelled magnetic Dynabeads M-280 (Life Technologies) according to the manufacturer’s recommendations. Negatively selected HIV-infected Jurkat cells were then limit-diluted to 0.5 cells per well in 96-well plates, and individual cell clones were expanded for 2–4 weeks in culture in the presence of 500 nM efavirenz. Clones were profiled for baseline reporter level and responsiveness to benchmark LRAs, with C16, I15 and N6 representing the most quiescent but inducible clones that were obtained.
Cell culture and Jurkat HIV–luciferase assay
Jurkat HIV–luciferase clones were maintained in Roswell Park Memorial Institute (RPMI) 1640 medium (Gibco, Life Technologies) containing
10% (v/v) fetal bovine serum (FBS; SAFC, Sigma-Aldrich), 25 U ml−1
peni-cillin and 25 U ml−1 streptomycin (Gibco, Life Technologies), and were
split 1:4 every 3–4 days to maintain a cell density of around 0.3–1 million cells per ml. The Jurkat clones were maintained with the addition of 500 nM efavirenz to the medium. Three Jurkat cell clones (C16, I15 and N6), each of which contained one or two integrated HIV proviruses that expressed the luciferase reporter gene, were added at equal amounts for a total of 5,000 cells per well to 384-well plates containing com-pound titrations. Dose–response testing was performed on comcom-pounds dissolved in dimethyl sulfoxide (DMSO; Fisher Scientific) dispensed in duplicate serial threefold, 14-point titrations using a D300e Digital Droplet Dispenser (Hewlett-Packard) to give final assay concentrations ranging from 10 μM to 2.1 pM in 50 μl of medium with a final concentra-tion of 0.5% DMSO (v/v). Cells and compound were incubated at 37 °C for 48 h, unless otherwise indicated, followed by the addition of 20 μl of Steady-Glo Luciferase (Promega). Luminescence resulting from the induction of virally expressed luciferase was measured using an EnVision 2102 Multilabel Plate Reader (Perkin Elmer). Dose–response relationships were analysed with GraphPad Prism (v.6) using a four-parameter logistic regression model to calculate the concentration of compound that provides the half-maximal response and the maximal percentage activation compared to the vehicle control.
Immunoblot analyses
For the immunoblot assays, 10 μg of cell lysate was loaded per well into 4–20% Tris-Glycine SDS–PAGE gels. Proteins from the SDS–PAGE gels were transferred to Turbo Midi PVDF Transfer Packs (BioRad) using the ‘Mixed MW’ protocol for one Midi Format Gel (constant 2.5 A up to 25 V, for 7 min) of the Trans-Blot Turbo Transfer System (BioRad) with pre-made Trans-Blots according to the manufacturer’s instructions. After transfer, PVDF membranes were blocked in 5% bovine serum albumin (BSA) in 1× Tris-buffered saline (TBS) (BioRad) with 0.1% Tween-20 for 1 h at room temperature with gentle rocking. Primary antibodies were added and incubated overnight at 4 °C (anti-cIAP1, 1:1,000 (Abcam); anti-p100/p52, 1:1,000 (Cell Signaling Technology); anti-IκBα, 1:1,000 (Cell Signaling Technology); cIAP2, 1:1,000 (Abcam); and anti-actin-HRP conjugate, 1:30,000 (Abcam). After staining with primary antibodies, the membrane was washed three times with 1× TBS and 0.1% Tween-20, 10 min each wash. After washing, the membrane was incubated in 5% BSA in 1× TBS and 0.1% Tween-20 with the appropriate secondary antibody for 2 h at room temperature. After staining with secondary antibodies, the membrane was washed twice for 10 min with 1× TBS and 0.1% Tween-20 followed by a 10-min wash with 1× TBS. The membrane was then patted dry with filter paper and an image was captured of the undeveloped membrane on a ChemiDoc MP Imaging System using Image Laboratory software (v.6.0.1, BioRad). Sufficient ECL reagent (GE Healthcare) was used to cover the membrane and a series of images was taken with increasing exposure times until the luminescence from the developed membrane saturated the image. The developed membrane was then washed 3 times with 1× TBS for 5 min to remove the residual ECL reagent and then stored at 4 °C in sufficient 1× TBS to submerse the entire membrane. Densitometry of images of the developed membrane was then carried out using Image Laboratory software (v.6.0.1, BioRad). Some membranes were stripped for 1 min with One Minute Plus Western Blot Stripping Buffer (GM Biosciences) and then washed 3 times for 10 min with 1× TBS. The stripped mem-branes were then blocked in 5% BSA in 1× TBS and 0.1% Tween-20 for 1 h and re-probed overnight with a new primary antibody. To normalize samples for loading a 1:20,000 dilution of β-actin (Abcam) was run on the stripped membranes.
Target gene RT–qPCR
We treated 2 million normal donor CD4+ T cells with a range of
TaqMan primer probe sets were sourced from Applied Biosystems: Hs00985031_g1 (BIRC3), Hs00174517_m1 (NFKB2) and Hs02800695 (HPRT1). TaqMan-based quantitative PCR with reverse transcription (RT–qPCR; Fast Virus 1-Step Master Mix, Applied Biosystems) was used to amplify host genes of interest and acquire the signal on a QuantStu-dio 3 Real-Time PCR thermocycler (ThermoFisher). Gene expression was normalized to HPRT1 and the comparative threshold cycle (Ct)
method (ΔΔCt) was used for relative quantification of gene expression.
Relative quantification was analysed by QuantStudio 3 Real-Time PCR System software (v.1.4.3, ThermoFisher).
HIV quantitative viral outgrowth
All human peripheral-blood mononuclear cell (PBMC) samples were obtained under a specimen procurement protocol reviewed and approved by the University of North Carolina Biomedical Institutional Review Board and the McGill University Health Centre Ethical Review Board. Informed consent was obtained from all participants. Human PBMCs for quantitative viral outgrowth were obtained using continu-ous flow leukapheresis. Resting CD4+ T cells were isolated and virus
outgrowth assays were performed as previously described32,33 with
some modifications. In brief, 20–50 × 106 highly purified resting CD4+
T cells were stimulated with phytohaemagglutinin, IL-2 (60 U ml−1) and
irradiated PBMCs from a seronegative donor, or with 100 nM AZD5582, 335 nM vorinostat or 0.003% DMSO (vehicle control) in limiting dilu-tions for 24 h. Cultures were washed to remove drugs and CCR5high,
CD8-depleted, phytohaemagglutinin-stimulated PBMCs from an unin-fected donor were added twice to amplify virus outgrowth. Culture supernatants were assayed for HIV p24 expression by ELISA on day 15 and confirmed on day 19. A maximum-likelihood method was used to estimate the frequency of inducible virus and is reported as infectious units per million34.
RNA-sequencing analysis of human cells
Total CD4+ T cells were isolated from PBMCs of four ART-treated
avirae-mic patients by negative selection (EasySep Human CD4+ T Cell
Enrich-ment Kit, StemCell) according to the manufacturer’s instructions. Dead cells and other debris were removed using a Dead Cell Removal Kit (Miltenyi Biotec) according to the manufacturer’s instructions. Cells from each patient were treated with 0.05% DMSO, 100 nM AZD5582 or 25 nM ingenol B and collected 2 h, 6 h and 24 h after exposure. RNA was isolated from the collected cells using AllPrep DNA/RNA Mini Kit (Qiagen). Then, 200 ng of RNA from each sample was checked for qual-ity using an Agilent Bioanalyzer; RNA-integrqual-ity number scores were typically >9.0, suggesting that high-quality RNA was obtained. These total RNA samples were then processed into stranded, mRNA libraries using the KAPA library preparation kit (KAPA BioSystems, F. Hoffmann-La Roche). The concentrations of the final libraries were checked by Qubit (Thermo Fisher) and the fragment size distribution (mean size, 359 bp) was analysed with a BioAnalyzer HS-DNA chip (Agilent). Samples were then sequenced using an Illumina Hiseq 4000 sequencer using a paired-end 50-bp by 50-bp run. Samples were successfully demul-tiplexed and then quality assurance and quality control was carried out using FASTQC (v.0.11.1) (https://www.bioinformatics.babraham. ac.uk/projects/fastqc/).
Raw reads were mapped to the human genome and transcriptome (GRCh38.p7) using STAR35 and Salmon (v.0.7.2)36. Data were
normal-ized and analysed for changes in gene expression using the DESeq2 package37 in R. P values were adjusted for multiple testing using a
false-discovery rate using the Benjamini–Hochberg method38. Data were
analysed both jointly and within each treatment compared with the vehicle control. Differential expression of outliers was assessed and found to have a non-significant overall effect. Thresholds applied to call a significant response were mean log2-transformed fold change
>1 and adjusted P < 0.05. Graphs and summary tables were built in R using ggplot. Gene-set enrichment was performed using GSEA (v.2.2.3)
and GO analysis (GO PANTHER v.11.1)39. Results shown are the mean
responses of the four donors tested.
Generation and maintenance of BLT mice
BLT mice were prepared as previously reported18,40,41. In brief, a 1–2-mm
piece of human liver tissue was sandwiched between two pieces of autologous thymus tissue (Advanced Bioscience Resources) under the kidney capsule of sublethally irradiated (200 cGy) 12–15-week-old female NOD.Cg-Prkdcscid Il2rgtm1Wjl/SzJ (NSG; The Jackson
Labora-tory) mice. After implantation, mice were transplanted intravenously with CD34+ haematopoietic stem and progenitor cells isolated from
autologous human liver tissue. Human immune cell reconstitution was monitored in the peripheral blood of BLT mice by flow cytometry every 3–4 weeks21. For the study that examined the effect of AZD5582
administration on T cell activation, the mean weight of the mice used was 26.88 g and they were approximately 1 year of age at the initia-tion of the study. For the study that examined the effect of AZD5582 administration on plasma and tissue viraemia during ART suppres-sion, the mean weight of the mice used was 23.14 g and the mice were approximately 7 months old at the initiation of the study. Mice were randomized for assignment to either experimental or control groups (https://www.random.org/).
HIV infection of BLT mice
Stocks of HIV-1JR-CSF were prepared as follows. The proviral clone was
transfected into HEK293T cells using Lipofectamine 2000 (Invitro-gen) following the manufacturer’s protocols. Viral supernatant was collected 48 h after transfection. Viral supernatant was titrated by infecting TZM-bl cells (NIH AIDS Reagent Program, authenticated by morphological identification and virus-susceptibility profiles, tested for mycoplasma by the supplier) at multiple dilutions. Virus-containing medium was removed the next day and replaced with fresh Dulbecco’s modified Eagle medium (DMEM; ThermoFisher) plus 10% FBS and the incubation continued for 24 h. The cells were fixed and stained with 5-bromo-4-chloro-3-indolyl-β-d-galactopyranoside and blue cells were counted directly to determine infectious particles per ml. Each titre of these viral stocks was performed in triplicate and at least two different titre determinations were performed for each virus stock. Exposure of BLT mice to HIV-1JR-CSF was conducted by tail vein injection with 3 × 10⁴
tissue culture infectious units of virus. Plasma viral load in peripheral blood of infected mice was monitored longitudinally by RT–qPCR using TaqMan RNA to-CT 1-step kit (Applied Biosystems). The sequences
of the forward and reverse primers and the TaqMan probe for PCR amplification and detection of HIV gag RNA were: 5′-CATGTTTTCA GCATTATCAGAAGGA-3′, 5′-TGCTTGATGTCCCCCCACT-3′ and 5′-FA M-CCACCCCACAAGATTTAAACACCAT-GCTAA-Q-3′, respectively. For viral load analysis, 40 μl of plasma was collected and analysed with a sensitivity of 350 copies per ml. All samples were run and analysed on an ABI 7500 Fast Real Time PCR System (Applied Biosystems).
SIV infection of NHPs
In total, 21 male and female Indian rhesus macaques, 3–6 years of age, with the exclusion of MamuB*08+ and MamuB*17+ macaques, were
included in this study (Supplementary Table 7). Rhesus macaques were infected intravenously with 3 × 10³ TCID
50 (50% tissue culture
infectious dose) of SIVmac239. The SIVmac239 stock was titrated in vitro
for viral infectivity by standard end-point titration on CEMx174 cells. The TCID50 was calculated as previously described42. Standard SIVmac239
plasma viral-load quantification was performed regularly throughout the study and three times per week during the AZD5582 treatment period in the Translational Virology Core Laboratory of the Emory Center for AIDS Research using a standard qPCR assay (limit of detec-tion of 60 copies per ml of plasma) as previously described43.
Ultra-sensitive SIVmac239 plasma viral-load quantification (limit of detection
AZD5582 treatment and 3–4 time points during AZD5582 treatment as previously described44,45.
ART and AZD5582 treatment of BLT mice and NHPs
ART was administered to BLT mice using irradiated Teklad chow con-taining emtricitabine (1,500 mg kg−1), tenofovir disoproxil fumarate
(1,560 mg kg−1) and raltegravir (600 mg kg−1) (Research Diets). Both
the AZD5582 and the vehicle control (10% sterile captisol dissolved in sterile distilled water) were prepared fresh for each administration. AZD5582-2HCl was obtained from ChemieTek and dissolved at 5 mg ml−1
in sterile distilled water (Gibco, Life Technologies) containing 10% captisol β-cyclodextrine sulfobutyl ethers sodium salts (Cydex Phar-maceuticals). AZD5582 was administered by intraperitoneal injection at a dose of 3 mg kg−1.
Rhesus macaques were treated with a potent 3-drug ART regimen initiated 56 days after infection that consisted of 2 reverse transcriptase inhibitors, tenofovir disoproxil fumarate (5.1 mg ml−1) and emtricitabine
(40 mg ml−1) plus the integrase inhibitor dolutegravir (2.5 mg ml−1). ART
was administered once daily at 1 ml kg−1 body weight via the
subcuta-neous route. Peak plasma viral load (measured by the standard assay) and plasma viral load before LRA intervention (as measured by the ultrasensitive assay) were controlled for when allocating macaques into experimental groups. In total, 12 rhesus macaques were treated with AZD5582 and 9 rhesus macaques served as controls. AZD5582 was infused weekly intravenously at 0.1 mg kg−1. Three rhesus macaques
received 3 doses of AZD5582 and were euthanized 48 h after the last dose. Nine rhesus macaques received 10 doses of AZD5582 and 3 macaques were euthanized 48 h after the last dose. Among the con-trol rhesus macaques, 4 macaques received a weekly placebo infusion, 2 macaques were euthanized 48 h after 3 infusions and 2 macaques were euthanized 48 h after 10 infusions. The remaining five control macaques received ART only.
Resting CD4+ T cell enrichment
Human resting CD4+ T cells were enriched from total cells isolated
from BLT mouse tissues as follows. Each tissue from each mouse was processed individually and then tissues were pooled for immunomag-netic sorting. Each pooled tissue was first enriched for human cells with the EasySep Mouse/Human Chimera Kit (Stem Cell Technolo-gies) and then for resting CD4+ T cells with a human custom selection
kit that included the following antibodies: CD8, CD14, CD16, CD19, CD20, CD36, CD56, CD123, glycophorin A, CD66b, CD25 and HLA-DR (all Stem Cell Technologies). Flow cytometry was performed before and after the enrichment to confirm the efficacy of the sort and purity of the sorted samples.
Resting CD4+ T cells from rhesus macaques were isolated from the
peripheral blood, bone marrow, lymph node and spleen. Before sorting, CD4+ T cells were enriched using magnetic beads and column
purifi-cation (Miltenyi Biotec). Enriched CD4+ T cells were then stained with
previously determined volumes of the following fluorescently conju-gated antibodies: CD3 AF700 (clone SP34-2), CD8 APC-Cy7 (clone SK1), CD69 PE-CF594 (clone FN50), HLA-DR PerCP-Cy5.5 (clone G46-6) (all from BD Bioscience) and CD4 BrilliantViolet (BV)650 (clone OKT4) and CD25 PE-Cy7 (clone BC96) (both from Biolegend). Resting CD4+
T cells were defined as CD3+CD4+CD8−CD69−CD25−HLA-DR−. Sorting
was performed on a FACSAria LSR II (BD Biosciences) equipped with FACSDiva software.
Plasma cytokine and chemokine analysis
Human plasma cytokine and chemokine analysis in BLT mice was per-formed by the University of North Carolina, Chapel Hill Center for AIDS Research Virology Core Laboratory. Plasma was tested undiluted in sin-gle wells using a Milliplex MAP kit (Millipore, HCYTMAG-60K-PX41) on a Luminex MAGPIX instrument. The following markers were tested: EGF, eotaxin, FGF-2, FLT-3L, fractalkine, G-CSF, GM-CSF, GRO, IFNα2, IFNγ,
IL-1α, IL-1β, IL-1RA, IL-2, IL-3, IL-4, IL-5, IL-6, IL-7, IL-8, IL-9, IL-10, IL-12p40, IL-12p70, IL-13, IL-15, IL-17A, IP-10, MCP-1, MCP-3, MDC, MIP-1α, MIP-1β, PDGF-AA, PDGF-AB/BB, RANTES, sCD40L, TGFα, TNF, TNFβ and VEGF. Rhesus macaque plasma levels of proinflammatory cytokines and chemokines were evaluated using the NHP MSD V-Plex assay systems developed by MesoScale Discovery. The two validated kits used were the V-PLEX Plus Proinflammatory Panel 1 NHP Kit (K15056D) that evalu-ates IFNγ, IL-10, IL-1β, IL-2, IL-6 and IL-8, and a custom Chemokine NHP Kit that evaluates IP-10, MCP-1 and MIP-1β (K15055G). The manufac-turer-provided protocol was followed with a few modifications. As the plasma samples were infectious, Triton X-100 at a final concentration of 1% was added not only to the subject samples but also to the assay diluents provided with the MSD kit before use. Calibration standards were reconstituted according to the protocol provided with the assay diluent that had the Triton X-100 added to it so that all standards and samples had the same components present. Plasma (60 μl) was diluted twofold with assay diluent and then 50 μl of the diluted sample was added to the assay plate along with 50 μl of the calibrator according the manufacturer’s protocol. The plate was then covered and incubated on a shaker for 2 h. After the 2-h incubation, plates were washed at least 6× with the supplied wash buffer and then 25 μl of detection antibodies was added according to the kit protocol. Subsequently, the plate was covered and incubated on a shaker for 2 h at room temperature. After the detection incubation was finished, plates were then washed 6× and 150 μl of 2× read buffer was added to each well and plates were analysed on the Sector s600 MSD plate reader. Data analysis was performed using the MSD Discovery Workbench analysis software.
Cell-associated HIV RNA quantification in BLT mice
For tissue RNA analysis, RNA was extracted using QIAamp viral RNA columns (Qiagen) according to the manufacturer’s protocol includ-ing an optional treatment with RNase-free DNase and analysed usinclud-ing one-step reverse-transcriptase qPCR (ABI custom TaqMan Assays-by-Design)46. Known quantities of HIV gag RNA standards were run
in parallel, creating a standard curve for HIV gag and sample RNA was quantified by extrapolation from the standard curve. All samples were run and analysed on an ABI 7500 Fast Real-Time PCR System (Applied Biosystems). Owing to the relatively low number of human cells found in the brain, HIV RNA levels were quantified for only three vehicle con-trol- and three AZD5582-treated mice.
Immunohistochemical analysis in BLT mice
Tissues for immunohistochemical analysis were collected from BLT mice and fixed in 10% formalin for 16–24 h at 4 °C. Samples were then embedded in paraffin, cut into 5-μm sections and mounted onto poly-l-lysine-coated glass slides. After paraffin removal, antigen retrieval (DIVA Decloaker, Biocare Medical) and blocking of nonspecific immu-noglobulin-binding sites (Background Sniper, Biocare Medical), tissue sections were stained with anti-cIAP1 antibody (R&D Systems) overnight at 4 °C. To detect cIAP1, sections were probed with a goat-on-rodent HRP polymer (Biocare Medical) and developed with diaminobenzi-dine (ImmPact DAB Peroxidase Substrate, Vector Laboratories). As an isotype control, tissue sections were stained with polyclonal goat IgG (R&D Systems) negative control antibodies. Tissue sections were imaged with a Nikon Eclipse Ci microscope using Nikon Elements BR software (v.4.30.01) and a Nikon Digital Sight DS-Fi2 camera.
Serum chemistry analysis in mice