The SAGE-Spec
Spitzer
Legacy program:
The life-cycle of dust and gas in the Large Magellanic Cloud.
Point source classification III.
Olivia C. Jones
1, Paul M. Woods
2, F. Kemper
3, K. E. Kraemer
4, G. C. Sloan
1,8,12,
S. Srinivasan
3, J. M. Oliveira
5, J. Th. van Loon
5, Martha L. Boyer
1, Benjamin
A. Sargent
1,13, I. McDonald
6, Margaret Meixner
1, A. A. Zijlstra
6,11, Paul M. E. Ruffle
3,6,∗,
E. Lagadec
7, Tyler Pauly
8, Marta Sewi lo
9, G. C. Clayton
10, K. Volk
1ABSTRACT
The Infrared Spectrograph (IRS) on theSpitzer Space Telescopeobserved nearly 800 point sources in the Large Magellanic Cloud (LMC), taking over 1 000 spectra. 197 of these targets were observed as part of the SAGE-Spec Spitzer Legacy program; the remainder are from a variety of different calibration, guaranteed time and open time projects. We classify these point sources into types according to their infrared spectral features, continuum and spectral energy distribution shape, bolometric luminosity, cluster membership, and variability information, using a decision-tree classification method. We then refine the classification using supplementary information from the astrophysical literature. We find that our IRS sample is comprised substantially of YSO and Hii regions, post-Main Sequence low-mass stars: (post-)AGB stars and planetary nebulae and massive stars including several rare evolutionary types. Two supernova remnants, a nova and several background galaxies were also observed. We use these classifications to improve our understanding of the stellar populations in the Large Magellanic Cloud, study the composition and characteristics of dust species in a variety of LMC objects, and to verify the photometric classification methods used by mid-IR surveys. We discover that some widely-used catalogues of objects contain considerable contamination and others are missing sources in our sample.
Subject headings: galaxies: individual (LMC) — infrared: galaxies — infrared: stars — Magellanic Clouds — surveys — techniques: spectroscopic.
1Space Telescope Science Institute, 3700 San Martin Drive, Baltimore, MD, 21218, USA
2Astrophysics Research Centre, Dept. of Mathematics & Physics, Queen’s University Belfast, Belfast BT7 1NN, UK
3Academia Sinica, Institute of Astronomy and Astro-physics, Taipei 10617, Taiwan
4Institute for Scientific Research, Boston College, 140 Commonwealth Avenue, Chestnut Hill, MA 02467, USA
5School of Chemical and Physical Sciences, Lennard-Jones Laboratories, Keele University, Staffordshire ST5 5BG, UK
6Jodrell Bank Centre for Astrophysics, Alan Turing Building, School of Physics and Astronomy, The Univer-sity of Manchester, Oxford Road, Manchester, M13 9PL, UK
7Observatoire de la Cˆote d’Azur, CNRS, Lagrange,
France
8Cornell Center for Astrophysics and Planetary Science, Cornell University, Ithaca, NY 14853-6801, USA
9NASA Goddard Space Flight Center, 8800 Greenbelt Rd, Greenbelt, MD 20771, USA
10Department of Physics & Astronomy, Louisiana State University, Baton Rouge, LA 70803, USA
11Department of Physics, University of Hong Kong, Pok-fulam Road, Hong Kong
12Department of Physics and Astronomy, University of North Carolina Chapel Hill, Chapel Hill, NC 27599-3255, USA
13Center for Imaging Science and Laboratory for Mul-tiwavelength Astrophysics, Rochester Institute of Technol-ogy, 54 Lomb Memorial Drive, Rochester, NY 14623, USA *Paul M. E. Ruffle passed away on 21 November 2013.
1
1. Introduction
There are many ways to probe the properties of a galaxy. One of the most important is to char-acterise its stellar content. Particularly revealing is to identify (stellar) sources that are bright in the infrared: these sources are generally dust-rich, and form an important step in the cycle of bary-onic matter throughout a galaxy, for which dust is an important tracer. IR-bright stellar sources cover a wide range of stellar masses, at both ends of stellar evolution.
The Large Magellanic Cloud (LMC) is a nearby galaxy (50 kpc away; Pietrzy´nski et al. 2013) that has been the subject of, or included in, a plethora of past and on-going surveys at all wavelengths. As such, a wealth of information exists about its stellar sources, which can be compiled and un-derstood in terms of different stellar populations. Within the LMC, stars can be assumed to be all at approximately the same distance from the Earth and to have a narrow range of metallicity, [Fe/H]
∼ −0.3 dex (Westerlund 1997).
The Surveying the Agents of Galaxy Evolution (SAGE) project (Meixner et al. 2006) performed a uniform, unbiased photometric survey of the LMC with the Spitzer Space Telescope (Werner et al. 2004), using all bands of the Infrared Array Camera (IRAC; 3.6, 4.5, 5.8, and 8.0 µm; Fazio et al. 2004) and the Multi-Band Imaging Photome-ter for Spitzer (MIPS; 24, 70, and 160 µm; Rieke et al. 2004). This complements the optical Magel-lanic Clouds Photometric Survey (MCPS; Zarit-sky et al. 2004) and the near-infrared surveys: Two Micron All Sky Survey (2MASS; Skrutskie et al. 2006) and the VISTA Survey of the Mag-ellanic Clouds (VMC; Cioni et al. 2011). From the SAGE imaging, a point source catalogue has been constructed, containing 8.5 million sources with detections in at least one of theSpitzer pho-tometric bands (Meixner et al. 2006). The Her-schel Space Observatory (Pilbratt 2010) with the Herschel Inventory of the Agents of Galaxy Evo-lution survey (HERITAGE; Meixner et al. 2013) has also targeted the Magellanic Clouds, prob-ing the far-infrared (FIR) and submillimetre (sub-mm) regime, detecting the emission from the cold-est dust grains.
Some of the initial spectroscopic surveys in the LMC with the Infrared Spectrograph (IRS;
Houck et al. 2004) on Spitzer were conducted by Buchanan et al. (2006, 2009) who targeted 60 IR bright sources in the LMC with an 8 µm MSX detection (Egan et al. 2001). A larger spectro-scopic follow-up to the SAGE photometric survey, SAGE-Spec (Kemper et al. 2010), charts the life cycle of gas and dust in galaxies by observing a variety of circumstellar and interstellar environ-ments. These observations of 197 sources covered the full luminosity and colour range found in the SAGE photometric survey. Woods et al. (2011a, hereafter Paper I) developed a comprehensive clas-sification scheme for point sources based on the mid-IR spectra, and applied this to the initial 197 LMC point sources in the SAGE-Spec sample. The second paper, which applied this scheme to sources from the Small Magellanic Cloud (SMC), was published by Ruffle et al. (2015, hereafter Pa-per II). In the current paPa-per (PaPa-per III) we ex-tend the spectroscopic inventory to all IRS staring-mode observations within the SAGE footprint. These classifications improve our understanding of the stellar populations of the Magellanic Clouds and ultimately, allow us to relate mid-IR photome-try to the spectral characteristics of different types of objects within the LMC. These results provide a global view of the dust content at different stages of the evolutionary cycle in the LMC and thereby trace the life cycle of baryonic matter that drives galactic evolution.
In Sect. 2 we describe the entire IRS sample of over 1 000 spectra and the data reduction process we used to process them. In Sect. 3 we describe the classification method using the different spec-tral features in individual sources, and in Sect. 4 we present the results of the spectral classification and discuss the different object classes contained in the catalog. We compare these results to classi-fications that are commonly used in the literature in Sect. 5. Finally, we end with a discussion and conclusions in Sect. 6.
2. The Spitzer data and data reduction
We used the spectra from the SAGE-Spec database at the NASA/IPAC Infrared Science Archive (IRSA)1. This database includes all staring-mode
observations with theSpitzerIRS taken in the area
1http://irsa.ipac.caltech.edu/cgi-bin/Gator/nph-dd?
catalog=ssid2
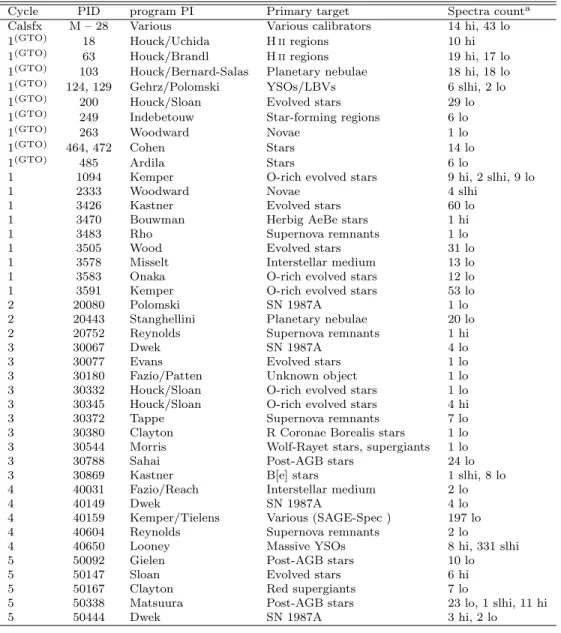
Table 1: Spitzer IRS Staring mode data and their sources
Cycle PID program PI Primary target Spectra counta
Calsfx M – 28 Various Various calibrators 14 hi, 43 lo
1(GTO) 18 Houck/Uchida H
iiregions 10 hi
1(GTO) 63 Houck/Brandl Hiiregions 19 hi, 17 lo
1(GTO) 103 Houck/Bernard-Salas Planetary nebulae 18 hi, 18 lo
1(GTO) 124, 129 Gehrz/Polomski YSOs/LBVs 6 slhi, 2 lo
1(GTO) 200 Houck/Sloan Evolved stars 29 lo
1(GTO) 249 Indebetouw Star-forming regions 6 lo
1(GTO) 263 Woodward Novae 1 lo
1(GTO) 464, 472 Cohen Stars 14 lo
1(GTO) 485 Ardila Stars 6 lo
1 1094 Kemper O-rich evolved stars 9 hi, 2 slhi, 9 lo
1 2333 Woodward Novae 4 slhi
1 3426 Kastner Evolved stars 60 lo
1 3470 Bouwman Herbig AeBe stars 1 hi
1 3483 Rho Supernova remnants 1 lo
1 3505 Wood Evolved stars 31 lo
1 3578 Misselt Interstellar medium 13 lo
1 3583 Onaka O-rich evolved stars 12 lo
1 3591 Kemper O-rich evolved stars 53 lo
2 20080 Polomski SN 1987A 1 lo
2 20443 Stanghellini Planetary nebulae 20 lo
2 20752 Reynolds Supernova remnants 1 hi
3 30067 Dwek SN 1987A 4 lo
3 30077 Evans Evolved stars 1 lo
3 30180 Fazio/Patten Unknown object 1 lo
3 30332 Houck/Sloan O-rich evolved stars 1 lo 3 30345 Houck/Sloan O-rich evolved stars 4 hi
3 30372 Tappe Supernova remnants 7 lo
3 30380 Clayton R Coronae Borealis stars 1 lo 3 30544 Morris Wolf-Rayet stars, supergiants 1 lo
3 30788 Sahai Post-AGB stars 24 lo
3 30869 Kastner B[e] stars 1 slhi, 8 lo
4 40031 Fazio/Reach Interstellar medium 2 lo
4 40149 Dwek SN 1987A 4 lo
4 40159 Kemper/Tielens Various (SAGE-Spec ) 197 lo
4 40604 Reynolds Supernova remnants 2 lo
4 40650 Looney Massive YSOs 8 hi, 331 slhi
5 50092 Gielen Post-AGB stars 10 lo
5 50147 Sloan Evolved stars 6 hi
5 50167 Clayton Red supergiants 7 lo
5 50338 Matsuura Post-AGB stars 23 lo, 1 slhi, 11 hi
5 50444 Dwek SN 1987A 3 hi, 2 lo
a‘hi’ indicates a spectrum taken in high-resolution mode High and/or Long-High), and ‘lo’ in low-resolution mode
(Short-Low and/or Long-(Short-Low). ‘slhi’ indicates a combination of data from theSpitzerShort-Low, Short-High and Long-High modules.
of the sky covered by the SAGE survey (Meixner et al. 2006), which fully encompasses the LMC. Most of the spectra cover the full∼5–37µm range of the low-resolution modules of the IRS, although some spectra are limited to the ∼5–14µm range and others use the high-resolution modules. In-cluded in this selection of 1080 high and low-resolution spectra were the 197 spectra obtained under the SAGE-Spec program (discussed in Pa-per I). The remainder comprised other science projects led by a variety of different Principal Investigators (PIs; see the list in Table 1), and were obtained with a diverse range of observing parameters. Additionally, 61 objects were ob-served with MIPS in SED mode, as part of the SAGE-Spec project. This gives a very low resolu-tion spectrum in the wavelength range 52–93µm. Those observations and objects are described fully by van Loon et al. (2010).
Kemper et al. (2010) describe how the IRS spec-tra were processed and calibrated. We reduced all the spectra using this method. In outline, the low-resolution spectra were extracted from spectral images using the tapered-column algo-rithm2. High-resolution spectra used full-slit ex-traction. All spectra were flux-calibrated using assumed truth spectra for the K giants HR 6348, HD 166780, and HD 173511, as described by Sloan et al. (2015). The scientific rationale for the obser-vations varied considerably among the programs; in some cases, the point sources we consider here were not even the primary target. Woods et al. (2011b) provide more detailed comments in the documentation accompanying the data.
The ∼300 spectra from program 40650 (PI: Looney) required special treatment, as they in-cluded low-resolution spectra from 5 to 14µm and high-resolution spectra from 10 to 37 µm. These segments were extracted with the tapered-column and full-slit algorithms, respectively, as for most of the spectra. Due to possible background con-tamination in the high-resolution data, the spectra were normalized to the 5–14 µm segments. For sources in this program that were not spatially extended, we also used optimally-extracted spec-tra from the CASSIS database (Combined Atlas
2Available in both the SMART (Spectroscopy Modeling Analysis and Reduction Tool; Higdon et al. 2004) and SPICE (SpitzerIRS Custom Extraction) data reduction packages.
of Spitzer IRS Sources; Lebouteiller et al. 2015). These spectra generally have higher signal/noise ratios than those produced by the other algo-rithms, because the optimal extractions exclude off-source data dominated by the sky and back-ground noise. They also have better backback-ground removal, which reduces the contributions of nebu-lar emission lines to the final spectra.
In total, 1080 spectra were obtained from 947 locations on the sky (i.e., there were 133 repeated observations, usually at a different resolution). In order to select spectra of point sources only, we matched the position of each extraction from the raw data (RA FOV, DEC FOV) to one of the SAGE point source catalogues (IRAC 3.6-8.0 µm and MIPS 24-160µm; see the SAGE documentation3)
or the catalogue of Gruendl & Chu (2009) which is based on aperture photometry. This recovers sources which are slightly extended in the IRAC bands (but are point-sources at 24µm) that were missed by the SAGE point source catalogues. We discarded any spectra without a 300 radius photo-metric match to an object in one of these cata-logues.
Using the IRAC coordinates, the Spitzer IRS spectra were matched by position to photome-try from point sources in complementary LMC surveys: the UBVI photometry comes from the Magellanic Clouds Photometric Survey (MCPS; Zaritsky et al. 2004); JHKs photometry comes
from both the Two Micron All Sky Survey cat-alogue (2MASS; Skrutskie et al. 2006) and the In-frared Survey Facility (IRSF) survey (Kato et al. 2007), and the PACS and SPIRE data from the HERITAGE Band-Matched catalogue (Seale et al. 2014). In general, positional matches were cho-sen to be the closest point source in each of these catalogues within 300 of the observed target. Ex-ceptions to this were the MIPS, PACS and SPIRE catalogues, where 500, 1000and 2000radii were used, respectively. This is due to the difference in spatial resolution between the surveys. This supplemen-tary data enabled us to construct a spectral energy distribution (SED) for each object, to aid in the classification process. The SEDs were checked to ensure a good match between the spectral data and the photometric data. Only in a few cases
3
http://irsa.ipac.caltech.edu/data/SPITZER/SAGE/doc/ SAGEDataProductsDescription_Sep09.pdf
was the next-nearest photometric match a better fit to the spectrum. Using this SED we also esti-mated a bolometric luminosity, which was useful in source classification.
In order to be as general as possible in our clas-sification, we classify the object shown in each point source spectrum. Where multiple spectra have been taken of one object, this redundancy gives an extra check, since all the classifications should agree, even if variations between spectra could exist, due to variability. We have identi-fied 816 point-source objects with spectra within the footprint of SAGE, although 27 objects were not detected by the IRS (the spectrum is without signal), resulting in a final count of 789 unique point-source objects with IRS spectra. We num-bered each of these LMC objects with an identi-fier (OBJID), from 1–789. Each individual IRS spectrum was also numbered with an identifier (SSID) from 1–197 for spectra discussed in Pa-per I, and from 4000–4817 for all other spectra. This numbering corresponds to that used in the SAGE-Spec database at IPAC.
Table 2 describes the columns of the online table which lists all the IRS staring-mode tar-gets in the LMC, the field-of-view (FOV) posi-tion, their spectral classificaposi-tion, bolometric mag-nitude, variability and other relevant information. The matching photometry for the IRS spectra is also given in the online table.
3. The classification method
We have classified the objects associated with the 1 080 IRS staring mode spectra in the footprint of the SAGE project, which covers the entirety of the LMC. The primary basis for this classifica-tion is theSpitzerspectrum itself, but we use the additional information provided by the SED, and also an estimate of the bolometric luminosity, and furthermore, we confirm our classification with a literature study when possible.
To add rigor to our classification method, we use a slightly modified version of the classifica-tion decision tree, as presented in Papers I and II. One proceeds through the tree, responding to theyesornoquestions in order to reach a termi-nal classification. Where questions cannot be an-swered, e.g., when some part of the required data is not available (for instance, longer wavelength
data from the IRS Long Low modules), one may be left with a number of potential classifications, which can be constrained with a literature search, or comparison with similar spectra.
The final classification groups, with a tally of each class of object are listed in Table 3. An ex-planation of these groups follows:
YSO-1. These objects are embedded young stellar objects (YSOs), which display spectral fea-tures due to ices: molecules adsorbed onto the sur-face of dust grains, that indicate a cold, shielded and relatively dense environment. A detailed de-scription of the ice features found in the IRS spec-tral range can be found in Oliveira et al. (2011) and references therein; we summarise the main features here. A relatively narrow absorption fea-ture close to 15.2µm is attributed to CO2ice; the
structure and width of the feature is determined by the composition and physical conditions in the ice mantles. The broad and sub-structured fea-ture between 5–7µm is dominated by the contri-bution of water (the most abundant ice species in YSO environments and the quiescent interstel-lar medium) at 6µm. Other molecular species that contribute to this broad complex are am-monium (NH+4, possibly the main contributor to the absorption at 6.8µm), formic acid (HCOOH), formaldehyde (H2CO), and ammonia (NH3).
Ob-jects in this class may also show refractory dust features in their spectra.
YSO-2. These YSOs are more evolved than
YSO-1s, either having removed some of their sur-rounding circumstellar envelopes or heated it up sufficiently to destroy icy mantles. Dust features are present, typically silicate absorption seen as a characteristic broad dip in the spectrum around 10µm.
YSO-3. YSO-3s are the most evolved stage of massive YSO, where the envelope may have largely dispersed, and the YSO is beginning to ionize its surrounding region. This evolutionary stage man-ifests itself in strong PAH emission (at 3.3, 6.2, 7.7, 8.6, 11.2, 12.7 and 16.4µm), but with no other features such as atomic emission lines, usually su-perposed on a rising dust continuum (inFνversus
λspace) over the whole IRS range.
Hii region. Hii regions are characterised by atomic emission lines in their spectra, which may also contain PAH emission features. The class
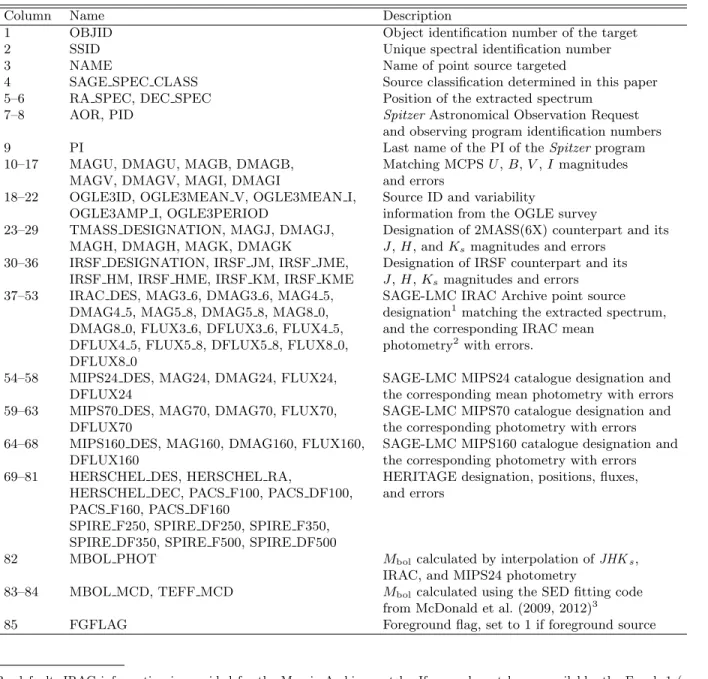
Table 2: Numbering, names and description of the columns present in the classification table which is available on-line only.
Column Name Description
1 OBJID Object identification number of the target
2 SSID Unique spectral identification number
3 NAME Name of point source targeted
4 SAGE SPEC CLASS Source classification determined in this paper
5–6 RA SPEC, DEC SPEC Position of the extracted spectrum
7–8 AOR, PID SpitzerAstronomical Observation Request
and observing program identification numbers
9 PI Last name of the PI of theSpitzerprogram
10–17 MAGU, DMAGU, MAGB, DMAGB, Matching MCPSU,B,V,Imagnitudes
MAGV, DMAGV, MAGI, DMAGI and errors
18–22 OGLE3ID, OGLE3MEAN V, OGLE3MEAN I, Source ID and variability
OGLE3AMP I, OGLE3PERIOD information from the OGLE survey
23–29 TMASS DESIGNATION, MAGJ, DMAGJ, Designation of 2MASS(6X) counterpart and its MAGH, DMAGH, MAGK, DMAGK J,H, andKs magnitudes and errors
30–36 IRSF DESIGNATION, IRSF JM, IRSF JME, Designation of IRSF counterpart and its IRSF HM, IRSF HME, IRSF KM, IRSF KME J,H,Ks magnitudes and errors
37–53 IRAC DES, MAG3 6, DMAG3 6, MAG4 5, SAGE-LMC IRAC Archive point source DMAG4 5, MAG5 8, DMAG5 8, MAG8 0, designation1matching the extracted spectrum, DMAG8 0, FLUX3 6, DFLUX3 6, FLUX4 5, and the corresponding IRAC mean
DFLUX4 5, FLUX5 8, DFLUX5 8, FLUX8 0, photometry2with errors. DFLUX8 0
54–58 MIPS24 DES, MAG24, DMAG24, FLUX24, SAGE-LMC MIPS24 catalogue designation and
DFLUX24 the corresponding mean photometry with errors
59–63 MIPS70 DES, MAG70, DMAG70, FLUX70, SAGE-LMC MIPS70 catalogue designation and
DFLUX70 the corresponding photometry with errors
64–68 MIPS160 DES, MAG160, DMAG160, FLUX160, SAGE-LMC MIPS160 catalogue designation and
DFLUX160 the corresponding photometry with errors
69–81 HERSCHEL DES, HERSCHEL RA, HERITAGE designation, positions, fluxes, HERSCHEL DEC, PACS F100, PACS DF100, and errors
PACS F160, PACS DF160
SPIRE F250, SPIRE DF250, SPIRE F350, SPIRE DF350, SPIRE F500, SPIRE DF500
82 MBOL PHOT Mbolcalculated by interpolation ofJHKs,
IRAC, and MIPS24 photometry
83–84 MBOL MCD, TEFF MCD Mbolcalculated using the SED fitting code
from McDonald et al. (2009, 2012)3
85 FGFLAG Foreground flag, set to 1 if foreground source
1By default, IRAC information is provided for the Mosaic Archive match. If no such match was available, the Epoch 1 (or, failing that, Epoch 2) information is provided instead.
2All flux densities in this table are in Jy. 3Only good fits are included.
of Hii region includes both compact Hii regions (dense regions of size ∼1 pc surrounding emerg-ing massive stars) and more classical Hii regions (more diffuse regions of size on the order of several parsecs, ionized by single or multiple massive stars in the near vicinity). Even though a rising con-tinuum, indicative of the presence of a significant amount of dust, could hint at a compact younger source, these two types cannot easily be distin-guished based on IRS spectra alone. For classi-fication purposes, the distinction between sources classed as YSO-3 and (PAH-rich) Hii is the pres-ence of atomic emission lines. (Hii sources are distinguished from PNe by the shape of the contin-uum or the presence of higher excitation emission lines.) For more diffuse Hiiregions the continuum may be due to free-free emission not dust, making them strong radio emitters.
Hii/YSO-3. As mentioned above the distinc-tion between the YSO-3 and Hii region classes is not straightforward. Furthermore, telescope reso-lution and sensitivity limitations make it very diffi-cult to separate the contributions to the spectrum of a point source and the wider energetic environ-ment, especially in complex regions of high back-ground. Thus sources in this intermediate class share properties with both the YSO-3s and ultra-compact Hiiregions classes, and could not be cat-egorically be placed in either class.
YSO-4. This class is composed of sources with a 10µm silicate emission feature usually super-posed on a moderately rising continuum over the IRS range. These objects are expected to be ana-logues of Galactic Herbig Ae/Be (HAeBe) objects.
Star. The star classification contains dust-less objects which show approximately blackbody spectra, with SEDs which peak shortwards of 2µm. The class contains both hot massive stars and low-mass dustless (red giant branch) stars. Low-mass stars on the Main Sequence are not bright enough in the IR to be detected by Spitzer at the distance of the LMC.
O-AGB, O-PAGB, O-PN. These categories contain evolved stars showing the presence of oxygen-rich dust in their spectra. The O-AGB
category contains objects which in general have a blackbody-like SED, with superimposed dust or molecular features: either an absorption feature due to SiO close to 8µm (O-EAGB; Ruffle et al. 2015), or the more common 10 and 20µm features
due to silicate dust. Stars which are less lumi-nous than the traditional AGB luminosity limit of Mbol =−7.1 are put into this category, whilst
similar but more luminous SEDs are classified as
RSG(see below).
O-PAGB objects show oxygen-rich dust spec-tral features, but their SED features two distinct peaks, one due to the stellar emission, and one due to the cooler dust contained in a disk or detached shell. RV Taustars are a sub-category of O-PAGB
stars that are identified by the distinct variabil-ity pattern of their lightcurves and chemical de-pletions in the photospheres of these objects (see e.g., Gielen et al. 2009). Due to the limits of RV Tauri studies, there may be unidentified RV Tauri stars included in ourO-PAGBcategory.
O-PN objects exhibit a rising continuum up to
∼30µm, but then a decreasing continuum. They show atomic emission lines, particularly the [Oiv] line at 25.913µm, and an absence of PAH features. Their spectra may include 10 and 20µm silicate features. O-PNe are distinguished from Hiiregions by the presence of high-excitation lines (e.g., [Ne
v], [Nevi]) in the spectrum of the former, but not
the latter.
RSG. The spectra of red supergiants exhibit oxygen-rich dust features similar to O-AGB stars. Due to their large mass (>8M) they are
gener-ally more luminous than AGB stars (Wood et al. 1983) and for the purposes of our classification have either a bolometric luminosity of Mbol <
−7.1, reside in a young cluster (<55 Myr; Schaller et al. 1992), or show no large-amplitude variabil-ity.
C-AGB, C-PAGB, C-PN. These three cat-egories encompass carbon-rich evolved stars, usu-ally identified by molecular absorption features, most notably C2H2 (acetylene) at 7.5µm and
13.7µm, and dust features at 11.3µm (SiC), 21µm (unknown carrier) and 30µm (MgS). In addi-tion, these sources may exhibit PAH or related molecular emission lines in their spectra, which in planetary nebulae seem to indicate a carbon-rich (Stanghellini et al. 2007) or carbon-enhanced (Guzman-Ramirez et al. 2014) nebula. C-AGBs of-ten have a broad and red SED, characterised by acetylene absorption features and/or an SiC fea-ture. C-PAGBs exhibit a double-peaked SED, with a strong 30µm feature or a 21µm feature (Volk et al. 2011). C-PNe show atomic emission lines
and the presence of PAH features; a 30µm feature may also be seen.
RCrB. R Coronae Borealis stars are a class of carbon-rich supergiant stars, which are rare in the Galaxy (over 100 are now known), but which may be more common in the LMC (about 20 have been discovered; Clayton 2012; Tisserand et al. 2013, 2017 in prep.). These objects have unusual in-frared spectra, showing few features apart from a very cool continuum (due to very hot dust), with an SED that peaks at wavelengths longer than 2µm (e.g., Kraemer et al. 2005). Candi-dates are confirmed through other means, includ-ing analysis of lightcurves, which show irregular and fast declines in brightness (up to 9 visible magnitudes; Clayton 1996) thought to be caused by episodic ejections of carbon dust which occlude the starlight.
GAL. Galaxies show a variety of red-shifted features in their spectra, including atomic emis-sion lines and oxygen-rich dust features.
Other. OTHERis a catch-all class which incor-porates objects we have been able to classify, but which are rare in the present sample. We find a small number of Luminous Blue Variable (LBV) stars, B[e] stars, Wolf-Rayet stars, supernova rem-nants, blue supergiants, a yellow supergiant and a nova. In many cases, these spectra are not satis-factorily classified by the decision tree, and instead are classified with reference to the literature.
The SEDs of LBVs and blue supergiants gener-ally show the short wavelength characteristics of a hot star (hence the ‘blue’), coupled with a dra-matic rise at longer wavelengths, with a minimum at∼10µm. They exhibit erratic variability. Wolf– Rayet stars present an infrared spectrum which shows the presence of a hot star, as well as atomic emission lines and in some cases, a large amount of warm dust. B[e] stars are young supergiants characterised by forbidden line emission and an infrared dust excess (Lamers et al. 1998; Kastner et al. 2010). They often show oxygen-rich dust fea-tures, with signs of crystallinity, and weak emis-sion lines, and in the infrared, may be confused with oxygen-rich giant stars.
UNK. Point-source objects which we are not able to classify are placed into theUNK(unknown) category. There are many reasons that an object may not be reliably classified, including
incom-plete data, unusual (and therefore unrecognised) object, data issues. We say a few words about these individual objects in Sect. 4.10.
3.1. Bolometric luminosities
Bolometric luminosities (Mbol) were calculated
via a trapezoidal integration of the SED over the range of available photometric points (typ-ically U-band to IRAC 8µm or MIPS 24µm) and compared with published values (e.g., Srini-vasan et al. 2009; Groenewegen et al. 2009; Jones et al. 2012; Riebel et al. 2012). For stellar photo-spheres and oxygen-rich evolved sources with lit-tle infrared excess, bolometric magnitudes were also calculated using the SED-fitting code of Mc-Donald et al. (2009, 2012). This code performs a
χ2-minimisation between the observed SED
(cor-rected for interstellar reddening) and a grid of
bt-settl stellar atmosphere models (Allard et al.
2011) which are scaled in flux to derive a bolo-metric luminosity. This provides a better χ2 fit to the optical and near-IR photometry than fit-ting a Planck function. For the most enshrouded stars, fitting the SED with ‘naked’ stellar photo-sphere models leads to a under-estimation of the temperature and luminosity due to circumstellar reddening and hence this method is not preferred for very dusty sources. For the redder sources the values calculated by trapezoidal integration pro-vide a lower limit estimate ofMbol.
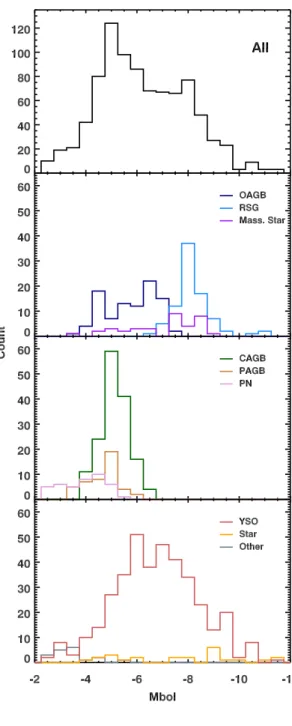
Figure 1 shows luminosity functions for AGB stars, RSGs, post-AGB stars, massive stars and YSOs for which IRS spectra are available. The oxygen-rich AGB distribution is double peaked; this is due to low-mass O-AGB stars at the faint end of the distribution, and massive O-AGBs (M > 5M) currently undergoing hot bottom
burning at the brighter end. A luminosity cut at
Mbol = −7.1 is used to distinguish between the
RSG and massive O-AGB stars. Stars brighter than Mbol = −12.0 are classified as foreground
sources. In the LMC, carbon stars form in the mass range 1.5–4.0 M, and this effect can be
seen in their narrow luminosity distribution, which peaks at the minima (Mbol = −5) of the
O-AGB stars’ distribution. The YSOs in our sam-ple have a broad spread in luminosity. This can be used as a proxy for the YSOs’ mass distribu-tion, with the brightest sources corresponding to high-mass YSOs, while the fainter sources are less
massive. Background galaxies, PNe, and objects of unknown spectral type are the faintest classes of objects within our sample. The bolometric lu-minosities for background galaxies have not been corrected for distance; if this were accounted for, they would become by far the most luminous ob-jects in our sample.
3.2. Foreground sources
To check for foreground sources, we performed a SIMBAD search using a 300radius for each source in our sample. We tag as foreground candidates any sources that have a SIMBAD match with a ra-dial velocity outside the range 150–450 km s−1
de-termined by Neugent et al. (2012) for LMC stars, and include sources for which our bolometric lu-minosities are above−12.0 mag (see previous sec-tion). There are 19 foreground objects in our sam-ple; these sources have been flagged as foreground in the online table and have been classified by us as stellar photospheres or O-AGB stars.
3.3. Variability
To aid in the classification, a literature search was conducted to compile variability information. The IRS sample was matched to the Optical Grav-itational Lensing Experiment (OGLE-III) cata-logue of variable stars (Soszy´nski et al. 2008) and the catalogues of Vijh et al. (2009) and Groenewe-gen et al. (2009).
Vijh et al. (2009) identified IR variable sources using 2 epochs of data from the SAGE catalogue, including 99 AGB stars, six massive stars and four variable YSOs from the SAGE-Spec sample. The sample of Groenewegen et al. (2009) has 130 matches to our catalogue, all of which are AGB stars. They determine pulsation periods for 105 of these sources.
4. Presentation of the classification
The 1 080 spectra in our IRS sample are com-prised substantially of YSO and Hii regions (see Table 3): there are nearly 300 spectra of these types of object. A significant proportion of the re-mainder is made up of various evolutionary stages of post-Main Sequence low-mass stars: (post-)AGB stars and planetary nebulae are represented by 327 spectra between them. Massive stars con-tribute largely to the remnants: 71 RSGs and a
Fig. 1.— Bolometric magnitudes for the LMC spectral sample.
Table 3: Spectral classification groups and source counts
Main Sub- Object type #
class class
YSO-1 Young stellar object 53
YSO-2 Young stellar object 14
YSO-3 Young stellar object 80
Hii/YSO-3 Probable evolved YSO 35
YSO-4 Herbig AeBe object 21
Hii Hii region (including compact) 134
STAR Stellar photosphere 30
RSG Red supergiant 71
C-AGB C-rich AGB star 148
O-AGB O-rich AGB star 77
C-PAGB C-rich post-AGB star 19
O-PAGB O-rich post-AGB star 23
C-PN C-rich planetary nebula 13
O-PN O-rich planetary nebula 28
RCrB R Coronae Borealis star 6
GAL Galaxy 8
UNK Object of unknown type 5
OTHER Object of known type 24
— B[e] B[e] star 8
— BSG Blue Supergiant Star 2
— LBV Luminous Blue Variable 3
— YSG Yellow Supergiant Star 1
— WR Wolf-Rayet star 7
— Nova Nova 1
— SNR Supernova remnant 2
proportion of theSTARclass. Of course, this sam-ple is heavily biased by the science goals of the projects listed in Table 1. The YSO spectra are predominantly a product of program 40650 (PI: Looney), a catalogue of YSO spectra in the LMC published initially by Seale et al. (2009). This was a targeted program, drawing heavily from the catalogues of YSO candidates produced by Gru-endl & Chu (2009). Various evolved low- and intermediate- mass stars and RSGs appeared in program 3426 (PI: Kastner), which targeted the most luminous 8µm sources in the LMC, pre-sented in a series of papers (Buchanan et al. 2006; Kastner et al. 2008; Buchanan et al. 2009). Other programs with a high contingent of AGB stars in-clude PIDs 3505 (PI: Wood) and 3591 (PI: Kem-per). Post-AGB spectra come from PIDs 30788 (PI: Sahai) and 50338 (PI: Matsuura, Matsuura et al. 2014), while spectra of planetary nebulae are the result of PIDs 103 (PI: Bernard-Salas) and 20443 (PI: Stanghellini). The 197 SAGE-Spec spectra of various targeted objects resulting from PID 40159 (PI: Kemper/Tielens) are pre-sented by Kemper et al. (2010), in Paper I and in various other publications.
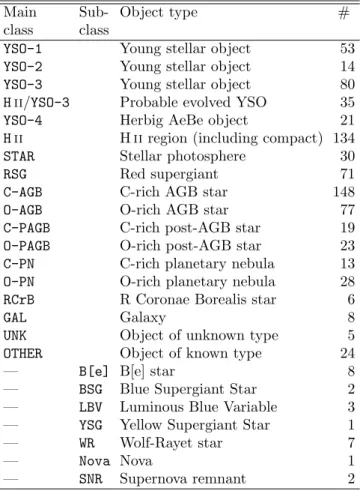
Figure 2 shows that sources are distributed widely over the area of sky covering the LMC, with only a slight increase in density in the region of the stellar bar of the LMC. The star-forming regions of 30 Dor, N11 and N79 are well sampled. A loose cluster of stars is located towards the northeast of the LMC, the majority of which are foreground objects.
In the subsections below, we analyse the preva-lent shapes and features of the spectra in different classification groups. Some classification groups are large enough such that sub-classes can be iden-tified, based on nuances of the spectra. For each class or sub-class both a weighted mean and me-dian spectra were determined. This accounts for the varying signal-to-noise in the spectra and the non-uniform resolution and wavelength coverage of each spectrum in that class. Each general class of object is discussed in detail below.
4.1. The YSO sample and Hii regions
The classification scheme described in Section 3 can be understood in terms of an evolutionary sequence for massive YSOs, with the YSO-1 and
YSO-2 classes representing the earlier, more
4h30m
5h00m
30m
6h00m
30m
RA (J2000)
-72°00'
-70°00'
-68°00'
-66°00'
-64°00'
De
c (
J20
00
)
IRAC 8.0
µ
m
YSOs & H II
C-rich evolved
O-rich evolved
RSG
Stars
Gal
Other
Fig. 2.— The distribution of Spitzer staring-mode observations plotted over the SAGE 8 µm sky map. Different groups are given different colours: YSO (YSO-1, YSO-2, YSO-3, YSO-4, Hii), red; C-evolved
(C-AGB, C-PAGB, C-PN), green; O-evolved (O-AGB, O-PAGB, O-PN), navy; RSG, cyan; STAR, orange; GAL, pink; andOther, magenta. Only observations of point sources are shown.
Fig. 3.— Mean (red line) and median (blue line) spectra for the YSO-1 (top) and YSO-2 (bottom) classes. The distinctive 15µm (YSO-1) and 10µm (YSO-2) absorption features can be seen. The grey lines show the spectral diversity within each class.
Fig. 4.— Averaged spectra for the YSO-3
(top) and YSO-4 (bottom) classes. Characteris-tic UIR/PAH features are seen in theYSO-3 spec-trum, whilst YSO-4s show significant 10 µm fea-tures on a rising spectrum at longer wavelengths.
Fig. 5.— Averaged spectra for the Hii (top) and
Hii /YSO-3 (bottom) classes. The spectra have UV-pumped PAHs and fine-structure atomic emis-sion lines.
bedded stages. As the young massive objects evolve, they start to interact with and shape their environments, creating ultra-compact or compact Hii regions; such objects populate the YSO-3
class. However, several factors make a classifica-tion based on IRS spectra alone complicated for YSOs (see also the discussion in Oliveira et al. 2013, and Seale et al. 2009). The IRS angular resolution varies between 3 and 1000; at the dis-tance of the LMC, this corresponds to 0.6–2.4 pc. As shown recently by Ward et al. (2016, 2017) for a small sample of YSOs in the SMC, Spitzer -identified YSOs can be further resolved into mul-tiple sources of different masses (and inferred evo-lutionary stages) when observed at higher spatial resolution. Furthermore, in these complex envi-ronments often there is a strong environmental contribution to PAH and fine-structure emission that cannot be disentangled, and the IRS spectra sample different spatial scales at different wave-lengths. As a result, objects with similar IRS clas-sifications can reveal different spectral properties when studied in more detail.
Another potential complication arises from the intrinsic phenomenological overlap between the
YSO-3 and Hii classes. Since compact Hii re-gions are powered by young massive YSOs, the separation between the classes is somewhat arti-ficial. Indeed Seale et al. (2009) include emission line objects in their sample of LMC YSOs (their classes PE and E, see discussion below), and so do Oliveira et al. (2013) for a sample of SMC YSOs. There are a number of sources that we could not unambiguously classify as YSO-3 or Hii and are thus placed in an intermediate class YSO-3/Hii. Therefore both the YSO and Hii classes are dis-cussed in this section.
Galactic HAeBe objects exhibit a great variety of spectral and SED properties, reflecting effects like disk geometry, evolutionary stage and miner-alogy (see e.g. Acke & van den Ancker 2004 and Keller et al. 2008, for studies using ISOand IRS spectra respectively). Most sources exhibit silicate in emission at 10µm, but occasionally this feature is seen in absorption or it is absent altogether. Many sources exhibit PAH emission but not all. The continuum can either rise over the IRS range or be somewhat flatter. Based on the sources analysed by Keller et al. (2008, their Fig.1), our decision tree would classify sources with silicate
emission as YSO-4; however sources with a flat-ter/falling SED could also be placed in theO-AGB class. Sources dominated by PAH emission would be classified as YSO-3, while sources with essen-tially a featureless continuum over the IRS range would be difficult to classify. Only abundant an-cillary data would be able to refine these classifi-cations. Therefore, the sources classified asYSO-4
are Magellanic analogues of Galactic HAeBes, but constitute a somewhat restricted sample.
There are over 300 spectroscopically-confirmed YSOs in the LMC, selected from large photomet-ric samples (Whitney et al. 2008; Gruendl & Chu 2009). The first massive YSO spectroscopically identified in any extragalactic environment was a serendipitous discovery by van Loon et al. (2005b) using IRS and VLT-ISAAC spectra. The over-whelming majority of spectroscopic YSOs have been studied using IRS by Seale et al. (2009, 2011), Oliveira et al. (2009, 2011) and by us in Paper I. A smaller sample usingAKARI spectra was anal-ysed by Shimonishi et al. (2010, and references therein).
The objects analysed by Oliveira et al. (2009, 2011) were classified in Paper I, following the same classification scheme described here. The sam-ple of Seale et al. (2009) includes 294 sources, of which 277 objects were classified as YSOs. Their classification scheme made use of spectral features (PAH and fine-structure emission, and silicate ab-sorption) to classify the objects using principal component analysis (PCA). Accordingly they clas-sified YSOs as follows: S/SE (silicate absorp-tion dominated, without/with fine-structure emis-sion) respectively 12 and 5 sources; P/PE (PAH dominated without/with fine-structure emission) respectively 100 and 142 sources; 2 E sources (emission-line dominated); 11 F sources (weak fea-tures only), and 5 U sources (incomplete spec-tral range that does not allow PCA classification). Their sample also includes 8 type O sources (sili-cate in emission) that could be HAeBe analogues (not included in the 277-strong YSO sample). We reclassify all 277 sources according to our scheme. In total, 168 sources are classified as YSOs, respectively 53, 14, 80 and 21 in classes YSO-1,
YSO-2, YSO-3, YSO-4. Respectively 134 and 35 sources are classified as Hii andHii/YSO-3.
The Seale et al. (2009) classification does not make use of the ice features to classify YSOs (the
41 ice-rich sources from this sample are described in more detail by Seale et al. 2011). As a result the 53 most embedded and colder YSO-1 sources ended up in a variety of Seale’s classes mentioned above.
Without detailed spectral modeling it can be difficult to identify weak silicate absorption in a spectrum with PAH emission. MostYSO-2sources were previously classified by Seale et al. (2009) in the S (or SE) and P (or PE) groups; one addi-tional source was classified in the F group (weak features); another source was left unclassified.
Most YSO-3, Hii/YSO-3 and Hii sources from Seale’s sample belong to either the P (or PE) group, with a few sources belonging to E (emis-sion line) or F (weak features) groups. This rein-forces the idea of how difficult it is to classify more evolved YSOs and distinguish them from compact Hiiregions. Any user of the spectral classification discussed in this paper that is interested in YSOs should thus considerHii/YSO-3andHiisources as well.
Finally, those YSO-4 sources originating from Seale’s sample were either classified in groups O (silicate emission) or P. It should be noted that group O sources in Seale’s classification are not necessarily HAeBe analogues, they may be oxygen-rich AGB stars as discussed elsewhere in this paper.
4.2. The massive evolved star sample
The red supergiant (RSG) spectra which show strong 10- and 18 µm emission (Fig. 6) in many cases also show the presence of an 11.3 µm PAH feature. This feature has previously been observed in the spectra of five Galactic red supergiants (Sylvester et al. 1998; Verhoelst et al. 2009), in LMC supergiant Massey SMC 59803 (Sloan et al. 2008) and in four red supergiants in the SMC (Kraemer et al. 2017). It arises in a manner akin to the Pleiades effect, with the supergiants embed-ded in a thin cloud of diffuse material (Sheets et al. 2013; Adams et al. 2013). At distances of 50–60 kpc this emission cannot be resolved, but there is sufficient surrounding material so that PAH fea-tures are visible. Once PAH molecules are lib-erated from their matrix (requiring UV irradia-tion), the free-floating molecules themselves can be excited with optical radiation (c.f., Sloan et al.
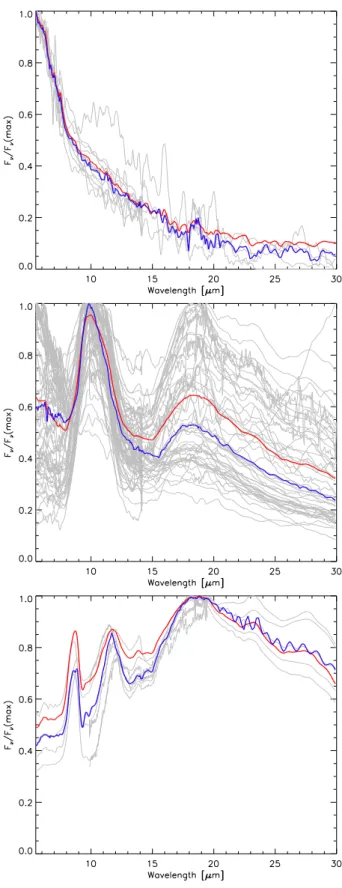
Fig. 6.— Averaged spectra for the RSGclass. The sample has been sub-divided into three classes: sources with little IR excess that show an inflec-tion at 8 µm due to SiO, or have a weak 10 µm emission feature (top); sources with strong 10-and 18µm silicate emission (middle); and sources which have silicate features in absorption (bot-tom).
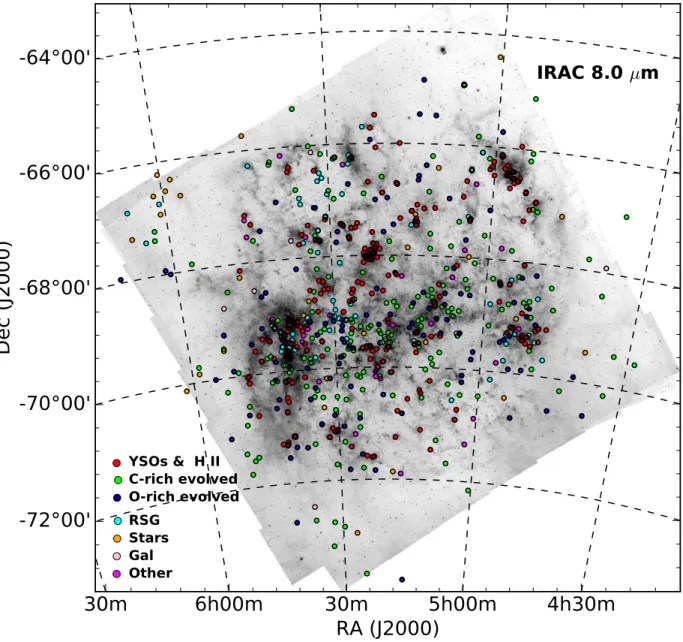
Fig. 7.— Averaged spectra for the B[e] class. Emission from amorphous and crystalline silicates are seen in the spectra.
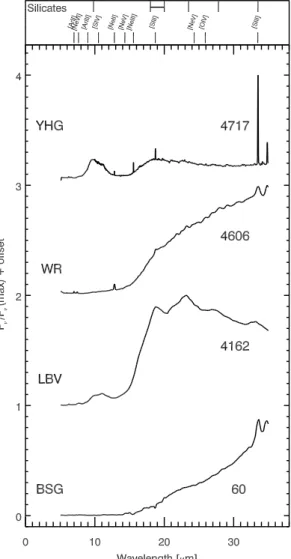
Fig. 8.— Example IRS spectra of objects in the massive star category. Shown here from bottom to top are the spectra of aBSG, aLBV, aWRstar and a YSG, labelled with their SSID number. The WR and the YSG stars have atomic lines in their spec-trum. Silicates are seen in the LBV spectra. The infrared excess in the WR star and BSG objects are caused by dust emission.
2007; Li & Draine 2002), although Verhoelst et al. (2009) argued that the PAH molecules are part of the RSG circumstellar environment. Other tral features occurring in some of the RSG spec-tra include crystalline silicates (Jones et al. 2012), most notably at 23µm, and atomic emission lines. While most spectra are of hot dusty objects, show-ing strong silicate features on top of an infrared ex-cess, in some cases, a steeply-rising continuum is visible, indicating the presence of colder detached dust shells, or ambient interstellar dust.
As with the YSOs, some of the Spitzer spec-troscopy presented in this paper has already been published previously, for instance in the studies by Buchanan et al. (2006, 2009). In their sample of 60 objects, the oxygen-rich objects are dominated by RSGs, and they arrived at a total count of 22 RSGs. Four objects have the physical appearance of an RSG, but their apparent brightness is such that if they were placed at the LMC distance, they would have unrealistic luminosities. Hence, the authors concluded that these objects (MSX LMC 412, 1150, 1677 and 1686) are foreground objects. Without distinguishing between AGB stars and RSGs, Sloan et al. (2008) presented 15 IRS spectra of oxygen-rich evolved stars in the LMC, and de-scribe the mineralogical spectral features in their spectra. They specifically mention the presence of crystalline silicates, and the currently unidentified 13 and 14µm features. Groenewegen et al. (2009) compiled a sample of several observing programs targeting RSGs and AGB stars in the LMC. They found that LMC RSGs have mass-loss rates very similar to Galactic RSGs (as determined by Ver-hoelst et al. 2009), a finding backed up recently by Goldman et al. (2017). Note, though, that Mau-ron & Josselin (2011) found that LMC mass-loss rates do not show the same behaviour as Galactic rates for RSGs. Jones et al. (2012) compiled all 71 IRS spectra of LMC RSGs as part of their larger sample to study the emergence of crystalline sili-cates in oxygen-rich dust shells. They found that 24% of their sample of RSGs in the LMC, SMC and Milky Way show crystalline silicates, versus 56% for O-rich AGB stars.
The more deeply-embedded RSGs have very red SEDs, which made them excellent targets for far-infrared follow-up. Indeed, the MIPS-SED sam-ple of the SAGE-Spec program included two of the most extreme RSGs: WOH G64 and IRAS
6910 (van Loon et al. 2010). IRAS 05280-6910 was also detected as a point source in the first data release of the HERITAGEHerschel sur-vey of the LMC (Boyer et al. 2010), with a ra-diative transfer model reproducing the 10µm sili-cate feature in absorption. A further two extreme RSGs were detected withHerschel, the aforemen-tioned WOH G64 and IRAS 05346-6949 (Jones et al. 2015), with WOH G64 considered to be pos-sibly the largest star known (Levesque et al. 2009), having an extremely dense circumstellar dust shell (Ohnaka et al. 2008). For further background on these extremely embedded RSGs, Jones et al. (2015) provide a detailed literature study.
Three LBVs were observed with the IRS in the LMC: S Dor, R 71, and R 110. This category typ-ifies how ancillary information from the literature was used to classify the sources. All were placed in theOTHERcategory, and none of their IRS spec-tra look alike. S Dor, the prototype LBV, shows a largely featureless, cool dust spectrum with a few weak forbidden lines. It also has (blue) contin-uum emission for <8µm either from warm dust or perhaps the star itself. R 71 also has a cool dust spectrum, but has prominent crystalline sil-icate features (Voors et al. 1999), as well as PAH emission (Guha Niyogi et al. 2014). R 110 has weak blue continuum emission with a rich set of PAH features and a sharply rising continuum be-yond 20µm indicative of cold dust.
Several Wolf-Rayet (WR) stars were observed with the IRS in the LMC, and they are grouped together here based on their known optical classifi-cations. All show emission lines in their IRS spec-tra, either fine-structure lines or hydrogen recom-bination lines. At least two have emission from crystalline silicates at 23 and 33µm. All have ris-ing spectra at longer wavelengths (>14 µm), in-dicative of cool dust. One, Brey 13, also has a falling continuum in the 5–14µm regime from ei-ther warmer dust or a stellar continuum; this star also shows the strongest hydrogen recombination lines.
B[e] stars are young supergiants characterised by strong Balmer line emission, low excitation per-mitted lines (e.g., Fe II), forbidden [Fe II] and [O I] optical lines, and a strong infrared excess from dust emission. Supergiant B[e] stars have a lu-minosity ≥ 104 L (Lamers et al. 1998). The
mid-infrared spectra of B[e] supergiant stars show
emission from silicate dust and occasionally PAHs (see Kastner et al. 2010). This circumstellar dust emission originates in flattened structures that were originally thought to be expanding along the equatorial plane (e.g., Zickgraf et al. 1986) but are instead, at least in some cases, circumstellar disks orbiting the B[e] supergiants. Such a disk might be the result of mass that was ejected by the B[e] star during a prior red supergiant phase and subsequently trapped into circumbinary or-bit by a lower-mass companion star (Kraus et al. 2010; Kastner et al. 2010).
Our sample includes nine B[e] stars. Opti-cal spectroscopy indicates that eight are super-giant B[e] stars (Lamers et al. 1998; Gummers-bach et al. 1995; Kastner et al. 2010), and the ninth, IRAS 04530-6916 (OBJID 239), is a star with B[e] emission characteristics (van Loon et al. 2005a). However, as van Loon et al. (2010) note, this object also has the characteristics of an Hii region (red continuum with strong PAH emission, amorphous silicate absorption, and low-excitation atomic emission lines), so its classification is less certain (see also the discussion in Sloan et al. 2008, on this source).
Kastner et al. (2006) find the infrared excess lu-minosities of RMC 126 and RMC 66 to be about 5% and 18% of their measured bolometric lumi-nosities, such that the stellar flux contributes neg-ligibly to the total emission at IRS wavelengths. Though many permitted and forbidden emission lines are seen in optical spectra of B[e] stars, al-most no such lines are seen in the mid-infrared. However, Kastner et al. (2006) note the IRS spec-trum of RMC 126 shows a 7.46 µm Pfund-alpha emission line, whilst HD 38489 (OBJID 715) ex-hibits some low-excitation atomic emission lines (e.g., [Ne III] and [S III]).
Our sample also includes two B supergiants (BSGs) and a yellow supergiant (YSG). The BSGs (OBJID 50 and 69) were discussed in Paper I; these stars have spectra which rise longward of 15 µm due to dust emission and their SEDs are double-peaked falling to a minimum at ∼8µm. Surprisingly, far-IR dust emission from BSDL 923 (OBJID 69) was detected by Jones et al. (2015); this could again be the Pleiades effect (Sheets et al. 2013; Adams et al. 2013) or cold dust emission due to a circumstellar disk or torus surrounding the central star.
HD 269953 (OBJID 713) is a well studied YSG. It is a confirmed post-RSG object (Oksala et al. 2013) and is amongst the brightest (Mbol∼ −9.4)
stars in the LMC. Its circumstellar dust emission, first characterized by Roche et al. (1993), displays prominent emission bands at 10 and 18 µm due to amorphous silicate dust which may arise from a circumstellar disk. Also present in its spec-trum are crystalline silicate features at 11.3 and 23µm, although these are difficult to characterise at longer wavelengths due to fringing effects in the spectrum.
4.3. The oxygen-rich AGB sample
Seventy-eight uniqueO-AGBstars have been ob-served with the IRS in the LMC field; we have separated these sources into three groups based on the opacity of their circumstellar envelope at 10µm as shown in Figure 9.
There are sixteen early-type O-rich AGB stars (O-EAGB) in the LMC sample which do not show any evidence of dust features in their infrared spec-tra. O-EAGB stars have just recently initiated the thermally-pulsing-AGB phase of their evolu-tion and exhibit long-period variability. The vari-able early-type O-rich AGB stars are presumably more evolved than genuine early-AGB (E-AGB) stars, which do not exhibit long-period variability and have not yet started helium shell burning. The onset of pulsations in an AGB star coincides with the beginning of significant dust formation and a slight infrared excess may be visible in the SED. O-EAGB stars can be identified from oxygen-rich molecular absorption features in their IR-spectra, notably the absorption feature at 8µm due to the SiO fundamental vibrational mode. Five of these sources have been characterised by Sloan et al. (2008) who find that the strength of the 8 µm absorption band from SiO decreases with lower metallicity.
Fifty-five sources have amorphous silicate emis-sion features at 10 and 18 µm, although there is a considerable spread in the peak strength, shape and width of these features. These AGB stars span a wide range in mass-loss rate (10−7− −10−5 Myr−1; Groenewegen et al. 2009; Riebel
et al. 2012; Jones et al. 2012) and the varia-tions in the IRS spectra can be attributed to the amount of dust in the circumstellar envelope and the presence of other dust components, such
Fig. 9.— Averaged spectra for the O-AGB class, split into sub-classes showing SiO molecular fea-tures (top), amorphous silicate emission (middle) and self-absorption (bottom). Crystalline silicates are present in the second and third subclasses.
as simple metal oxides. The dust composition of these sources is best fitted by amorphous sil-icates (with an olivine stoichiometric ratio), with appreciable amounts of amorphous alumina and additional, small contributions from metallic iron (Jones et al. 2014). Alumina makes up less than 50% of the dust composition and metallic iron is present at approximately the 4% level with the ex-ception of OBJID 182; it remains unclear why this source lacks metallic iron.
As the mass-loss rate increases and the dust shell becomes optically thick, the 10 µm feature goes into absorption. There are no spectra of LMC sources where the 10 µm is completely in absorp-tion, although six sources (OBJID 121, 204, 253, 599, 603, 694) have self-absorbed silicate features at 10µm. A number of other O-AGB spectra have 10µm features which might be starting to demon-strate signs of self-absorption. In these sources, the 10 µm feature has a relatively flat profile at the peak of the 10 µm dust feature. All sources with a 10µm feature in self-absorption have crys-talline silicate features at 23, 28 and 33µm (Jones et al. 2012).
In total, crystalline silicate features are ap-parent in 20 of the O-rich AGB star spec-tra. These sources have dust production rates
& 10−8 Myr−1. Like Galactic O-AGB stars
(c.f. Sylvester et al. 1999; Kemper et al. 2001), crystalline silicates are more prevalent in O-AGB stars with higher opacity dust shells. However, the composition of the crystalline silicate dust grains in the LMC sources is different from Galac-tic O-AGB stars, with Mg-rich pyroxenes (e.g. en-statite: MgSiO3) more prevalent than olivines
(e.g. forsterite: Mg2SiO4; Jones et al. 2012).
A narrow 13µm feature is conclusively seen in OBJID 265, 326 and 407 and may also be present in a number of other sources. Definitively detect-ing this dust feature is challengdetect-ing as such low-contrast emission features are difficult to sepa-rate from the noise. The 13 µm feature has also been reported in Galactic O-AGB stars (Sloan et al. 1996). This feature is caused by an Al-O stretching mode from corundum (Al2O3) or spinel
(MgAl2O3) grains (Posch et al. 1999; Fabian et al.
2001; Sloan et al. 2003; Lebzelter et al. 2006). There are two particularly intriguing O-rich AGB stars in the sample, corresponding to OB-JID 6 and 390. Both of these sources have a
promi-nent 10µm amorphous silicate feature which arises from the Si–O stretching mode. However, the 18
µm silicate feature due to the Si–O–Si bending mode in the SiO4 tetrahedral is absent from the
spectra. If the silicate dust has recently formed then the apparent absence of an 18 µm amor-phous silicate feature may be attributed to a lack of contrast with the local continuum (Jones et al. 2014). Alternatively, Gielen et al. (2011) propose that dust composed of only small 0.1µm Mg-rich olivine and alumina grains can result in the sup-pression of the 18 µm feature.
The unusual nature of SSTISAGEMC J051333.74-663419.1 (OBJID 6) is also evident in its optical spectrum. Although indicative of an F8–G0 giant, the optical spectrum also shows very strong Hi (6563 ˚A) and Hei(5876 ˚A) emission, and broad Caiiabsorption lines (van Aarle et al. 2011), sug-gesting that the star resides in a binary system with a hot companion.
4.4. The carbon-rich AGB sample
There are 148 carbon-rich AGB stars (C-AGB) in our sample. We divided the spectra into four smaller groups, based on their overall shape, from blue to red. This approach is equivalent to classi-fying by most mid-infrared colours, because they all tend to increase smoothly as the mass-loss rate increases. Our classifications correspond closely to the carbon-emission, or ‘CE’ classes introduced by Sloan et al. (2016), which should not be sur-prising because their CE classes are based on the [6.4]−[9.3] colours derived from the IRS spec-tra. Similarly, our classifications align with other colour-based classifications for the same reason, as discussed in Section 5.2.
Figure 10 (top) presents spectra from the first and second groups from the C-AGB sample. These correspond to CE0–2 and CE3–4 in the scheme by Sloan et al. (2016), respectively. The majority of the C-AGB sample fall into the first group, which is relatively blue and dominated by emission in the 5–12 µm region. In the first group, the C2H2
absorption bands at 7.5µm and 13.7µm are both strong, while the 30 µm emission feature is weak or absent. In the second, the 13.7 µm band is even stronger, and the 30 µm emission is growing stronger as well.
Figure 10 (bottom row) presents the third and
Fig. 10.— Averaged spectra for the C-AGB subclasses. Top: the first, or bluest, (CE0–2; left) and second (CE3–4; right)C-AGBspectral subclasses. The spectra are dominated by the emission in the 5–12µm region. Both the C2H2 bands at 7.5 µm and 13.7 µm are evident. Bottom row: Averaged spectra for the third
(VROs; right) and fourth, or reddest, (EROs; left) C-AGB spectral subclasses. These spectra can be quite red, with a SiC feature at 11.3µm in (self-)absorption and a 30µm emission feature.
fourth groups, which have been described, respec-tively, as ‘Very Red Objects’ (VROs) in Paper I and ‘Extremely Red Objects’ (EROs) by Gru-endl et al. (2008). Sloan et al. (2016) classify both groups as ‘CE5’, although it is evident here that the two groups can be distinguished meaningfully. The 30µm emission feature is strong in the VROs and is weaker in the EROs. The SiC feature at 11.3 µm is weak in the VROs, probably because it is in self-absorption, while in the EROs, it usu-ally appears as a clear absorption feature. The apparent weakness of the 7.5 µm C2H2 feature is
deceptive; Sloan et al. (2016) show that its equiva-lent width does not change across the classes from CE0 to CE5.
The primary difference from the first to the fourth group (or from CE0 to CE5) is the amount of carbon-rich dust in the source. However, the last two groups represent a major break in be-haviour from the first two. Sloan et al. (2016) showed that the pulsation amplitude of the cen-tral star increases from CE0 to CE4, but then falls in CE5 as the sources grow progressively redder. In addition, the reddest sources often show sur-prisingly blue colours at shorter wavelengths (such as J−K or [3.6]−[4.5]). Combined, these char-acteristics suggest that the stars are evolving off the AGB and the central star may be becoming visible through an increasingly asymmetric dust shell (Sloan et al. 2016). In that light, the EROs may be transition objects toward the C-PAGB group, and eventually the C-PN group. If these sources have asymmetric envelopes seen ‘edge-on’, it would cause exacerbated absorption without necessarily a larger amount of dust present.
4.5. The post-AGB and planetary nebula sample
We classify this group into post-AGB versus PN, which is an evolutionary sequence, and O-rich versus C-O-rich, which depends on the preced-ing evolution, givpreced-ing four distinct groups. PNe differ from post-AGB in having strong ionic emis-sion lines, but these may not always be obvious in the low-resolution IRS spectra, so that some known PNe are classified from the Spitzer spec-tra as post-AGB stars. Dust features in general provide a strong indication for the C-rich versus O-rich separation, but both groups can show PAH emission. PNe without distinguishing dust
fea-tures are classified as O-rich, and this group will include some objects where the gas is carbon-rich.
4.5.1. C-rich Sources
We have identified 19 PAGB stars and 13 C-PNe in our sample. The sample of carbon-rich post-AGB objects includes three optically iden-tified planetary nebulae (SMP LMC 8, 11 and 58) in addition to sixteen other post-AGB ob-jects earlier in their evolution off the AGB. All of the SMP LMC object spectra are discussed by Bernard-Salas et al. (2009) and by Sloan et al. (2014). The other post-AGB objects are discussed by Volk et al. (2011), Sloan et al. (2014) and Mat-suura et al. (2014). A few of these have optical spectroscopy and are A-type or F-type stars.
The C-PAGB stars include eight sources with a 21 µm feature (Kwok et al. 1989). This fea-ture is only found in carbon-rich post-AGB stars (Hrivnak et al. 2009); the carrier remains uniden-tified. Most sources also show a prominent, broad feature at 30 µm, seen exclusively in the spectra of AGB stars and PNe. This is commonly at-tributed to MgS (Goebel & Moseley 1985; Hony et al. 2002; Lombaert et al. 2012), but this is dis-puted (Zhang et al. 2009; Messenger et al. 2013) and other carriers have been suggested (e.g. Ot-suka et al. 2014). The integrated intensity cannot be well measured from IRS spectra as the band ex-tends beyond the available spectral range. If MgS is the correct identification, it must form a coating on the grains; there is some evidence for this from the fact that it only forms at low dust tempera-tures (Zijlstra et al. 2006; Leisenring et al. 2008). Matsuura et al. (2014) note that the composition of the PAHs in the spectra of carbon-rich evolved stars gradually changes as the central stars evolve from the post-AGB phase to a planetary nebula. This effect is more significant than any effects due to metallicity in determining the stars’ spectral appearance.
The strengths of the features that are seen in the average spectrum vary widely from source to source (Fig. 11). Only features due to PAHs are seen in all the spectra, whereas the SiC, 21, and 30
µm features are absent in some spectra. As a re-sult, while the average spectrum is somewhat rep-resentative it nonetheless shows some differences from any of the individual spectra. In particular the 21 µm feature objects generally have higher
Fig. 11.— Averaged spectra for theC-PAGB(top) and C-PN (bottom) classes. In the top panel, the 21µm feature only found in carbon-rich post-AGB stars can be clearly seen.
temperature continuum shapes than the average spectrum, due to a number of steeper continuum sources (i.e., generally more evolved sources) in the sample – including most of the optical plane-tary nebulae.
Three C-PAGB stars are classified in the opti-cal as PNe. The most peculiar object, SMP LMC 11 (OBJID 227), also known as LHA 120-N 78, shows an infrared spectrum that is very atypical of planetary nebulae or post-AGB objects in general (Bernard-Salas et al. 2006). It shows some fea-tures normally associated with C-rich AGB stars: strong molecular bands of C2H2and HCN are
vis-ible, on a fairly low temperature continuum, al-though not as low in temperature as is typical of post-AGB objects and planetary nebulae. But it also shows hydrocarbons up to benzene in absorp-tion (Bernard-Salas et al. 2006), with prominent bands 6.8 and 14.8 µm: these are never seen in AGB stars. SMP LMC 11 has similarity to the Galactic source CRL 618, and likely contains a dense carbon-rich disk, seen edge-on. A compre-hensive discussion of its circumstellar chemistry is given by Malek et al. (2012).
The other two sources optically identified as planetary nebulae (SMP LMC 8 and 58) have sim-ilar spectra, showing the 11.3µm SiC emission fea-ture on a lower temperafea-ture continuum and the nebular forbidden lines ([Neiii] 15.55 µm, [Neii] 12.81 µm, and others). The spectral shapes di-verge beyond 20µm. SMP LMC 58 shows a rather weak 30µm feature, while SMP LMC 8 does not show this feature. From the high resolution spec-tra SMP LMC 8 and SMP LMC 58 would cor-rectly be classified as planetary nebula due to the relatively strong nebular emission lines that are visible. However, the contrast between the emis-sion lines and the continuum is much less in the low resolution Spitzer spectra, and they are in-stead classified as C-PAGB stars according to the decision-tree.
PNe in the LMC are expected to be predomi-nantly carbon-rich, because the sub-Solar metal-licity moves the stellar mass range over which AGB stars become carbon rich (e.g. Renzini & Voli 1981; Karakas & Lattanzio 2014) to lower masses and it increases the C/O ratio. The main way to identify whether a PN is carbon-rich is from the presence of molecular and dust features. This works best for young, compact PNe since evolved
PNe lose their dust features (e.g. Stanghellini et al. 2007). It is more difficult to measure carbon abun-dances from optical emission lines only, and for PNe without dust, the C/O ratio is not always well known.
The distinguishing carbonaceous features are PAHs, fullerenes, SiC and the 30 µm feature. Molecular bands (apart from PAHs) are rare. PAH bands are common. The features are proba-bly due to a combination of aromatics and aliphat-ics, rather than pure PAHs (Kwok & Zhang 2011; Sloan et al. 2014). The PNe show evidence for structural evolutionary changes in the PAHs, re-lated to photo-processing (Matsuura et al. 2014) with increasing aliphatic content (Sloan et al. 2014).
PAHs are not confined to carbon-rich ob-jects. In oxygen-rich PN in the Galactic bulge, PAH bands have been seen to arise in dense tori (Guzman-Ramirez et al. 2014), and thus bipolar PNe have stronger PAH features. Stanghellini et al. (2007) find that the presence of a dense torus is less important for carbon-rich PNe than it is for oxygen-rich PNe. PAH formation rates in-crease strongly for higher C/O (Guzman-Ramirez et al. 2011), leading to stronger PAH bands for LMC PNe. One should not expect LMC PNe to be carbon-copies of their Galactic counterparts.
Fullerenes (C60 and C70) are relatively
com-mon in LMC PNe (Garc´ıa-Hern´andez et al. 2011). Their presence is indicated by four narrow emis-sion bands but two of these can be merged with strong nebular lines at the lowest IRS resolution. A 5th band at 6.49 µm (Sloan et al. 2014) may also be due to fullerenes (Brieva et al. 2016). PNe with fullerene emission tend to show small, photo-processed PAHs (Otsuka et al. 2014), although fullerenes can also be found in PNe without PAH emission (Sloan et al. 2014). Fullerenes are only seen in PNe with cool central stars (up to 40 000 K). At higher stellar temperatures the bands dis-appear, whilst PAH emission can remain, indicat-ing that fullerenes are more easily destroyed (Sloan et al. 2014).
The 11.3-µm SiC band in LMC PNe is fairly common, and can be extraordinarily strong (dubbed the ‘big-11’ feature by Sloan et al. 2014), sufficient to affect the IRAS 12-µm flux (Bernard-Salas et al. 2009). In contrast, SiC is rarely seen in Galactic PNe, in spite of the higher Si abundance. Sloan
et al. (2014) show that there is some PAH emis-sion included in the SiC band, but SiC accounts for 88% of the strength of the ‘big-11’ feature. The extreme strength may be due to photo-excitation, or because at a high C/O ratio SiC forms on the surface of carbon grains, rather than as the first condensate (Sloan et al. 2014). The SiC fea-tures disappear when lines with ionization po-tential above 55 eV appear (Bernard-Salas et al. 2009), and this seems to be the photo-dissociation energy for SiC. The ‘big-11’ sources can also show a broad band at 16-22 µm, which is unidentified. It is called the ’18-µm shoulder’ by Sloan et al. (2014).
4.5.2. O-rich Sources
There are 23 O-PAGB and RV Tau-type stars in our sample and 28 O-PNe. The O-PAGB group (Fig. 12) shows strong amorphous and crystalline silicate features superimposed on a low tempera-ture continuum. The 10 µm amorphous silicate feature is seen in all the spectra with some vari-ation in the width; this feature has a relatively flat-topped peak compared to the O-AGB stars (Fig. 9). In addition weak PAH features are seen, such as the 6.3 µm emission feature. There is a wide variation in the relative feature strengths of both the 10 and 18µm amorphous silicate features and the various crystalline silicate features.
The majority of the O-PAGB objects are dis-cussed by Gielen et al. (2011). That paper in-terprets the flat-topped silicate band as due to a combination of amorphous silicate, crystalline fos-terite (mainly at 11.3µm) and crystalline enstatite (9 µm). The 11.3µm/9.8µm flux ratio indicates the degree of crystallinity, which is high in these sources. The peak-to-continuum ratio is on aver-age around 1.5, which is low and indicates larger grains; a few of our sources show much higher ra-tios. The degree of crystallinity and grain size can result from dust processing in stable circumstellar disks (Gielen et al. 2009).
The O-PAGB sample includes nine RV Tau -type stars, which were identified from Harvard variable lists, MACHO light curves or the OGLE survey (i.e., Leavitt 1908; Payne-Gaposchkin 1971; Alcock et al. 1998; Soszy´nski et al. 2008). The mean spectrum from the RV Tauri group is rather similar to the mean spectrum from the other O-PAGB objects (Fig. 12), showing strong


![Fig. 7.— Averaged spectra for the B[e] class.](https://thumb-us.123doks.com/thumbv2/123dok_us/8284581.2193930/15.918.461.796.484.779/fig-averaged-spectra-for-the-b-e-class.webp)