THE 3C NUTRITION ANCILLARY STUDY: DESCRIBING THE INTEGRATION OF DIET AND DISEASE SELF-MANAGEMENT AMONG ADOLESCENTS AND ADULTS WITH
TYPE 1 DIABETES IN CHINA
Lindsay M. Jaacks
A dissertation submitted to the faculty at the University of North Carolina at Chapel Hill in partial fulfillment of the requirements for the degree of Doctor of Philosophy in the Department of
Nutrition (Epidemiology) in the Gillings School of Global Public Health.
Chapel Hill 2014
Approved by:
Elizabeth J. Mayer-Davis Barry M. Popkin
iii ABSTRACT
Lindsay M. Jaacks: The 3C Nutrition Ancillary Study: describing the integration of diet and disease self-management among adolescents and adults with type 1 diabetes in China
(Under the direction of Elizabeth J. Mayer-Davis)
The incidence of type 1 diabetes (T1D) is increasing in China and morbidity and
mortality may be substantially higher there than in the U.S. While results of clinical trials support intensive disease management to reduce the risk of complications, our knowledge of self-management practices in China is limited in scope and outdated.
In order to address this gap, a cross-sectional study was conducted in Beijing from January-August 2013. Data collection entailed a fasting blood draw, a questionnaire, and three 24-hour dietary recalls. Telephone administration of the 24-hour recalls was validated against in-person administration in a pilot study. Data on individuals without diabetes were from the China Health and Nutrition Survey. The aims were three-fold: among individuals with T1D in Beijing, 1) to describe the contribution of nutrition education to disease self-management and diet, 2) to compare their dietary intake to individuals without diabetes in Beijing, and 3) to use reduced rank regression to identify dietary pattern(s) that maximize the explained variation in key cardiometabolic risk factors.
iv
international Diabetes Associations. One effect of this was that participants with T1D had a significantly lower mean percentage of energy from carbohydrates and higher mean
percentages of energy from fat and protein compared to a cohort of individuals without diabetes in Beijing. Finally, we identified a dietary pattern characterized by high intakes of wheat products and low-sugar cakes, and low intakes of beans and pickled vegetables that was significantly associated with lower HbA1c and LDL cholesterol.
v
vi
ACKNOWLEDGEMENTS
I am indebted to the individuals with type 1 diabetes in Beijing and the surrounding area whose participation made this study possible, and to my interviewers: Yang Xiao, Jing Lv, Wenjia Yang, Jia Liu, Han Feifei, and Lihua Zhang. I would also like to thank Wei Liu, who was integral to completing data collection in Beijing. Finally, I would like to acknowledge Linong Ji, who first invited me to China to learn about a disease, and ended up teaching me about a culture.
vii PREFACE
Parts of this work were done in collaboration with other scientists. The 3C Nutrition Ancillary Study (3CNAS) was designed in collaboration with Linong Ji at Peking University People’s Hospital and with the help of Elizabeth Mayer-Davis, Barry Popkin, Shufa Du, and Michelle Mendez at The University of North Carolina, Chapel Hill. Wei Liu at Peking University People’s Hospital was a co-project manager throughout the duration of data collection and was in charge of verifying the translation and submitting necessary documents to the Peking
University Institutional Review Board. Without her ongoing assistance with data collection this project would not have been possible.
Chapters 2 and 3 contain material published prior to writing this dissertation with the following citation:
Jaacks LM, Liu W, Ji L,Mendez M,Du S,Crandell J,Rosamond W, Mayer-Davis EJ. Diabetes nutrition therapy and dietary intake among individuals with type 1 diabetes in China. Diabetic Medicine, 2014.
Permission to include the article in its entirety in a Ph.D. dissertation was retained from John Wiley & Sons, Inc. (publisher of Diabetic Medicine). All co-authors have given me permission to include this work in my dissertation.
Chapter 4 contains material accepted for publication in the Asia Pacific Journal of Clinical Nutrition published by HEC press. Chapter 5 represents unpublished research. I
viii
ix
TABLE OF CONTENTS
LIST OF TABLES ... xiii
LIST OF FIGURES ... xv
LIST OF ABBREVIATIONS ... xvi
CHAPTER 1: BACKGROUND AND RATIONALE ... 1
Section 1.1 Pathophysiology of type 1 diabetes ... 1
Section 1.1.1 Classification ... 1
Section 1.1.2 Etiology ... 2
Section 1.1.3 Diagnosis ... 2
Section 1.2 Epidemiology of type 1 diabetes ... 3
Section 1.2.1 Prevalence and incidence ... 3
Section 1.2.2 Long-term complications and mortality ... 5
Section 1.3 Treatment of type 1 diabetes... 7
Section 1.3.1 Self-monitoring of blood glucose and insulin therapy ... 8
Section 1.3.2 Diabetes nutrition therapy ... 9
Section 1.3.3 Comorbidities ...10
Section 1.4 Burden of type 1 diabetes in China ...11
Section 1.5 Type 1 diabetes treatment barriers in China ...12
Section 1.5.1 Limitations of healthcare providers and the healthcare system ...13
Section 1.5.2 Diabetes self-management education is difficult to obtain ...14
Section 1.5.3 Blood glucose monitoring and insulin regimens remain suboptimal ...15
x
Section 1.7 Need for Chinese standards of medical care for type 1 diabetes ...17
Section 1.7.1 Unique and dynamic Chinese food environment ...17
Section 1.7.2 Evidence of positive effect of recommendations in China ...20
Section 1.8 The 3C Nutrition Ancillary Study: improving our understanding of current self-management practices among adolescents and adults with type 1 diabetes in China ...20
CHAPTER 2: RELATIVE VALIDITY OF TELEPHONE VERSUS FACE-TO-FACE 24-HOUR DIETARY RECALLS IN ADULTS WITH TYPE 1 DIABETES IN CHINA ...22
2.1 Introduction ...22
2.2 Methods ...23
2.3 Results ...24
2.4 Discussion ...26
CHAPTER 3: DIABETES NUTRITION EDUCATION AND DIETARY INTAKE AMONG INDIVIDUALS WITH TYPE 1 DIABETES IN CHINA ...29
3.1 Introduction ...29
3.2 Methods ...30
3.2.1 Sample population ...30
3.2.2 Diabetes nutrition therapy assessment ...30
3.2.3 Dietary intake assessment ...31
3.2.4 Covariates ...31
3.2.5 Statistical analysis ...31
3.3 Results ...32
3.4 Discussion ...41
3.5 Supplemental figures and tables ...45
CHAPTER 4: COMPARISON OF THE DIETARY INTAKES OF INDIVIDUALS WITH AND WITHOUT TYPE 1 DIABETES IN CHINA ...50
4.1 Introduction ...50
4.2 Methods ...51
xi
4.2.2 Dietary intake assessment ...51
4.2.3 Covariate assessment ...52
4.2.4 Statistical analysis ...53
4.3 Results ...54
4.4 Discussion ...62
4.5 Supplemental figure ...67
CHAPTER 5: DIETARY PATTERNS ASSOCIATED WITH HBA1C AND LDL CHOLESTEROL AMONG INDIVIDUALS WITH TYPE 1 DIABETES IN CHINA ...68
5.1 Introduction ...68
5.2 Methods ...69
5.2.1 Sample population ...69
5.2.2 Data collection ...69
5.2.3 Statistical analysis ...71
5.3 Results ...72
5.4 Discussion ...81
5.5 Supplemental tables ...84
CHAPTER 6: CHALLENGES ...85
6.1 Data collection ...85
6.1.1 Institutional Review Board approval ...85
6.1.2 Recruitment...87
6.1.2.1 Following up with 3C Study participants ...87
6.1.2.2 Type 1 diabetes stigma ...87
6.1.3 Dietary assessment ...88
6.1.4 Conversion of food lists into nutrients ...91
6.2 Data analysis ...92
6.2.1 Small sample size ...92
xii
6.2.1.2 Implications for comparing 3CNAS to SEARCH for Diabetes in Youth ...95
6.2.2 Selection bias ...96
6.2.3 Dietary pattern analysis ... 100
6.2.3.1 Specification of predictor variables ... 100
6.2.3.2 Selection of predictor variables ... 104
6.2.3.3 Selection of response variables ... 107
CHAPTER 7: IMPLICATIONS AND FUTURE DIRECTIONS ... 108
7.1 Improving type 1 diabetes surveillance in China ... 108
7.2 Improving type 1 diabetes care in China ... 109
7.2.1 Summary of key 3CNAS results ... 109
7.2.2 Gaps that remain in addressing 3CNAS specific aims ... 110
7.2.3 Next research questions... 112
7.2.3.1 Improving training for healthcare providers ... 112
7.2.3.2 Stigma and psychosocial issues ... 114
7.2.3.3 Improving access to and use of glucose monitoring supplies ... 116
7.3 Translating results to type 1 diabetes in other resource-limited settings ... 117
7.4 Concluding remarks ... 119
xiii
LIST OF TABLES
Table 1.1 Age-specific glycemic control targets for individuals with type 1 diabetes ... 7 Table 1.2 Summary of the American Diabetes Association’s recommendations for self-monitoring of blood glucose (SMBG), HbA1c testing, and insulin therapy for patients with type 1 diabetes ... 9 Table 1.3 Summary of reported dietary intakes of populations in China ...19 Table 2.1 Agreement between face-to-face and telephone administered 24-hour
dietary recalls among adults with type 1 diabetes in China (n=13) ...25 Table 3.1 Demographic and clinical characteristics of individuals with type 1
diabetes in China participating in the 3C Nutrition Ancillary Study ...33 Table 3.2 Diabetes nutrition therapy and dietary intake according to insulin
regimen among individuals with type 1 diabetes in China ...36 Table 3.3 Estimated mean (standard error) nutrient and food group intakes,
adjusted for age and occupation, across groups of diabetes nutrition education and therapy among individuals with type 1 diabetes in China ...39 Supplemental Table S3.1 Diabetes nutrition therapy and dietary intake according to self-monitoring of blood glucose among individuals with type 1 diabetes in China ...46 Supplemental Table S3.2 Relationship between diabetes nutrition therapy
variables among individuals with type 1 diabetes in China ...48 Supplemental Table S3.3 Comparison of characteristics of individuals with type 1 diabetes in China meeting HbA1c goals and not meeting HbA1c goals ...49 Table 4.1 Comparison of demographic and clinical characteristics between
participants without diabetes and those with type 1 diabetes (T1D) in China,
combined and stratified by insulin regimen ...56 Table 4.2 Comparison of nutrient intake between participants without diabetes and those with type 1 diabetes (T1D) in China, combined and stratified by insulin regimen ...58 Table 4.3 Comparison of food group intake between participants without
diabetes and those with type 1 diabetes (T1D) in China, combined and stratified by insulin regimen ...60 Table 5.1 Food groups strongly associated (factor loadings ≥0.25) with the dietary
xiv
Table 5.2 Demographic and diabetes self-management characteristics according to tertiles of dietary patterns obtained by reduced rank regression
among individuals with type 1 diabetes in China ...76 Table 5.3 Bivariate associations of food groups that loaded heavily
(loadings ≥0.25) on the reduced rank regression-derived dietary patterns with
HbA1c and LDL cholesterol in individuals with type 1 diabetes in China (n=99) ...78 Supplemental Table S5.1 Food groups consumed by individuals with type 1 diabetes in China included in the reduced rank analysis ...84 Table 6.1 External validity of 3C Nutrition Ancillary Study ...98 Table 6.2 Factor loadings for food groups that loaded heavily (factor loading ≥0.25) on dietary patterns derived using reduced rank regression after backwards
xv
LIST OF FIGURES
Figure 1.1 Summary of long-term complications of type 1 diabetes ... 6 Figure 1.2 Hypothetical blood insulin levels on a) basal-bolus insulin regimens and b) pre-mixed twice-daily insulin regimens. Arrows indicate insulin injections ... 8 Figure 2.1 Bland-Altman plot for percentage of total energy from fat showing mean agreement (---) and 95% limits of agreement (__) between telephone and face-to-face administration of 24-hour recalls ...26 Supplemental Figure S3.1 Directed acyclic graph for relationship between
meeting with a dietitian and fruit intake as drawn using the tool, www.dagitty.net. Two minimal sufficient adjustment sets were identified for estimating the total effect of meeting with a dietitian on fruit intake: {age, occupation} and {marital status,
occupation} ...45 Supplemental Figure S4.1 Directed acyclic graph for relationship between
diabetes status (yes or no, T1D) and dietary intake as drawn using the tool, www.dagitty.net. Body mass index (BMI) was identified as a collider. No minimal sufficient adjustment sets were identified for estimating the total effect of diabetes status on dietary intake. One minimal sufficient adjustment set was identified to estimate the direct effect of diabetes status on dietary intake: {education, income, marital status, occupation, and residence status (urban versus rural)} ...67 Figure 5.1 Mean adjusted HbA1c (%) and 95% confidence intervals from analysis of covariance according to tertiles of A) reduced rank regression-derived dietary pattern 1 score and B) dietary pattern 2 score among individuals with type 1 diabetes in China (n=99). Adjusted for age and household income. *p<0.05 comparing 1st and 3rd tertiles ...79 Figure 5.2 Mean adjusted LDL cholesterol (mmol/L) and 95% confidence intervals from analysis of covariance according to tertiles of A) reduced rank regression- derived dietary pattern 1 score and B) dietary pattern 2 score among individuals with type 1 diabetes in China (n=99). Adjusted for age and household income. *p<0.05
comparing 1st and 3rd tertiles ...80 Figure 6.1 Examples of culturally appropriate portion size picture guides from book given to 3C Nutrition Ancillary Study participants in their Introductory Packet ...90 Figure 6.2 Participant flow in the 3C Nutrition Ancillary Study ...93 Figure 6.3 Examples of bimodal distribution of residuals calculated for two food
xvi
LIST OF ABBREVIATIONS
3CNAS 3C Nutrition Ancillary Study ADA American Diabetes Association ANOVA Analysis of variance
ANCOVA Analysis of covariance
ACE Angiotensin-converting enzyme ARB Angiotensin receptor blocker
BMI Body mass index
CVD Cardiovascular disease
CHNS China Health and Nutrition Survey CIDE China Initiative for Diabetes Excellence DAISY Diabetes Autoimmunity Study in the Young DCCT Diabetes Control and Complications Trial DERI Diabetes Epidemiology Research International DIPP Diabetes Prediction and Prevention Project DSME Diabetes self-management education DKA Diabetic ketoacidosis
DBP Diastolic blood pressure EMR Electronic medical records
EDIC Epidemiology of Diabetes Interventions and Complications GAD Glutamic acid decarboxylase
HbA1c Hemoglobin A1c
xvii IRB Institutional review board
IA Insulinoma-associated
IDF International Diabetes Federation
ISPAD International Society for Pediatric and Adolescent Diabetes ICC Intraclass correlation coefficients
LDL Low-density lipoprotein MDI Multiple daily injections
PEDC Pittsburgh Epidemiology of Diabetes Complications RAPIA Rapid assessment protocol for insulin access RRR Reduced rank regression
SEARCH SEARCH for Diabetes in Youth Study SMBG Self-monitoring of blood glucose SBP Systolic blood pressure
TEDDY The Environmental Determinants of Diabetes in the Young
T1D Type 1 diabetes
T2D Type 2 diabetes
1
CHAPTER 1: BACKGROUND AND RATIONALE
Section 1.1 Pathophysiology of type 1 diabetes
Section 1.1.1 Classification
2 Section 1.1.2 Etiology
The interaction of genetic predisposition and environmental factors triggers a T-cell mediated autoimmune response that results in pancreatic islet inflammation (insulitis), beta cell apoptosis, and ultimately overt T1D.6-8 Support for the autoimmune pathogenesis of T1D comes from the presence of one or more markers of the humoral immune response at diagnosis in about 85-90% of patients,2,9,10 most commonly autoantibodies to insulin (IAA),11 glutamic acid decarboxylase (GAD65),12 the tyrosine phosphatase-like insulinoma-associated protein 2 (IA-2A),13 and the cation efflux transporter ZnT8 (ZnT8Ab).9 However, the observation that insulitis affects few islets and is only present in about one-third of T1D cases highlights the fact that we do not fully understand the etiology of T1D.14 Three important studies, Diabetes Autoimmunity Study in the Young (DAISY) in the United States,15 Type 1 Diabetes Prediction and Prevention Project (DIPP) in Finland,16,17 and BABYDIAB in Germany,18 will continue to provide insight into the etiological processes leading up to T1D onset.
Genetic susceptibility to T1D is predominantly determined by human leukocyte antigen (HLA) genotypes, though 41 other genetic loci have been identified in genome-wide association studies.19 The environmental trigger for T1D is unknown, though there is evidence to support a role of viral infection, the gut microbiome, vitamin D deficiency, and cow’s milk during infancy.20 The Environmental Determinants of Diabetes in the Young (TEDDY) Study in the United States, Finland, Sweden, and Germany will prospectively explore these potential triggers in newborns born between 2004 and 2009 and followed for 15 years.21
Section 1.1.3 Diagnosis
3
2.5%, up to 30 years is 6.4%, and up to 60 years is 9.6%.23 Furthermore, studies from South Africa,24 Ethiopia,25 and China26 have reported much later peak onset ages (early- to mid-twenties). In younger patients, onset tends to be more acute with rapid beta cell destruction, while in older patients, symptoms are more moderate and beta cell destruction is less rapid making it difficult to distinguish from T2D.27
Clinical manifestation of T1D is very heterogeneous, likely due to the multifactorial etiology of the disease and different ages of onset, discussed previously. Symptoms of the hyperglycemia that accompanies the onset of T1D typically include polyuria (excessive passage of urine), polydipsia (excessive thirst), weight loss, and in some cases polyphagia (excessive hunger) and blurred vision.1 Without medical attention, severe hyperglycemia can lead to diabetic ketoacidosis (DKA), and in serious cases, coma and even death.28 The prevalence of DKA at diagnosis of T1D in youth (<20 years) in the United States was most recently reported to be 31.1% (2008-2010), and has remained stable over time (30.2%, 2002-2003, and 29.1%, 2004-2005).29 In Europe, the prevalence tends to be lower: 17.9% in Denmark (1996-2009),30 18.9% in northern Finland (1992-2001),31 and 26.3% in southwestern Germany (1987-1997).32
Section 1.2 Epidemiology of type 1 diabetes
Section 1.2.1 Prevalence and incidence
4
More recently, results from SEARCH indicated that the prevalence of T1D in children and adolescents <20 years old in the United States in 2001 was 1.48 per 1000 and in 2009 it was 1.93 per 1000, an increase of 21.1% over 8 years after adjustment for completeness of ascertainment.36 The incidence of T1D in non-Hispanic SEARCH participants is also increasing: the age- and sex-adjusted incidence of T1D was 24.4 per 100,000 in 2002 and 27.4 per
100,000 in 2009, a relative annual increase of 2.72%.37 Similarly, in Canada, the incidence in 0-14 year-olds increased by a factor of 1.03 per 100,000 per year between 1987 and 2010,38 and in Europe (EURODIAB Study), the incidence increased by an average of 3-4% per year
between 1989 and 2008.39 Some countries in Europe have reported a plateau in the incidence of T1D in children 0-14 years old: in Finland, the incidence increased annually by 3.6% from 1988 to 2005 and then leveled off from 2005 to 2011,40 and in Sweden, the incidence leveled off from 2000 to 2007.41
A few studies have also explored incidence rates in older age groups. One study in northern Italy reported an average annual increase of 4.3% in children (0-14 years old) and 2.8% in young adults (15-29 years old) between 1984 and 2004 (difference not statistically significant).42 Further age-stratification in that study revealed the largest annual increase was in the 0-4 year-olds: 4.3% compared to 2.8% in 5-9 year-olds and 2.7% in 10-14 year-olds, but again, the difference was not statistically significant.42 Studies in Finland reported an average annual increase of 4.2% in children (0-14 years old)22 and 3.9% in young adults (15-39 years old) between 1992 and 2001.43 A study in West Yorkshire, United Kingdom, found that the incidence rate was stable in 15-29 year-olds (0.2% average increase per year) from 1991 to 1999 while it increased, on average, 5.9% per year in 0-14 year-olds.44 In Antwerp, Belgium, an average annual increase of 1.8% was observed in 0-14 year-olds and 5.0% in 0-5 year-olds, but an average annual decrease of 3.8% was observed in 15-39 year-olds.45 Similar results were reported in 0-34 year-olds in Sweden between 1983 and 1998.46 Together, this scientific
5
disease incidence, but also earlier disease onset. Additional research, particularly in young adults, is needed to understand these complex age-period-cohort effects.
Section 1.2.2 Long-term complications and mortality
6
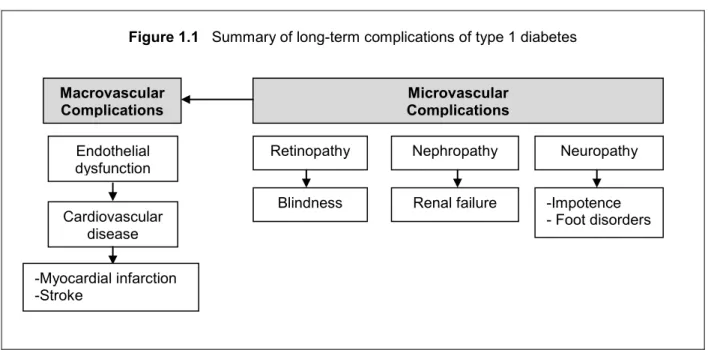
Diabetic retinopathy is the leading cause of blindness among adults aged 20-74 years,54 however, the absolute risk of this functional impairment in the United States is actually quite low. For example, in the DCCT/EDIC conventional and intensive treatment groups, only 0.1% and 1% of participants, respectively, developed blindness after 12 years of follow-up.50 In the PEDC study, only 4% of participants developed blindness after 18 years of follow-up.50 The cumulative incidence rate of blindness after 25 years of follow-up in a Danish registry was higher at 7.5%, a difference the authors attributed to lower rates of loss-to-follow-up in registry studies compared to other observational cohorts (blind patients may be more likely to drop out).55
The number one cause of death among individuals with T1D is CVD.56-58 While mortality rates among individuals with T1D have improved over time, they remain significantly higher than that of the general population.52,59,60 A recent analysis of 10 European countries (EURODIAB study) found that there were twice as many deaths as expected from national mortality rates among individuals diagnosed with T1D in childhood (<15 years of age).61 Age of onset influences mortality, with excess mortality compared to the general population being lower in individuals with late onset T1D (aged 15-29 years) versus individuals with early onset T1D
Figure 1.1 Summary of long-term complications of type 1 diabetes
Macrovascular
Complications Complications Microvascular
Endothelial dysfunction
Cardiovascular disease
Neuropathy Nephropathy
Retinopathy
-Impotence - Foot disorders Renal failure
Blindness
7
(aged 0-14 years),51 an observation consistent with lower rates of complications such as end-stage renal disease, proliferative retinopathy, and microalbuminuria in those with later onset T1D.62-65 However, one study in Finland reported that individuals with early onset T1D had improved survival over time (1970 to 2007) while those with late onset T1D had an increase in mortality since the 1980s (though the cumulative mortality in the late onset group was quite low, 1-1.5% over the first 15 years of the study).51 Furthermore, there is substantial geographic variation in mortality rates even among developed countries,66,67 suggesting that improvements in T1D treatment have not been shared equally across the globe.
Section 1.3 Treatment of type 1 diabetes
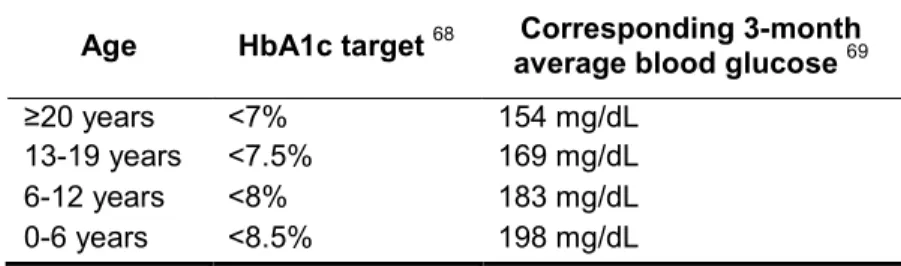
Treatment goals for T1D are two-fold: 1) maintain tight glycemic control (Table 1.1) and 2) reduce CVD risk factors such as hypertension and dyslipidemia.68 The most commonly used measure of glycemic control is glycated hemoglobin A1c (HbA1c), which is formed in a non-enzymatic process when circulating hemoglobin in red blood cells is exposed to glucose, and therefore correlates with average blood glucose levels.69
Table 1.1 Age-specific glycemic control targets for individuals with type 1 diabetes
Age HbA1c target 68 average blood glucose Corresponding 3-month 69
≥20 years <7% 154 mg/dL
13-19 years <7.5% 169 mg/dL
6-12 years <8% 183 mg/dL
0-6 years <8.5% 198 mg/dL
8
Section 1.3.1 Self-monitoring of blood glucose and insulin therapy
The DCCT provided unequivocal evidence that tight glycemic control significantly
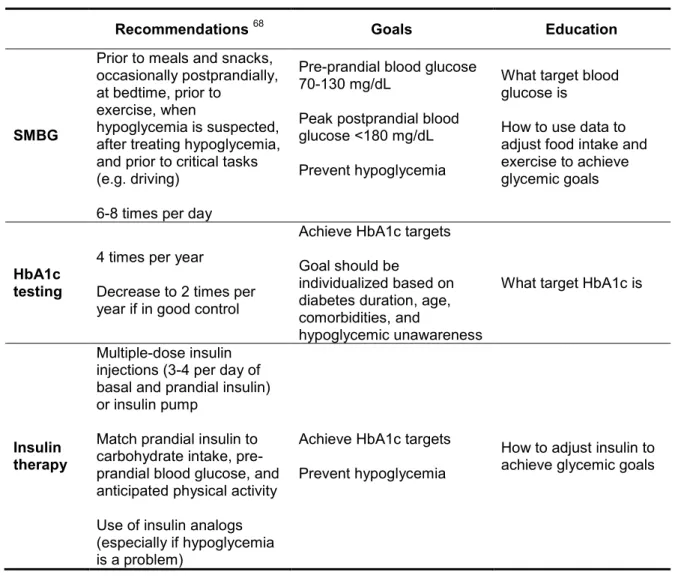
reduces the risk of developing chronic complications of T1D.70,71 This level of glycemic control is typically achieved through intensifying self-monitoring of blood glucose (SMBG) and insulin dose adjustments.68,69 The ADA68 and other national standards of medical care, including those in Canada72 and Europe,73 now emphasize the use of a flexible T1D treatment regimen (Figure 1.2). This involves using data from SMBG (typically 6-8 tests per day) to adjust insulin (typically 3-4 injections per day of basal and prandial insulin analogs or an insulin pump), dietary intake, and physical activity in order to achieve blood glucose goals. A summary of self-management recommendations, goals, and corresponding patient education is provided in Table 1.2.
Figure 1.2 Hypothetical blood insulin levels on a) basal-bolus insulin regimens and b) pre-mixed twice-daily insulin regimens. Arrows indicate insulin injections
Basal insulin
B
loo
d I
ns
u
li
n
Le
ve
l
a) Basal-bolus
b) Pre-mix twice daily
Breakfast Lunch Dinner Bedtime
Breakfast Lunch Dinner Bedtime
Rapid insulin
9
Table 1.2 Summary of the American Diabetes Association’s recommendations for
self-monitoring of blood glucose (SMBG), HbA1c testing, and insulin therapy for patients with type 1 diabetes
Recommendations 68 Goals Education
SMBG
Prior to meals and snacks, occasionally postprandially, at bedtime, prior to
exercise, when
hypoglycemia is suspected, after treating hypoglycemia, and prior to critical tasks (e.g. driving)
6-8 times per day
Pre-prandial blood glucose 70-130 mg/dL
Peak postprandial blood glucose <180 mg/dL
Prevent hypoglycemia
What target blood glucose is
How to use data to adjust food intake and exercise to achieve glycemic goals
HbA1c testing
4 times per year
Decrease to 2 times per year if in good control
Achieve HbA1c targets
Goal should be
individualized based on diabetes duration, age, comorbidities, and
hypoglycemic unawareness
What target HbA1c is
Insulin therapy
Multiple-dose insulin injections (3-4 per day of basal and prandial insulin) or insulin pump
Match prandial insulin to carbohydrate intake, pre-prandial blood glucose, and anticipated physical activity
Use of insulin analogs (especially if hypoglycemia is a problem)
Achieve HbA1c targets
Prevent hypoglycemia
How to adjust insulin to achieve glycemic goals
Section 1.3.2 Diabetes nutrition therapy
The coordination of insulin with dietary intake is essential among patients with T1D in order to maintain near-normal blood glucose levels and prevent acute and chronic
10
dietary exchanges). Evidence among youth with T1D in the United States suggests that the vast majority of patients have been taught carbohydrate counting77 and that use of this diabetes nutrition therapy approach is associated with improved glycemic control and reduced CVD risk.78,79 The ability of other diabetes nutrition therapy approaches to improve clinical outcomes among patients with T1D is not well-established.80
Adherence to dietary recommendations has also been associated with improved metabolic outcomes81 and lower hypertension risk82 among individuals with T1D. However, neither youth83 nor adults84-87 with T1D in the United States and Europe are consuming healthful diets, particularly with respect to total fat, saturated fat, and sucrose.
Section 1.3.3 Comorbidities
Individuals with T1D have higher rates of hypertension compared to the general
population.88 For example, in the United States (2000-2002), the prevalence of hypertension in a cohort of T1D patients with no history of coronary artery disease (mean age 37 years) was 43% compared to only 15% in control participants (mean age 39 years).88 While patients with T1D in that study were significantly more likely to receive treatment for their hypertension compared to controls (87% versus 47%, respectively), only 64% of patients with T1D who received treatment achieved blood pressure control.88 The prevalence of hypertension was lower in the EURODIAB study (1989-1990; mean age 33 years): on average, across 16
countries, 24%.89 Furthermore, the proportion of patients with T1D and hypertension who were receiving treatment in the EURODIAB study was much lower: only 42.2%.89 These observations are especially disconcerting because hypertension is a major risk factor for both CVD and microvascular complications (e.g. nephropathy).90
11
reduce blood pressure includes lifestyle modifications (weight loss if overweight, DASH dietary pattern reducing sodium intake and increasing potassium intake, increased physical activity, and moderation of alcohol intake) and pharmacological therapy (angiotensin-converting enzyme [ACE] inhibitor or angiotensin receptor blocker [ARB] or multiple-drug therapy).90
The prevalence of dyslipidemia is also very high among individuals with T1D. For example, in the EURODIAB study, 45% of participants had a low-density lipoprotein (LDL) cholesterol >3.35 mmol/L and 12% of men and 8% of women had triglyceride levels >1.7 mmol/L.91 In a large cohort of German and Austrian youth (0-26 years old) with T1D, 28.6% had dyslipidemia, but only 0.4% received medical treatment.92 Similarly, in a cohort of youth (mean age 15 years) with T1D in the United States (SEARCH study), 18.1% had high triglycerides and 10.1% had high-density lipoprotein (HDL) cholesterol levels <40 mg/dL.93 Another key target of T1D care is therefore lipid management. The target for blood lipids are as follows: LDL
cholesterol <100 mg/dL (2.6 mmol/L), triglycerides <150 mg/dL (1.7 mmol/L), and HDL
cholesterol >40 mg/dL (1.0 mmol/L) for men and >50 mg/dL (1.3 mmol/L) for women.90 Similar to hypertension, treatment recommendations for dyslipidemia include both lifestyle modifications (reducing saturated fat, trans fat, and cholesterol intake, increasing omega-3 fatty acid and fiber intake, weight loss if overweight, and increased physical activity) and pharmacological therapy (statins).90
Section 1.4 Burden of type 1 diabetes in China
12
that were missing data from a secondary independent source (Guilin, Xuzhou, and Zunyi).100 A total of 883 cases were registered at the remaining 20 centers and an overall incidence rate of 0.59 per 100,000 person-years was reported.100 The second used data spanning a seven-year period (1990-1996), excluded only one of the 23 centers (Xuzhou), and reported an overall incidence rate of 0.1 per 100,000 person-years (ranging from 0.1 per 100,000 person-years in Zunyi to 4.5 per 100,000 person-years in Wuhan).22
Beginning in 2000, the International Diabetes Federation (IDF) has published the Diabetes Atlas, a compilation of prevalence and incidence estimates for T1D and T2D around the world. The most recent edition (6th), published in 2013, continues to use estimates from the WHO DIAMOND Project (1990-1996) for T1D incidence in China.101
Since the completion of the WHO DIAMOND Project, many of the participating centers have continued to register T1D cases. In Shanghai, for example, the WHO DIAMOND Project documented an average incidence rate of 0.61 per 100,000 person-years between 1980 and 1991,102 and two subsequent studies have reported mean annual incidence rates: 0.96 per 100,000 between 1989 and 199399 and 3.1 per 100,000 person-years between 1997 and
2011.103 Similarly, a study conducted in Harbin between 1990 and 2000 reported a mean annual incidence rate of 0.73 per 100,000 person-years and a mean annual increase of 7.4% per year.104
A national, hospital-based T1D registry in China (10 centers) is under development and will provide updated estimates of the incidence and the first estimates of the prevalence of T1D in China.
Section 1.5 Type 1 diabetes treatment barriers in China
13
institutional, and community support. These aspects of care are beginning to be addressed in urban China, but in most parts of the country, the implementation of standards of medical care remains an insurmountable challenge. Barriers to achieving treatment goals are discussed in detail in the sections that follow.
Section 1.5.1 Limitations of healthcare providers and the healthcare system
It is common for Chinese specialists such as endocrinologists to meet with over 100 patients per day in outpatient departments, spending about 3 minutes with each patient.105 These severe time limitations have undoubtedly contributed to poor patient-provider relationships in China, which in turn have led to a crisis of violence against healthcare
providers.106 Another substantial barrier to improving interactions with patients in China is the lack of adoption of electronic medical records (EMR) despite research supporting positive effects on efficiency and effectiveness of care as well as provider and patient satisfaction.107 While the Communist Party of China Central Committee emphasized that hospital EMRs should be a priority of healthcare reform in 2007108 and the Central Government allocated 1.5 billion USD to promote the use of health information technology in 2011,109 the use of this technology to monitor chronic diseases such as T1D over time has been limited. Patients continue to carry hard copies of their health records to outpatient department visits. Indeed, most research on EMR implementation in China has been conducted in inpatient departments with outcomes relating to hospitalization and infectious diseases.110,111
Given the low incidence rate of T1D in China,22 physicians, including endocrinologists, rarely encounter T1D. In contrast, T2D is increasingly common throughout China: the
14
education programs such as the China Initiative for Diabetes Excellence (CIDE) have been shown to significantly improve diabetes knowledge,115 but largely focus on T2D. T1D-specific modules integrated into ongoing healthcare provider training have the potential to improve care, but must be tested in the context of China.
Section 1.5.2 Diabetes self-management education is difficult to obtain
The ADA and the International Society for Pediatric and Adolescent Diabetes (ISPAD) recommend ongoing, tailored diabetes self-management education (DSME) provided by a multidisciplinary healthcare team.68,116 DSME is typically divided into primary diabetes education (survival skills) and secondary diabetes education (continuing diabetes education curriculum contributing to an in-depth understanding of self-management).116 Survival skills include blood glucose targets, basic nutrition advice, an explanation of what to do for hyper- and
hypoglycemia, how to handle diabetes during illness, and psychological issues concerning diabetes.116 Continuing diabetes education curriculums include, for example, meeting with a dietitian annually and receiving information about diabetes camps and other support groups.116
15
recent systematic review of diabetes education interventions in China reported that half of the interventions were conducted in inpatient settings.117 The lack of diabetes educators and the common requirement for inpatient admission to receive diabetes education are significant barriers for patients with T1D.
Section 1.5.3 Blood glucose monitoring and insulin regimens remain suboptimal
Between 2001 and 2002, the IDF found that children and adolescents with T1D in China had the lowest mean daily insulin dose and the lowest frequency of SMBG among Western Pacific countries.120 Only 76% of youth in this study practiced SMBG, checking their blood glucose, on average, 8 times per month. This is a stark contrast to youth in the United States, 75% of whom test ≥4 times per day.121 Furthermore, most children (68%) with T1D in China in the IDF study were on 1-2 insulin injections per day,120,121 in comparison to the United States, where only 27% of children are on 1-2 insulin injections per day.121
The acute outcome of these suboptimal treatment regimens is poor glycemic control. Only 53% of patients in the IDF study had the recommended ≥3 HbA1c tests in the past year and the HbA1c for the sample at the time of the study was (mean ±SD) 9.5 ±1.9%,120 one percentage point higher than the average HbA1c among children with T1D in the United States (8.5 ±1.5%).121 Even children on 1-2 insulin injections per day in the United States achieved HbA1c levels (8.6 ±1.7%) lower than that reported in China.121
16
and that families must make sacrifices in diabetes self-management (e.g. testing infrequently and using less insulin than prescribed) in order to accommodate this expense.
Section 1.6 Comorbidities, complications, and mortality in China
No study has evaluated the effectiveness of prevention interventions such as the DCCT in China, where the coexistence of diabetes with other CVD risk factors is exceptionally
high.120,126 Data from 1998-1999 (Diabcare-Asia Study) suggest that 30% of patients with T1D in Asia also have hypertension and 11% smoke.126 More recent data from Guangdong, China, suggest that a similar proportion of T1D patients smoke (11.3%).26 Estimates from 2001-2002 of hypertension in youth <15 years old with T1D in two centers in China suggest a hypertension prevalence of 24%.120
There is limited data on complications and mortality from China. However, data from other East Asian countries may be informative. The Diabetes Epidemiology Research International (DERI) mortality study was launched in 1986 in four countries (United States, Finland, Japan, and Israel) and reported that Japan had a markedly higher age-adjusted mortality rate compared to the other three countries: 681 deaths per 100,000 person-years of diabetes in Japan compared to, for example, 230 deaths per 100,000 person-years of diabetes in the United States.127 At follow-up in that study (1985), 20% of Japanese participants
17
The Thailand Diabetes Registry Project has also provided valuable insight into T1D complications in Asia. In 2003, the Registry reported a prevalence of diabetic retinopathy among patients with T1D (mean T1D duration 9.2 years) of 21.6% and of diabetes-related legal
blindness of 1.0%.131 A study conducted in Japan in 2004 (mean T1D duration 26.9 years) reported that 25.0% of males and 31.1% of females had proliferative diabetic retinopathy and 25.0% of males and 22.2% of females had diabetic nephropathy.132 The prevalence of
comorbidities was also high in this cohort: 53.6% of males and 42.2% of females had
hypertension and 39.3% of males and 26.7% of females had dyslipidemia.132 An earlier study (1995) also conducted in Japan found a high prevalence of blindness: 23.3% in those
diagnosed with T1D between 1965 and 1969 and 2.1% in those diagnosed with T1D between 1975 and 1989, representing a significant decrease in the proportion of patients diagnosed with blindness over time.133
Section 1.7 Need for Chinese standards of medical care for type 1 diabetes
Although general treatment goals for T1D care (e.g. glycemic control and reducing CVD risk) are not different across countries and cultures, the optimal approach to achieving these goals will likely differ.
Section 1.7.1 Unique and dynamic Chinese food environment
18
19
Table 1.3 Summary of reported dietary intakes of populations in China
Ref
Study
Sample Size;
Age (mean or range) Method
Energy
(kcal/day) Carbohydrates Fat
Fiber
(g/day)
Rice
(g/day)
Fruits
(g/day)
Vegetables
(g/day)
137 China Health and Nutrition Survey 5000; 18-45 years
24-hr
recall 2150 Not reported Not reported Not reported 348 Not reported Not reported
138 Chinese National Nutrition and Health Survey
140,010; >18 years
FFQ Not
reported 48.5% total kcal (urban) 35.0% total kcal (urban) Not reported Not reported Not reported Not reported
139 Shanghai Women’s
Health Study 191; 55.4 years
FFQ 1665 284.2 g/day 27.4 g/day 9.9 310 377 335
140 Shanghai Men’s Health Study 195; 54.8 years
20
Section 1.7.2 Evidence of positive effect of recommendations in China
Implementation of population-specific recommendations by healthcare providers in China has the potential to result in improved adherence and glycemic control, and subsequently the prevention of complications. Researchers in Guangzhou Province recently reported that receiving a recommendation from a provider to get regular eye examinations was associated with having an eye examination in the last year among patients (>18 years) with diabetes.141 A individualized nutrition therapy intervention among 20 children (5-12 years) with T1D conducted in Sichuan Province in China reported significant improvements in nutrition knowledge and quality of life.142
Section 1.8 The 3C Nutrition Ancillary Study: improving our understanding of current self-management practices among adolescents and adults with type 1 diabetes in China
The incidence of T1D is increasing in China and morbidity and mortality in this
population may be higher than in developed countries. While results of randomized controlled trials in the United States and Europe support intensive disease self-management to achieve tight glycemic control and reduce diabetes-related complications, our knowledge of
21
dietary intake of individuals with T1D to those without diabetes in Beijing, and 3) to use reduced rank regression (RRR) to identify dietary patterns maximizing the explained variation in two key health indicators, HbA1c and LDL cholesterol, among individuals with T1D in Beijing. All
22
CHAPTER 2: RELATIVE VALIDITY OF TELEPHONE VERSUS FACE-TO-FACE 24-HOUR DIETARY RECALLS IN ADULTS WITH TYPE 1 DIABETES IN CHINA
2.1 Introduction
While studies in Europe143,144 and the United States145-147 have not found significant differences in self-reported dietary intake when 24-hour recalls are administered via telephone instead of face-to-face, no study has evaluated the relative validity of 24-hour recalls
administered via telephone in China where the diet is uniquely complex. Compounding the challenge of dietary assessment, individuals who are diagnosed with T1D are considered ‘monsters’ by society.148 Because of this stigma, individuals with T1D often hide their disease; thus it would not be culturally acceptable for research staff to visit participants at their homes to conduct face-to-face 24-hour recalls. Furthermore, the participant burden of traveling to a clinic site to complete the multiple 24-hour recalls needed to assess usual dietary intake would be prohibitive, resulting in low compliance. These barriers could be addressed by using telephone administered 24-hour recalls.
23 2.2 Methods
Informed by a priori power calculations, a random subset of 19 adults was selected to participate in the Relative Validity Study from a pool of 159 eligible 3C Study participants. Eligibility criteria included: ≥18 years of age, no severe diabetes complications (e.g. advanced micro- and macrovascular complications, including nephropathy and stroke), Beijing resident, and in-service telephone number available. Individuals expressing an interest in participating during a recruitment call were mailed an introductory packet containing instructions for a
previous-day dietary recall, blank food and recipe record forms, and a portion size picture guide developed by the Chinese Center for Disease Control. Within one week of mailing the
introductory packet participants were randomized to receive either the face-to-face interview followed by the telephone interview or vice-versa (46% telephone first). Participants were instructed to record their intakes using the forms provided on the day prior to the scheduled interviews, to be used as a memory prompt as in other studies.149,150 Interviews were conducted by trained study staff in Chinese on the same day with a minimum of six hours in between.
The 24-hour recall was administered using a two-pass approach: 1) collect a detailed food list and 2) review and confirm the detailed food list. During the first pass, an outline of the previous day’s intake was collected. Interviewers probed for meal type, preparation setting, preparation method, and detailed information on any additions to the food, food type, brand names and portion size. During the second pass, the detailed food list was re-read and missing foods, beverages, and eating occasions were probed.
Food lists were converted into nutrients and food groups using the most recent versions of the Chinese Food Composition Tables.151,152 Due to the non-normal distribution of the
24
the first and second interview, regardless of interview type; no differences were found between median intakes for any of the nutrients or food groups reported (all p >0.05). All statistical analyses were conducted using SAS 9.2 (SAS Institute, Cary, North Carolina).
2.3 Results
Of the 19 eligible participants recruited, two declined to participate due to time
limitations, three did not attend their scheduled visit, and one refused to provide written consent (enrollment rate: 68%). Participants (n=13; 62% male) were (mean ±SD) 37 ±11 years old and had a T1D duration of 11 ±8.6 years.
There were no statistically significant differences between median intakes for any of the nutrients or food groups reported by telephone versus face-to-face interview (all p<0.05; Table 2.1). Power calculations for paired t-tests (α=0.05, n=13, SD=160 kcal, within-subject
correlation=0.8) indicated that we had a 74% power to detect a mean difference in total energy intake of 80 kcal.
The mean ICC was 0.79, ranging from 0.46 for fiber to 0.97 for energy (Table 2.1). Similarly, all rho values were significantly different from zero and all but two rho values (fiber, rho=0.60 and eggs, rho=0.61) were ≥0.75. The percent of participants with perfect agreement between telephone and face-to-face interviews for reported grams of the food groups ranged from 15% (n=2) for vegetables to 85% (n=11) for fruits. The percent of participants with agreement within 100 g was >90% for all food groups except vegetables (69%; n=9). Bland-Altman plots did not support the existence of systematic biases between telephone and face-to-face interviews (for example, percentage of total calories from fat, Figure 2.1).
25
Table 2.1 Agreement between face-to-face and telephone administered 24-hour dietary recalls among adults with type 1 diabetes in China (n=13)
Administration Method
Difference in
Means 1 value P- 2 ICC rho Face-to-face
Median (25th-75th percentile) Median (25Telephoneth-75th percentile)
Energy (kcal/day) 1467 (1334 – 1946) 1459 (1323 – 2134) 54 ± 101 0.07 0.97 0.96
Fat (% kcal) 39.5 (28.1 – 43.7) 37.4 (30.5 – 39.7) 1.2 ± 7.6 0.24 0.77 0.75
Carbohydrate (% kcal) 44.8 (41.0 – 53.2) 50.7 (41.3 – 52.4) -0.5 ± 6.0 0.79 0.86 0.92
Protein (% kcal) 15.3 (13.1 – 17.2) 15.5 (14.2 – 17.7) -0.6 ± 2.1 0.17 0.71 0.77
Fiber (g/1000 kcal) 7.3 (5.7 – 9.8) 8.4 (6.6 – 9.5) -0.2 ± 3.3 0.38 0.46 0.60
Rice (g/day) 100 (75 – 200) 106 (80 – 190) 28 ± 94 0.63 0.68 0.91
Wheat (g/day) 100 (70 – 110) 90 (20 – 200) -16 ± 65 0.63 0.86 0.94
Vegetables (g/day) 260 (163 – 520) 265 (199 – 560) -3 ± 126 0.65 0.86 0.89
Fruit (g/day) 0 (0 – 200) 0 (0 – 175) 18 ± 53 0.50 0.93 0.98
Red meat (g/day) 50 (0 – 75) 50 (0 – 80) -6 ± 16 0.25 0.93 0.93
Eggs (g/day) 60 (60 – 70) 60 (50 – 60) 2 ± 23 0.90 0.64 0.61
1 Mean ± SD difference between nutrient and food group means reported in face-to-face and telephone interviews. Negative values indicate
telephone > face-to-face
26
Figure 2.1 Bland-Altman plot for percentage of total energy from fat showing mean agreement (---) and 95% limits of agreement (__) between telephone and
face-to-face administration of 24-hour recalls
2.4 Discussion
To our knowledge, this is the first study to evaluate the relative validity of telephone versus face-to-face 24-hour recalls in China. For all nutrients and food groups analyzed, results supported that telephone interviews are a reliable method compared to face-to-face interviews among individuals with T1D in China. A limited number of relative validity assessments have been conducted previously in China, all in non-diabetic adults, including a study validating a combined 24-hour recall and weighed household food record against doubly-labeled water,153 and a study validating face-to-face 24-hour recalls against household weighed food records.154
D iff er en ce F at b y T el ep ho ne a nd I n-pe rs on I nt er vi ew ( % k ca l) -20 -15 -10 -5 0 5 10 15 20
Average Fat by Telephone and In-person Interview (% kcal)
10 20 30 40 50 60
Bland-Altman Plot: Fat (% kcal)
27
Although food frequency questionnaires have been validated for urban Chinese populations in the past 5 years,155,156 their use would not have been appropriate for our target population given that the diets of individuals with T1D may differ significantly from non-diabetics, especially in settings with limited access to blood glucose testing supplies and insulin. Because of the acute effects of dietary intake on blood glucose levels in individuals using exogenous insulin, we hypothesized that our target population would be more “food aware,” meaning that they could more easily recall foods and portion sizes than the general population. Furthermore, given that previous studies in China have reported the use of fixed insulin regimens among individuals with T1D,120 we anticipated that their dietary intake would have low day-to-day variability. Indeed, previous studies in China have reported very low day-to-day variability in the general population compared to the United States and Europe.157 Together, these factors could partially explain the high level of agreement between interviews and further support the use of telephone administered 24-hour recalls in our target population.
Energy intake in this sample was low: median intake from the telephone interview was only 1459 kcal/day. Two clinical factors may explain this: anthropometrics and insulin dose. The average height of participants was 169 cm (approximately 5.5 feet) and the average BMI was 21.5 kg/m2. Because greater food intakes, particularly carbohydrate staples such as rice and wheat noodles, require greater insulin doses to achieve near-normal blood glucose levels, individuals with T1D in China may be reducing dietary intake in order to accommodate smaller insulin doses. Indeed, one study reporting caloric intake in Taiwanese youth with T1D found that 21% consumed >30% fewer calories than recommended and 27% consumed 10-30% fewer calories than recommended.158 Families may be making sacrifices in diabetes self-management (e.g. using less insulin) in order to accommodate the expense of T1D. This represents an important phenomenon to explore in future research.
28
thereby reducing recall biases and improving recipe reporting. Additional strengths include training interviewers and using a culturally appropriate portion size picture guide.
Food records were used to reduce reliance on memory and allow participants to collect recipe information, which resulted in more complete and accurate food lists. However, actively recording food may have led to changes in behavior. In additional to actual behavior changes, we recognize that reported behavior changes may occur. However, purposeful dietary
misreporting may be uncommon in China.153 In our study, approval biases were addressed by using interviewers who were not the participants’ healthcare providers and training them to use a standardized protocol and neutral probes.159 Finally, while the sample size was relatively small, we were powered to detect expected observable differences in mean nutrient intake.
29
CHAPTER 3: DIABETES NUTRITION EDUCATION AND DIETARY INTAKE AMONG INDIVIDUALS WITH TYPE 1 DIABETES IN CHINA
3.1 Introduction
The coordination of insulin with dietary intake is essential among individuals with T1D in order to maintain near-normal blood glucose levels and prevent acute and chronic
complications.160 This integration is achieved through individualized diabetes nutrition therapy, which typically involves one of two approaches: (1) fixed daily insulin doses matched to
consistent carbohydrate intake with respect to time and amount or (2) flexible daily insulin doses accommodating variability in food intake, typically using carbohydrate counting.161 There is not a “one-size-fits-all” eating pattern for diabetes.161 Healthcare providers—preferably dietitians or their equivalent—should collaboratively develop eating plans with each individual with diabetes and provide ongoing implementation support.161
30 3.2 Methods
3.2.1 Sample population
The 3C Study was an epidemiological study of the coverage, cost, and care of T1D in China.162 Dietary intake in the 3C Study was assessed using the Summary of Diabetes Self-Care Activities measure, which includes four questions relating to general dietary intake.163 A follow-up study, 3CNAS, was conducted, on average, 1.6 ±0.2 years later and expanded the 3C Study to include comprehensive information on diabetes nutrition therapy and dietary intake. 3C Study participants who met the following criteria were eligible for 3CNAS: Beijing resident, ≥12 years of age, no severe diabetes complications (e.g. advanced micro- and macrovascular complications, including nephropathy and stroke), and in-service telephone number available.
3.2.2 Diabetes nutrition therapy assessment
Trained interviewers administered a survey during the 3CNAS visit that queried recommendations received from healthcare providers relating to general diabetes care and nutrition. Specifically, participants were asked how often, if ever, they had met with a dietitian; if they had received an eating plan and if yes, how often they followed it; and if they had ever been taught carbohydrate counting and if yes, who taught them and how often they use it. An open-ended question wasalso asked relating to what the participant would like to know about how food interacts with their diabetes care.
31 3.2.3 Dietary intake assessment
At the end of the 3CNAS visit, participants were trained by dietitians to record their dietary intake on food records provided in an introductory packet. Emphasis was placed on estimating portion sizes using food samples, an electronic scale, and a culturally appropriate portion size picture guide. On average, beginning 3.0 ±2.8 days after this visit, participants completed three telephone administered 24-hour recalls. The 24-hour recall food lists were converted into nutrients and food groups using the Chinese Food Composition Tables.151,152
3.2.4 Covariates
Demographic and socioeconomic data were collected via an interviewer-administered survey during the 3C Study visit. Diabetes duration was calculated as the period from July 1 of the year of diagnosis (because the 3C Study only queried year of diagnosis) to the 3CNAS visit.
A blood sample was collected by venipuncture during the 3CNAS visit and HbA1c was measured using standardized procedures in whole blood with an automated high-performance liquid chromatography system (Primus Ultra2, Trinity Biotech, Bray, Co Wicklow, Ireland).
3.2.5 Statistical analysis
32
The final adjustment set included age and occupation. All statistical analyses were conducted using SAS 9.2 (SAS Institute, Cary, North Carolina).
3.3 Results
A total of 195 3C Study participants met the inclusion criteria. Of these, 72 (37%) refused to participate and 23 (12%) dropped out before the 3CNAS visit. The final sample size was therefore 100. There were no differences in diabetes duration, sex, education, or urban versus rural residence between those who participated and those who refused or dropped out (all p >0.05). However, those who participated tended to be older (p=0.001), have higher household incomes (p=0.05), and be retired/unemployed/never worked (p=0.06) and married/cohabitating (p=0.02).
Participants were 41.7 ±16.3 years old, had a diabetes duration of 11.8 ±9.7 years, and an HbA1c of 8.22 ±1.77% (Table 3.1). Approximately one-third of participants were on insulin regimens classified as “MDI: No basal”; the most common insulin combination in this category was 3 injections/day of short-acting insulin (Regular) and 1 injection/day of intermediate-acting insulin (NPH). SMBG frequency was low: only 8% of participants reported testing ≥ 3 times/day.
33
Table 3.1 Demographic and clinical characteristics of individuals with type 1 diabetes in China participating in the 3C Nutrition Ancillary Study
All
n=100 Males n=54 Females n=46
Age, years 41.7 (16.3) 41.1 (16.7) 42.4 (15.8)
Diabetes duration, years 11.8 (9.7) 9.8 (7.4) 14.2 (11.4)
Highest level of education
<University 32 (32%) 13 (25%) 19 (41%)
Junior University 16 (16%) 8 (15%) 8 (17%)
≥University 51 (52%) 32 (60%) 19 (41%)
Household income, RMB/month
<3000 20 (20%) 10 (19%) 10 (22%)
3000 - <5000 23 (23%) 12 (22%) 11 (24%)
5000 - <10 000 30 (30%) 16 (30%) 14 (30%)
≥10 000 27 (27%) 16 (30%) 11 (24%)
Occupation
Non-government worker 31 (31%) 20 (37%) 11 (24%)
Government worker 17 (17%) 8 (15%) 9 (20%)
Student 17 (17%) 12 (22%) 5 (11%)
Farmer 7 (7%) 4 (7%) 3 (7%)
Retired/unemployed 28 (28%) 10 (19%) 18 (39%)
Marital status
Married/cohabitating 58 (60%) 31 (61%) 27 (60%)
Single/divorced/widowed 38 (40%) 20 (39%) 18 (40%)
Medical insurance
Urban employee 47 (47%) 26 (48%) 21 (46%)
Urban resident 26 (26%) 12 (22%) 14 (30%)
New cooperative 15 (15%) 8 (15%) 7 (15%)
Other 7 (7%) 4 (7%) 3 (7%)
None 5 (5%) 4 (7%) 1 (2%)
Residency status
Urban 82 (85%) 44 (85%) 38 (84%)
Rural 15 (15%) 8 (15%) 7 (16%)
Met glycemic control goal 1
Yes 24 (24%) 13 (24%) 11 (24%)
No 75 (76%) 41 (76%) 34 (76%)
Values are given as mean (SD) or n (%)
1 HbA1c <7.0% for participants >19 years old and <7.5% for participants ≤19
34
In regards to diabetes nutrition therapy strategies, 64% of participants reported that they had been taught carbohydrate counting (Table 3.2) and the majority of these had been taught by a physician (56%). The remaining participants were taught by dietitians (30%), diabetes educators (5%) or some other source including printed educational materials (3%), the Internet (2%), and nurses (3%). The vast majority (81%) of participants taught carbohydrate counting reported “never” using this self-management tool. Only two participants who had been taught carbohydrate counting reported practicing carbohydrate counting every day. Participants who had been taught carbohydrate counting by dietitians were nearly twice as likely to report sometimes using it (26%) compared to participants who had been taught by physicians (14%), but the difference was not statistically significant (p=0.51).
While a slightly greater proportion of participants (72%) had been given an eating plan by a healthcare provider (Table 3.2) relative to being taught carbohydrate counting (64%), participants only followed their prescribed eating plans, on average, 2.6 ±3.2 days in the past week. Of note, 11% of participants had never been taught carbohydrate counting and had never been given an eating plan by a healthcare provider.
Dietary flexibility in this sample was low: 67% of participants reported eating about the same amount of food at the same time everyday (Table 3.2). When participants were asked to describe what they do when they eat more or less food than usual, 20% reported that they do nothing because they have a rigid diet. In response to a query about what they would like to know about how food interacts with their diabetes care, 14% of participants responded that they wanted to know how they could eat fruit and 4% explicitly asked if a rigid diet is necessary for patients with T1D and how they could increase the diversity of their diets.
35
adjust their insulin in response to eating more or less than usual. Participants on pumps had higher fruit (p=0.07) and dairy (p=0.04) intakes relative to other participants.
Participants who tested ≥1 time/day were more likely to report adjusting insulin in response to dietary variability and less likely to report doing nothing because they have a rigid diet (p=0.05) (Supplemental Table S3.1). They also had significantly (p=0.005) higher fruit intakes compared to participants testing with lower frequencies.
Participants who had ever met with a dietitian or who had attended an education session in the past 12 months that covered nutrition were marginally significantly more likely to have been given an eating plan (Supplemental Table S3.2). While a greater proportion of
participants who had attended an education session that covered nutrition had been taught carbohydrate counting and used it sometimes (22%) compared to those who did not attend such a session (10%), the difference was not statistically significant (p=0.31).
Participants who attended an education session that covered nutrition in the past 12 months tended to be (p=0.11) more likely to achieve HbA1c goals compared to participants who did not attend such a session: 29% of participants attending a session met HbA1c goals
36
Table 3.2 Diabetes nutrition therapy and dietary intake according to insulin regimen among individuals with type 1 diabetes in China
All n=100 MDI: With basal n=42 Pump n=9 MDI: No basal n=30 1-2 injections n=19 P- value 1 Self-monitoring of blood glucose
<1 time/week or do not test 31 (31%) 6 (14%) 1 (11%) 17 (57%) 7 (37%)
0.005
1-2 times/week 27 (27%) 10 (24%) 2 (22%) 8 (27%) 7 (37%)
3-6 times/week 12 (12%) 7 (17%) 2 (22%) 2 (7%) 1 (5%)
≥1 time/day 30 (30%) 19 (45%) 4 (44%) 3 (10%) 4 (21%)
Dietary flexibility
Eat same amount at same time everyday 67 (67%) 32 (76%) 4 (44%) 17 (57%) 14 (74%)
0.14 Eat different amounts or at different
times everyday 33 (33%) 10 (24%) 5 (56%) 13 (43%) 5 (26%)
Action if diet varies
Adjusts insulin 57 (57%) 26 (62%) 6 (67%) 17 (57%) 8 (42%)
0.21
Adjusts insulin or exercise 8 (8%) 5 (12%) 2 (22%) 0 (0%) 1 (5%)
Adjusts exercise 15 (15%) 5 (12%) 1 (11%) 5 (17%) 4 (21%)
Nothing, rigid diet 20 (20%) 6 (14%) 0 (0%) 8 (27%) 6 (32%)
Ever met with a dietitian
Yes 48 (48%) 22 (52%) 4 (44%) 15 (50%) 7 (37%) 0.71
No 52 (52%) 20 (48%) 5 (56%) 15 (50%) 12 (63%)
Attended education session in past 12 months that covered nutrition
Yes 18 (18%) 10 (24%) 0 (0%) 5 (17%) 3 (16%) 0.39
No 82 (82%) 32 (76%) 9 (100%) 25 (83%) 16 (84%)
Carbohydrate counting
Taught and use sometimes 12 (12%) 6 (14%) 1 (11%) 4 (13%) 1 (5%)
0.20
Taught but never use 52 (52%) 26 (62%) 6 (67%) 13 (43%) 7 (37%)
Never taught 36 (36%) 10 (24%) 2 (22%) 13 (43%) 11 (58%)
Eating plan
Given and use sometimes 32 (32%) 16 (38%) 1 (11%) 11 (37%) 4 (21%)
0.32
Given but never use 40 (40%) 17 (40%) 5 (56%) 12 (40%) 6 (32%)
37
Nutrients
Fat (% kcal) 35.9 (7.9) 36.1 (7.0) 35.7 (9.7) 35.3 (8.1) 36.5 (8.9) 0.80
Carbohydrates (% kcal) 47.1 (8.4) 46.5 (7.7) 49.6 (11.3) 46.5 (8.1) 48.0 (9.4) 0.77
Protein (% kcal) 16.3 (3.0) 16.9 (2.9) 15.7 (3.3) 16.3 (3.1) 15.3 (2.8) 0.28
Fiber (g/1000 kcal) 7.5 (2.6) 7.8 (2.4) 7.2 (2.9) 6.9 (2.3) 7.8 (3.1) 0.37
Iron (mg/1000 kcal) 11.2 (2.6) 11.6 (2.3) 11.1 (3.2) 11.2 (2.7) 10.2 (2.7) 0.15
Food groups (g/1000 kcal)
Rice 79 (52) 79 (48) 91 (58) 62 (47) 101 (62) 0.10
Wheat products 107 (72) 89 (48) 106 (112) 130 (87) 108 (59) 0.10
Beans & bean products 45 (44) 42 (39) 40 (26) 47 (43) 53 (60) 0.98
Vegetables 257 (138) 288 (143) 238 (117) 217 (118) 260 (158) 0.18
Fruit 49 (59) 51 (55) 70 (66) 31 (53) 63 (70) 0.07
Red meat 44 (32) 49 (37) 40 (30) 39 (30) 42 (24) 0.81
Eggs 31 (21) 31 (18) 27 (23) 34 (25) 30 (21) 0.75
Milk & milk products 138 (93) 146 (102) 190 (81) 135 (78) 99 (89) 0.04
Values are given as mean (SD) or n (%)
1 Chi-square test for categorical variables and Kruskal-Wallis test for continuous variables
38