A touchscreen based global motion perception task for mice
Jeffrey Stirman#a,b, Leah B. Townsend#c, and Spencer Smitha,b,c,d,*
aDepartment of Cell Biology and Physiology, University of North Carolina at Chapel Hill, Chapel
Hill, NC
bCarolina Institute for Developmental Disabilities, University of North Carolina at Chapel Hill,
Chapel Hill, NC
cNeurobiology Curriculum, University of North Carolina at Chapel Hill, Chapel Hill, NC
dNeuroscience Center, University of North Carolina at Chapel Hill, Chapel Hill, NC
# These authors contributed equally to this work.
Abstract
Global motion perception is a function of higher, or extrastriate, visual system circuitry. These circuits can be engaged in visually driven navigation, a behavior at which mice are adept.
However, the properties of global motion perception in mice are unclear. Therefore, we developed a touchscreen-based, two-alternative forced choice (2AFC) task to explore global motion detection in mice using random dot kinematograms (RDK). Performance data was used to compute
coherence thresholds for global motion perception. The touchscreen-based task allowed for parallel training and testing with multiple chambers and minimal experimenter intervention with mice performing hundreds of trials per session. Parameters of the random dot kinematograms, including dot size, lifetime, and speed, were tested. Mice learned to discriminate kinematograms whose median motion direction differed by 90 degrees in 7-24 days after a 10-14 day pre-training period. The average coherence threshold (measured at 70% correct) in mice for this task was 22 ± 5%, with a dot diameter of 3.88 mm and speed of 58.2 mm/second. Our results confirm the ability of mice to perform global motion discriminations, and the touchscreen assay provides a flexible, automated, and relatively high throughput method with which to probe complex visual function in mice.
Graphical abstract
*Corresponding author, [email protected].
Publisher's Disclaimer: This is a PDF file of an unedited manuscript that has been accepted for publication. As a service to our
customers we are providing this early version of the manuscript. The manuscript will undergo copyediting, typesetting, and review of
HHS Public Access
Author manuscript
Vision Res
. Author manuscript; available in PMC 2017 October 01.Published in final edited form as:
Vision Res. 2016 October ; 127: 74–83. doi:10.1016/j.visres.2016.07.006.
A
uthor Man
uscr
ipt
A
uthor Man
uscr
ipt
A
uthor Man
uscr
ipt
A
uthor Man
uscr
Keywords
higher visual areas; random dot kinematograms; touchscreen chamber; psychophysics; global motion processing
1. Introduction
Detection of motion cues in the external environment is a fundamental component of visual processing. The ability to detect changes in the environment signaled by motion is necessary for survival, regardless of whether the animal is predator or prey. Visual motion detection is not restricted to mammals, being widely observed across the animal kingdom, in species including zebrafish, and Drosophila melanogaster [1, 2]. In humans and non-human primates, visual perception is canonically divided into two specialized processing streams: the ventral or ‘what’ pathway and the dorsal or ‘where’ pathway [3]. The dorsal pathway is particularly selective for features of visual motion, with damage to brain areas in this pathway producing impaired motion perception [4, 5]. Accumulating evidence suggests that these two visual processing streams also exist in mice [6, 7], with mouse higher visual areas exhibiting diverse spatial and temporal tuning preferences for oriented gratings [8-11]. To determine how these cortical areas contribute to visual processing, it is prudent to first quantify the psychophysical limits of motion perception in mice [12, 13]. Mouse psychophysics can be combined with reversible optogenetic lesions to delineate requisite brain areas [8, 14], and genetically engineered mouse models can be used to link genetic changes to psychophysical performance [15, 16]. However, there is a currently a lack of methodologies for measuring psychophysical thresholds with motion stimuli in freely moving mice.
In humans and non-human primates, one common method used to examine motion perception is the random dot kinematogram (RDK) task [4, 17-28]. This task presents subjects with a field of random dots, some percentage of which are moving in the same direction while the rest move randomly. By varying the percentage of dots moving
coherently and asking subjects to report the direction of motion, researchers can measure the threshold at which subjects are unable to discern coherent global motion from background noise [17]. Use of RDK in non-human primates has greatly enhanced our understanding of the cortical areas and computations required to successfully perform this task [29-32]. Researchers have also used the RDK task to obtain global motion coherence thresholds in diverse species, including harbor seals [33], pigeons [34], lizards [35], and rodents [12, 36]. Douglas and colleagues [12] reported that mice can learn the RDK task in a water swimming task. However, in that task, mice are manually handled on every trial, and this limits
A
uthor Man
uscr
ipt
A
uthor Man
uscr
ipt
A
uthor Man
uscr
ipt
A
uthor Man
uscr
throughput in the paradigm. More generally, mice have been noted to be difficult to train to perform visual psychophysics tasks [12, 13, 37]. Thus we sought to develop a higher throughput paradigm, and use it to explore global motion processing in mice.
Here, we present a video-based, touchscreen chamber task in which mice learn a RDK discrimination task. This work extends prior work on touchscreen-based learning and memory assays [38-40] to incorporate motion video stimuli and procedures to measure psychophysical thresholds in mice. Using this approach, we obtained a multi-faceted characterization of global motion processing in mice. We measured learning rates,
psychometric curves, the influence of stimulus parameters on performance, response times as a function of either learning or discrimination difficulty, and we correlated learning rates with psychophysical thresholds. The behavior task we present here can facilitate further explorations of mouse psychophysics, and the data we present can constrain models of mouse visual processing of global motion stimuli.
2. Methods
2.1 Subjects
Seven adult C57BL/6 mice were used in the experiments reported here. Animals were between 60 and 100 days old at the start of training which lasted for approximately 3 months. All training and procedures were reviewed and approved by the Institutional Animal Care and Use Committee of the University of North Carolina, which ensures compliance with the standards of the American Association for Laboratory Animal Science (AALAS).
2.2 Apparatus
The operant chamber is a modification of the mouse chamber available from Lafayette Instrument and reported in References [38-40]. The central chamber is a trapezoidal shaped enclosure with a metal perforated floor. The front wall of the chamber is a touchscreen monitor (1024 × 768) with a plastic screen and an IR sensor (Fig. 1a). The IR sensor in the touchscreen monitor reduced the necessity for the mouse to touch the screen with significant force to register a response. The back of the trapezoidal enclosure was modified to contain a liquid delivery reservoir (Coulbourn Instruments, H14-03M) connected to a custom lick sensor [41]. The liquid reward was delivered to the reservoir by a peristaltic pump
(Williamson Manufacturing, Model 100-035-012-008/4). Control of the house light, pump, and detection of the lick sensor was performed with a DIO board (Phidgets, 1012_2) connected to the control computer. The control computer ran up to four operant chambers simultaneously. Each of the four chambers received sound from one channel of a sound card (Asus, Xonar DX 7.1) installed in the control computer. The sounds used in this task were either a 1 kHz sinusoidal tone or Gaussian white noise. A six-monitor video card
(VisionTek, Radeon 7750 eye6) was used to deliver the visual stimulus to the four chambers as well as the main monitor for the control computer. All aspects of the system were controlled by custom software written in LabVIEW.
A
uthor Man
uscr
ipt
A
uthor Man
uscr
ipt
A
uthor Man
uscr
ipt
A
uthor Man
uscr
2.3 Stimuli
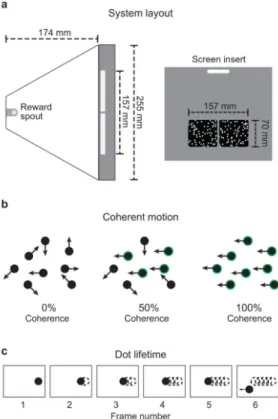
Three stimulus image pairs (pairs 1, 2, and 5 from Reference [38]) were used for pre-training. RDK were used for training and testing, and were generated in a custom LabVIEW program and saved as AVI video files. For a given set of parameters (dot size, dot speed, coherence, and lifetime) each AVI file consisted of 300 frames which, at the video display rate (30 Hz), formed 10 seconds of unique stimulus that was looped. Additionally, for each trial this video began at a unique frame number so the animal could not learn the task based on the initial frame presented. Dot diameter (3.88 mm) and dot speed (58.2 mm/s or 1.94 mm step size per video frame) were selected to match previously used stimulus parameters [12]. The dot area coverage for training was 12.5% which resulted in approximately 77 dots for each stimulus side. The dot lifetimes, ⊺ (frames), used were either infinite or short (165 ms, or 5 video update frames). Within a RDK, there are two populations of dots: one population that has the same movement direction (this defines the coherence percentage and net motion) and another population where each dot has a random direction of motion. All the dots in a kinematogram have the same dot size, lifetime, and step size. In a 100% coherent motion RDK all dots move in the same direction, while in a 0% coherence RDK all dots move randomly and no net direction of movement is perceived (Fig. 1b). To create a kinematogram, each dot (number of dots is determined by the dot density) is either placed in the coherent group or the random group and this assignment does not change. The dots in the coherent group are assigned a direction of travel (left or up in this study) and each dot in the non-coherent category is assigned an initial random direction evenly sampled across all directions.
Dot lifetime defines the number of frames a dot will appear on the screen while maintaining its trajectory. Throughout the dot lifetime, the dot will travel in the direction assigned at the creation of the dot (Fig. 1c). In the frame after the end of the dot lifetime, the dot will appear in a new location on the screen, and travel in an assigned direction depending on its
membership to either the coherent group or random group. If it is part of the random group it will be assigned a new random direction of travel; a dot in the coherent group will appear in a new location but will keep the same direction of travel. At the start of the RDK, all dots are equally distributed to a position within their lifetime, therefore only 1/⊺ of the dots are appearing in a new location per frame. A consequence of this is then that the maximum coherence percentage is 100% × (⊺-1)/⊺, which for ⊺=5 is 80%. We use this corrected percent coherence for all reported measurements. For the “infinite” dot lifetime, we used 20 frames. Supplementary Video 1 shows a series of kinematograms with decreasing dot coherence (80% - 0%) for a dot lifetime of 165 ms (5 frames).
2.4 Behavioral Training
Eight-week old C57BL/6 mice were separated into single housing and given free access to food for 5-7 days or until weight plateaued. During this period of time, mice typically gained 10-20% of their original body weight. We found it to be important for the animals to gain weight prior to food restriction so the decrease in caloric intake would not lead to lethargy. The mice were then placed on food restriction and brought to and maintained at 85% of their plateaued body weight for the duration of training and testing. Once a mouse reached its target weight, we began the training protocol summarized in Table 1. Animals were trained 5
A
uthor Man
uscr
ipt
A
uthor Man
uscr
ipt
A
uthor Man
uscr
ipt
A
uthor Man
uscr
days a week at the same time every day, weighed immediately prior to the start of and fed immediately after the end of their training session. Over the course of training, mice learned to select a specific target stimulus on the touchscreen in order to earn a reward at the reward port. For our study, 5 μl of strawberry kefir was used as a reward. The total amount of reward was calculated at the end of a training period and the additional caloric requirements were supplied by Prolab RMH 3000 LabDiet (Granville Milling, Purina) chow. The daily food intake for each animal was adjusted individually to maintain 85% body weight. As mentioned, training occurred 5 days a week; on non-training days, the mouse obtained all of its daily calories from an adjusted amount of Prolab RMH 3000 chow.
The training was conducted in four phases described below (Fig. 2a-c). Depending on the phase of training, sessions varied between 60 and 150 minutes. The first three phases were considered ‘pre-training’.
Training stage 1: Free Reward (FR)—The purpose of this phase of training was to associate the tone with the delivery of a reward, and learning the location of the reward (liquid port). During this phase, mice learned to lick the reward port to receive a reward. A trial started with a one second, 1 kHz tone followed by the delivery of a reward to the liquid port. Licking the reward port triggered the start of a new trial after the mouse had
discontinued licking the reward port for at least 200 ms. This allowed for the mouse to consume the reward (Fig. 2a). There was no timeout and no stimuli were presented on the touchscreen during this phase of training. In order to advance, mice had to trigger more than 200 trials in an hour long session during two consecutive training days (Table 1). Mice were allowed to take up to a maximum of five training days to reach criteria, however the mice in this study completed this stage in an average of 2.1 ± 0.4 (mean ± S.D.) days (Fig. 3a, Table 1).
Training stage 2: Must Touch (MT)—The goal of this phase was to associate touching the screen with delivery of a reward. During this phase, mice had to touch any location on the screen at the front of the box to receive a reward. Random image pairs (pairs 1, 2, and 5 from Reference [38]) were presented on the touchscreen at the start of the trial with each image presented on a random side of the screen. After touching the screen, the images disappeared and a one second, 1 kHz tone sounded along with a reward. No timeouts were used during this phase of training. In this phase, cessation of licking the reward port triggered a new trial which began with random image pairs presented on the touchscreen (Fig. 2b). After 2 consecutive training days of more than 200 initiated trials per hour, the mice progressed to the next phase of training (Table 1). For this phase of training, mice were again allowed up to a maximum of five training days to reach criteria, however the mice in this study completed this stage in an average of 2.4 ± 0.5 (mean ± S.D.) days (Fig. 3a, Table 1).
Training stage 3: Image Discrimination (IM)—This training phase utilized a dot and fan image pair stimulus [39] and required the mice to touch a specific target stimulus on the screen to earn a reward. The target stimulus was randomly presented on either the left or right side of the screen with no more than three target stimuli appearing on the same side sequentially. During the initial stage of this phase, no mask was present in front of the screen
A
uthor Man
uscr
ipt
A
uthor Man
uscr
ipt
A
uthor Man
uscr
ipt
A
uthor Man
uscr
in order to encourage touching the screen. Touching the target image (dot) on the screen earned the mouse a reward from the reward port along with a 1 kHz tone (1 second), while touching the distractor image (fan) resulted in a Gaussian white noise sound (1 second) and the house lights coming on for a timeout period of 10 seconds (Fig. 2c). After an incorrect answer, a correction trial [40, 42] was given in which the same stimuli were presented on the same side of the screen. This was repeated until the animal chose correctly. The correction trial helped to break any bias that a mouse might have for one side of the chamber and thus prevents the mouse from accepting a time out ~50% of the time. Only the initial answer to a stimulus presentation was counted toward the percentage correct (correction trials were ignored). Again in this phase, a new trial was immediately triggered upon cessation of licking the reward port. As a result, the stimuli was present as soon as the mouse turned and faced the screen, maximizing time for discrimination while also assuring the stimuli were presented when the mouse was roughly equidistance between the two choices. In order to advance to the next stage of training, mice had to perform this task with 85% accuracy on 200 or more trials in one hour for two consecutive training days (Table 1). Mice were allowed up to a maximum of 10 training days to reach criteria. After reaching criteria, a dividing mask was added in front of the screen to more clearly delineate the two stimuli and allowed up to an additional two days to return to criteria (Table 1). In practice, performance improved on the task with introduction of the mask, with no mice in this study taking the maximum of 12 days to pass this stage of training (Fig. 3a) The average number of training days at this stage (without and with the mask) was 7.4 ± 1.3 (mean ± S.D.) training days (Table 1).
Training stage 4: Random Dot Kinematogram (RDK)—Upon reaching this phase, mice were trained to discriminate between two moving stimuli (see Section 2.3 Stimuli): dots moving upward (target stimulus) and dots moving leftward (distractor stimulus). This stage of training also incorporated correction trials as described above (Fig. 2c). Mice were initially trained on the RDK task with an infinite dot lifetime (RDK-inf, Fig. 3a) and a progressively increasing timeout and session duration (Table 1). After mice were performing with at least 85% accuracy on two consecutive days, the RDK stimulus was changed to a version with short (165 ms = 5 frames) dot lifetimes (RDK-short, Fig. 3a). The average number of training days on RDK-inf was 13.4 ± 4.4 (mean ± S.D.) and on RDK-short was 5.6 ± 2.5 training days.
2.5 Behavioral Testing
Stimuli for testing consisted of 11 levels of coherence (0% to 80% in steps of 8%) with a dot lifetime of 165 ms. Testing consisted of interleaved blocks of testing and training. Mice were not cued as to whether they were in a testing or training block.
During testing blocks, all 11 coherence levels (11 trials per block) were presented in a random order, using the “Method of Constant Stimuli” [43]. All answers were rewarded as if correct to counter nonvisual factors, such as the past history of rewards and failures, which have been shown to strongly impact behavior [13]. Further, given that our testing stimuli range from relatively easy to discriminate (80% coherence) down to impossible to discriminate (0% coherence), we did not want to “discourage” the mouse for an incorrect
A
uthor Man
uscr
ipt
A
uthor Man
uscr
ipt
A
uthor Man
uscr
ipt
A
uthor Man
uscr
response if the mouse was well motivated and attempting to indicate the correct answer. In these blocks, it is possible that the mouse may shift its behavior to no longer be stimulus-dependent. To counter this, we added interleaved training blocks to our testing paradigm, which included the usual time-out periods for incorrect responses.
During training blocks (7 trials per block), stimuli at 80% coherence were presented and normal performance feedback (including timeout periods and correction trials) was
provided. Performance during these interleaved training blocks served as an internal control to ensure the mice were still working to perceive the direction of the MDK stimuli in the testing blocks. Testing data was used only if the animal performed on average at criteria (≥85% correct) during training blocks for a testing session. All responses and coherence levels were recorded for analysis. Testing sessions were conducted for 150 minutes and resulted in an average of 330 testing trials with 30 trials per individual coherence level.
2.6 Parameter alterations
To further test the system, we altered stimuli parameters and assessed the performance of the mice. After training and coherence testing were successfully completed, a separate testing day was used to examine mouse performance with changes in either dot size or step size. Both dot size and step size were tested under a constant coherence of 48% to avoid a ceiling effect. The dot size was tested between 0.97 mm and 6.78 mm in increments of 0.97 mm and with a constant speed of 58.2 mm/s (step size of 1.94 mm/step). The dot density was held to a constant coverage of 12.5%. The influence of speed (step size) was tested by using the following levels of speed (step size): 7.2, 14.4, 36.3, 58.2, 87.3, 138.0, 181.5 mm/s (0.24, 0.48, 1.21, 1.94, 2.91, 4.60, 6.05 mm/step) while maintaining a dot size of 3.88 mm.
2.7 Curve fitting and statistical analyses
LabVIEW and MATLAB programs were used to analyze data. To obtain precise
measurements of coherence thresholds from our psychometric data and control for variation in maximum performance, data for each mouse was normalized to maximum performance (non-normalized, or “raw”, data is also presented). This data was then fit with a Weibull cumulative distribution function(PWeibull) where x is the observed value [8, 44]
The slope (β) and threshold parameters (α) [44] were obtained by optimizing the log likelihood comparing the observed psychometric data to the data generated by the Weibull function. To detect linear correlations, Pearson's coefficient was computed, along with a two-tailed p-value.
3. Results
3.1 Training
All mice trained in this study (7 of 7) successfully passed the pre-training phases (FR, MT, & IM), meeting criteria to advance to RDK training in 12 ± 1.5 days (mean ± S.D.) (Fig.
A
uthor Man
uscr
ipt
A
uthor Man
uscr
ipt
A
uthor Man
uscr
ipt
A
uthor Man
uscr
3a). These mice also readily acquired the RDK task (7 of 7, Fig. 3a), ultimately
discriminating correctly between vertical and horizontal motion on 85% or more of trials (Fig. 3b). Six out of seven mice performed significantly below chance for the first four days of RDK training, suggesting an implicit bias for selecting the non-target stimulus (Fig. 3b). However, regardless of initial performance, all animals reached RDK testing criteria with additional training (Fig. 3b). As the mice learned the task, the median response time (time from stimulus presentation until selection) showed a significant decrease (Fig. 3c, p = 0.004, paired t-test). It is worth noting that the animal that was above chance on the initial day of RDK training also learned the RDK task quickest (blue line, Fig. 3d), however most mice took longer to acquire the RDK task (inset, Fig. 3d). Once mice performed the RDK task at 100% coherence with 85% accuracy for 2 consecutive days, the task was modified, with the stimulus switching from infinite dot lifetimes to dot lifetimes of 165 ms (arrows, Fig. 3d). Performance in all mice decreased after switching to short dot lifetimes, however the mice returned to criteria within a few days of continued training (Table 1, Fig. 3a,b,d). Due to the decrease in dot lifetimes, the maximum coherence displayed decreased to 80% (see Section
2.3). This likely produced the initial decrease in seen in task performance. On average, mice
acquired the RDK task with 19 ± 5 (mean ± S.D.) days of training with one training session per day. Supplementary Video 2 shows an example of a mouse during the RDK training phase.
3.2 Coherence threshold testing
Psychometric coherence curves were obtained for six mice by interleaving testing and training blocks. One mouse failed to generate a coherence curve despite meeting the RDK criteria. During testing blocks, mice were presented stimulus pairs of coherence levels between 80% and 0% in random order, allowing us to sample the full range of coherence values for each animal (Fig. 4a). Feedback was not given on trial performance as all answers were rewarded as if correct. Training blocks with performance feedback using stimuli at 80% coherence were given after a testing block and served as an internal control. Testing data was used if the animal performed on average at criteria (at least 85% of trials correct) during training blocks. Supplementary Video 3 shows an example of a mouse during a RDK testing phase. The raw curves from six animals show similar trends, regardless of how quickly the mouse acquired the task (Fig. 4a, b). Weibull curves were fitted [8] to the data normalized to maximum performance for each animal (Fig. 4c). The maximum performance between animals was similar (Fig. 4d). We computed both raw and normalized (to the maximum performance of each mouse) coherence thresholds (Fig. 4d). The average threshold for coherence detection, defined as the level at which performance drops to 70% correct, was 22% ± 5% for the normalized values and 34% ± 7% for the raw values (Fig. 4d). One mouse was retested on two days and yield similar thresholds for both days (17.9% and 22.7%, normalized threshold). Mice that learned the task quickly also exhibit more sensitive (lower) thresholds for RDK discrimination. The correlation between the time of acquisition of the task (the number of training sessions on the RDK task with infinite lifetime) and the ultimate psychophysical measure of coherence threshold was highly significant (Fig. 4e; Pearson correlation = 0.97; p = 0.0014). To examine if the coherence threshold tested affected the response time, we calculated the mean of the fastest 50% of response times (measured from the start of the stimulus presentation until the selection
A
uthor Man
uscr
ipt
A
uthor Man
uscr
ipt
A
uthor Man
uscr
ipt
A
uthor Man
uscr
occurred) for each coherence level for each mouse. The mean of the six mice show a positive Spearman correlation (Fig. 4f; Spearman correlation = 0.397; p = 0.00098). This result indicates that on the more difficult trials the response time increased. Each animals’ plot was normalized to the mean response time to normalize animal variations. Finally, we
investigated whether mice exhibited a bias towards selecting the right or left sides of the touchscreen. Four of the six animals showed no significant bias in choice (p > 0.16 for those four mice, Wilcoxon signed rank test of choice side versus presentation side). Mouse 3 exhibited a bias toward the right side (~6.6% relative to presentation, p = 0.0118, Wilcoxon signed rank test) and Mouse 6 exhibited a bias toward the left side (~5.6% relative to presentation, p = 0.0022, Wilcoxon signed rank test). Collectively the mice demonstrated no systematic choice preference for a given side (p = 0.32, t-test).
3.3 Parameter alterations
Next, we explored the stimulus parameter space. We systematically altered dot size and speed (which is related to step size), and then measured how these parameters affect performance. To detect both increases and decreases in performance (i.e., minimizing potential ceiling effects), stimuli were generated using a coherence level of 48%, which produced average performance levels of 75% correct. Dot size of the stimuli was then varied around the level used to obtain the coherence curves (Fig. 4). Individual curves show similar trends (Fig. 5a), and the average shows that dot diameters 2.91 – 4.84 mm were readily perceived by the mice (> 60% performance; Fig. 5b). We then tested whether changes in speed (step size) altered discrimination performance. Again, stimuli were generated using a coherence level of 48%. Step size of the stimuli was varied around the level used to obtain the coherence curves (Fig. 4). Raw curves show similar trends between mice (Fig. 5c) while the average curve shows that speeds (36.3 – 181.5 mm/s (step size 1.21 – 6.05 mm/step) were easily perceived by the mice (> 60% performance; Fig. 5d).
4. Discussion
We have presented an automated, touchscreen-based behavioral training and psychophysical testing method for measuring global motion perception in mice. To our knowledge, this is the first report of the use of video stimuli in a touchscreen-based paradigm for mice. With this paradigm, mice performed several hundred trials per session without experimenter intervention. This adaptation of the original touchscreen based operant system [39] allowed us to train multiple mice in parallel (limited by the number of chambers available, four in this study), and measure several aspects of psychophysical performance for RDK discriminations. Using this method, we found that mouse-to-mouse variability in RDK coherence thresholds was low (Fig. 4), and mice had similar sensitivities to dot size and dot speed (Fig. 5). These findings can help constrain models of visual processing for motion perception.
Since the mice are freely moving in this task, the stimulus parameters (dot size and speed) in units of degrees of visual arc increase as the mouse moves towards the stimulus screen. The stimulus parameters, in units of degrees of visual arc, depend on both viewing distance and viewing angle (Fig. 5e). For a particular viewing distance and angle (ie, position of the
A
uthor Man
uscr
ipt
A
uthor Man
uscr
ipt
A
uthor Man
uscr
ipt
A
uthor Man
uscr
mouse and portion of the screen viewed) conversions from millimeters to degrees are straightforward (Fig. 5f). Manual observation revealed that mice would often approach one side of the screen, but then alter their path and observe the other side before choosing a response (Supplemental Videos 2, 3). By moving from side to side, some of the relative changes in dot size and speed are mitigated. With our experiment, we obtained an average raw coherence threshold of 34%, which is in agreement with the threshold obtained in a swim-based assay [12], and this value was similar across mice in the task (Fig. 4). Moreover, systematic variation in performance as a function of stimulus parameters was similar across mice (Fig. 5). Thus this source of imprecision does not preclude quantitative psychophysical measurements.
To date, there are few prior reports on visual psychophysics in mice. Aspects of mouse behavior can make psychophysics tests challenging in this species [12, 13, 37], and this has been a barrier to progress. Here we present a test that can be performed in freely moving mice, offers relatively high throughput, and provides maximal performance values > 85%, and reproducible performance from mouse-to-mouse.
One of the applications of this task is to measure psychophysical thresholds and parameter sensitivity, to constrain models of visual function, just as we did here. Another application is to use the freely moving behavior task to determine parameters and generate stimuli for lower throughput headfixed tasks [8, 45-48]. The ability to more rapidly test and generate trained animals in the freely moving behavioral tasks can expedite training and restrict the parameter space for headfixed behavioral tasks.
The automated, touchscreen-based RDK task we have developed will enable researchers to take advantage of available genetic tools in mice to probe both normal circuit function and the effects of genetic manipulations on task performance. The psychophysics task we present here, and freely moving touchscreen tasks more generally, are compatible with various experimental approaches for interrogating neural circuitry, including calcium imaging using head-mounted fluorescent microscope [49], fiber photometry [50],
optogenetics [51], and chemogenetics [52]. Thus, this assay can support further explorations into neural circuitry underlying visual processing in mice.
RDK stimuli are used both in both basic vision research and clinical research. In humans, this task is used to study the development of global motion perception and the effect of aging on signal discrimination [18, 24]. It has also been used to assess the nature and severity of impairment in patients suffering from congenital cataracts, amblyopia, and dyslexia [22, 23, 53, 54]. Psychometric measurements of this task have been successfully applied to neurodevelopmental and other psychiatric disorders, such as Fragile X Syndrome, Autism Spectrum Disorders, and Alzheimer’s [25-28]. Using the RDK discrimination paradigm presented here, this task can be readily tested in mouse models of diseases to reveal the effects of disease-related mutations on task performance [55].
Supplementary Material
Refer to Web version on PubMed Central for supplementary material.
A
uthor Man
uscr
ipt
A
uthor Man
uscr
ipt
A
uthor Man
uscr
ipt
A
uthor Man
uscr
Acknowledgements
This work was supported by grants from the Whitehall Foundation, the Klingenstein Foundation, UNC-Chapel Hill, Simons Foundation grant SCGB 325407SS, NSF grant 1450824, and NIH grant R01EY024294 to S.L.S. L.B.T. was supported by a Weatherstone Predoctoral Fellowship from Autism Speaks, an NIH NRSA F31HD084174, NIH training grant T32NS007431, and the HHMI Graduate Training Program in Translational Medicine at UNC. J.N.S. was supported by a Burroughs Wellcome Career Award at the Scientific Interface and NIH training grant T32HD40127. This work was also supported by the Carolina Institute for Developmental Disabilities (NIH U54HD055741). We are grateful to Ikuko Smith for scientific training and discussions of this work.
REFERENCES
1. Orger MB, Smear MC, Anstis SM, Baier H. Perception of Fourier and non-Fourier motion by larval zebrafish. Nat Neurosci. 2000; 3(11):1128–33. [PubMed: 11036270]
2. Fisher YE, Silies M, Clandinin TR. Orientation Selectivity Sharpens Motion Detection in Drosophila. Neuron. 2015; 88(2):390–402. [PubMed: 26456048]
3. Goodale MA, Milner AD. Separate visual pathways for perception and action. Trends Neurosci. 1992; 15(1):20–5. [PubMed: 1374953]
4. Newsome WT, Pare EB. A selective impairment of motion perception following lesions of the middle temporal visual area (MT). J Neurosci. 1988; 8(6):2201–11. [PubMed: 3385495]
5. Newsome WT, Wurtz RH, Dursteler MR, Mikami A. Deficits in visual motion processing following ibotenic acid lesions of the middle temporal visual area of the macaque monkey. J Neurosci. 1985; 5(3):825–40. [PubMed: 3973698]
6. Wang Q, Gao E, Burkhalter A. Gateways of ventral and dorsal streams in mouse visual cortex. J Neurosci. 2011; 31(5):1905–18. [PubMed: 21289200]
7. Wang Q, Sporns O, Burkhalter A. Network analysis of corticocortical connections reveals ventral and dorsal processing streams in mouse visual cortex. J Neurosci. 2012; 32(13):4386–99. [PubMed: 22457489]
8. Glickfeld LL, Histed MH, Maunsell JH. Mouse primary visual cortex is used to detect both orientation and contrast changes. J Neurosci. 2013; 33(50):19416–22. [PubMed: 24336708] 9. Andermann ML, Kerlin AM, Roumis DK, Glickfeld LL, Reid RC. Functional specialization of
mouse higher visual cortical areas. Neuron. 2011; 72(6):1025–39. [PubMed: 22196337] 10. Marshel JH, Garrett ME, Nauhaus I, Callaway EM. Functional specialization of seven mouse
visual cortical areas. Neuron. 2011; 72(6):1040–54. [PubMed: 22196338]
11. Juavinett AL, Callaway EM. Pattern and Component Motion Responses in Mouse Visual Cortical Areas. Curr Biol. 2015; 25(13):1759–64. [PubMed: 26073133]
12. Douglas RM, Neve A, Quittenbaum JP, Alam NM, Prusky GT. Perception of visual motion coherence by rats and mice. Vision Res. 2006; 46(18):2842–7. [PubMed: 16647739]
13. Busse L, Ayaz A, Dhruv NT, Katzner S, Saleem AB, Scholvinck ML, Zaharia AD, Carandini M. The detection of visual contrast in the behaving mouse. J Neurosci. 2011; 31(31):11351–61. [PubMed: 21813694]
14. Guo ZV, Li N, Huber D, Ophir E, Gutnisky D, Ting JT, Feng G, Svoboda K. Flow of cortical activity underlying a tactile decision in mice. Neuron. 2014; 81(1):179–94. [PubMed: 24361077] 15. Yang M, Lewis FC, Sarvi MS, Foley GM, Crawley JN. 16p11.2 Deletion mice display cognitive
deficits in touchscreen learning and novelty recognition tasks. Learn Mem. 2015; 22(12):622–32. [PubMed: 26572653]
16. Nilsson SR, Celada P, Fejgin K, Thelin J, Nielsen J, Santana N, Heath CJ, Larsen PH, Nielsen V, Kent BA, Saksida LM, Stensbol TB, Robbins TW, Bastlund JF, Bussey TJ, Artigas F, Didriksen M. A mouse model of the 15q13.3 microdeletion syndrome shows prefrontal neurophysiological dysfunctions and attentional impairment. Psychopharmacology (Berl). 2016; 233(11):2151–63. [PubMed: 26983414]
17. Williams DW, Sekuler R. Coherent global motion percepts from stochastic local motions. Vision Res. 1984; 24(1):55–62. [PubMed: 6695508]
18. Trick GL, Silverman SE. Visual sensitivity to motion: age-related changes and deficits in senile dementia of the Alzheimer type. Neurology. 1991; 41(9):1437–40. [PubMed: 1891094]
A
uthor Man
uscr
ipt
A
uthor Man
uscr
ipt
A
uthor Man
uscr
ipt
A
uthor Man
uscr
19. Tanaka K, Sugita Y, Moriya M, Saito H. Analysis of object motion in the ventral part of the medial superior temporal area of the macaque visual cortex. J Neurophysiol. 1993; 69(1):128–42. [PubMed: 8433128]
20. Kiorpes L, Price T, Hall-Haro C, Movshon JA. Development of sensitivity to global form and motion in macaque monkeys (Macaca nemestrina). Vision Res. 2012; 63:34–42. [PubMed: 22580018]
21. Bogfjellmo LG, Bex PJ, Falkenberg HK. The development of global motion discrimination in school aged children. J Vis. 2014; 14(2)
22. Conlon EG, Lilleskaret G, Wright CM, Power GF. The influence of contrast on coherent motion processing in dyslexia. Neuropsychologia. 2012; 50(7):1672–81. [PubMed: 22484519] 23. Joshi M, Simmers A, Jeon S. Deficits in integration of global motion and form in noise is
associated with the severity and type of amblyopia. J Vis. 2015; 15(12):193.
24. Conlon EG, Brown DT, Power GF, Bradbury SA. Do older individuals have difficulty processing motion or excluding noise? Implications for safe driving. Neuropsychol Dev Cogn B Aging Neuropsychol Cogn. 2015; 22(3):322–39. [PubMed: 25066200]
25. Robertson CE, Martin A, Baker CI, Baron-Cohen S. Atypical integration of motion signals in Autism Spectrum Conditions. PLoS One. 2012; 7(11):e48173. [PubMed: 23185249]
26. Milne E, Swettenham J, Hansen P, Campbell R, Jeffries H, Plaisted K. High motion coherence thresholds in children with autism. J Child Psychol Psychiatry. 2002; 43(2):255–63. [PubMed: 11902604]
27. Kogan CS, Boutet I, Cornish K, Zangenehpour S, Mullen KT, Holden JJ, Der Kaloustian VM, Andermann E, Chaudhuri A. Differential impact of the FMR1 gene on visual processing in fragile X syndrome. Brain. 2004; 127(Pt 3):591–601. [PubMed: 14736752]
28. Gilmore GC, Wenk HE, Naylor LA, Koss E. Motion perception and Alzheimer's disease. J Gerontol. 1994; 49(2):P52–7. [PubMed: 8126359]
29. Celebrini S, Newsome WT. Microstimulation of extrastriate area MST influences performance on a direction discrimination task. J Neurophysiol. 1995; 73(2):437–48. [PubMed: 7760110]
30. Salzman CD, Britten KH, Newsome WT. Cortical microstimulation influences perceptual judgements of motion direction. Nature. 1990; 346(6280):174–7. [PubMed: 2366872] 31. Salzman CD, Murasugi CM, Britten KH, Newsome WT. Microstimulation in visual area MT:
effects on direction discrimination performance. J Neurosci. 1992; 12(6):2331–55. [PubMed: 1607944]
32. Kim JN, Shadlen MN. Neural correlates of a decision in the dorsolateral prefrontal cortex of the macaque. Nat Neurosci. 1999; 2(2):176–85. [PubMed: 10195203]
33. Weiffen M, Mauck B, Dehnhardt G, Hanke FD. Sensitivity of a harbor seal (Phoca vitulina) to coherent visual motion in random dot displays. Springerplus. 2014; 3:688. [PubMed: 25520911] 34. Bischof WF, Reid SL, Wylie DR, Spetch ML. Perception of coherent motion in random dot
displays by pigeons and humans. Percept Psychophys. 1999; 61(6):1089–101. [PubMed: 10497430]
35. Woo KL, Burke D. Technique for measuring speed and visual motion sensitivity in lizards. Psicologica. 2008; 29(2):133–151.
36. Petruno SK, Clark RE, Reinagel P. Evidence that primary visual cortex is required for image, orientation, and motion discrimination by rats. PLoS One. 2013; 8(2):e56543. [PubMed: 23441202]
37. Sriram, B.; A.C.-M.; Denardo, L.; Kim, EJ.; Patel, M.; Huynh, P.; Giering, E.; Reinagel, P.; Ghosh, A. Society for Neuroscience. San Diego, Ca: 2013. Visually guided behavior in freely moving mice.
38. Bussey TJ, Padain TL, Skillings EA, Winters BD, Morton AJ, Saksida LM. The touchscreen cognitive testing method for rodents: how to get the best out of your rat. Learn Mem. 2008; 15(7): 516–23. [PubMed: 18612068]
39. Bussey TJ, Saksida LM, Rothblat LA. Discrimination of computer-graphic stimuli by mice: a method for the behavioral characterization of transgenic and gene-knockout models. Behav Neurosci. 2001; 115(4):957–60. [PubMed: 11508736]
A
uthor Man
uscr
ipt
A
uthor Man
uscr
ipt
A
uthor Man
uscr
ipt
A
uthor Man
uscr
40. Horner AE, Heath CJ, Hvoslef-Eide M, Kent BA, Kim CH, Nilsson SR, Alsio J, Oomen CA, Holmes A, Saksida LM, Bussey TJ. The touchscreen operant platform for testing learning and memory in rats and mice. Nat Protoc. 2013; 8(10):1961–84. [PubMed: 24051959]
41. Slotnick B. A simple 2-transistor touch or lick detector circuit. J Exp Anal Behav. 2009; 91(2): 253–5. [PubMed: 19794837]
42. Oomen CA, Hvoslef-Eide M, Heath CJ, Mar AC, Horner AE, Bussey TJ, Saksida LM. The touchscreen operant platform for testing working memory and pattern separation in rats and mice. Nat Protoc. 2013; 8(10):2006–21. [PubMed: 24051961]
43. Laming D, Laming J. F. Hegelmaier: on memory for the length of a line. Psychol Res. 1992; 54(4): 233–9. [PubMed: 1494608]
44. May KA, Solomon JA. Four theorems on the psychometric function. PLoS One. 2013; 8(10):e74815. [PubMed: 24124456]
45. Burgess CP, Steinmetz N, Lak A, Zatka-Haas P, Ranson A, Wells M, Schroeder S, Jacobs EAK, Bai Reddy C, Soares S, Linden JF, Paton JJ, Harris KD, Carandini M. High-yield methods for accurate two-alternative visual psychophysics in head-fixed mice. bioRxiv. 2016
46. Li N, Chen T-W, Guo ZV, Gerfen CR, Svoboda K. A motor cortex circuit for motor planning and movement. Nature. 2015; 519(7541):51–56. [PubMed: 25731172]
47. Andermann ML, Kerlin AM, Reid RC. Chronic Cellular Imaging of Mouse Visual Cortex During Operant Behavior and Passive Viewing. Frontiers in Cellular Neuroscience. 2010; 4:3. [PubMed: 20407583]
48. Guo ZV, Hires SA, Li N, O'Connor DH, Komiyama T, Ophir E, Huber D, Bonardi C, Morandell K, Gutnisky D, Peron S, Xu N.-l. Cox J, Svoboda K. Procedures for Behavioral Experiments in Head-Fixed Mice. PLoS One. 2014; 9(2):e88678. [PubMed: 24520413]
49. Ghosh KK, Burns LD, Cocker ED, Nimmerjahn A, Ziv Y, Gamal AE, Schnitzer MJ. Miniaturized integration of a fluorescence microscope. Nat Methods. 2011; 8(10):871–8. [PubMed: 21909102] 50. Guo Q, Zhou J, Feng Q, Lin R, Gong H, Luo Q, Zeng S, Luo M, Fu L. Multi-channel fiber
photometry for population neuronal activity recording. Biomed Opt Express. 2015; 6(10):3919–31. [PubMed: 26504642]
51. Fenno L, Yizhar O, Deisseroth K. The development and application of optogenetics. Annu Rev Neurosci. 2011; 34:389–412. [PubMed: 21692661]
52. Roth BL. DREADDs for Neuroscientists. Neuron. 2016; 89(4):683–94. [PubMed: 26889809] 53. Lewis TL, Maurer D. Effects of early pattern deprivation on visual development. Optom Vis Sci.
2009; 86(6):640–6. [PubMed: 19417706]
54. Ellemberg D, Lewis TL, Maurer D, Brar S, Brent HP. Better perception of global motion after monocular than after binocular deprivation. Vision Res. 2002; 42(2):169–79. [PubMed: 11809471] 55. Nithianantharajah J, McKechanie AG, Stewart TJ, Johnstone M, Blackwood DH, St Clair D, Grant
SG, Bussey TJ, Saksida LM. Bridging the translational divide: identical cognitive touchscreen testing in mice and humans carrying mutations in a disease-relevant homologous gene. Sci Rep. 2015; 5:14613. [PubMed: 26423861]
A
uthor Man
uscr
ipt
A
uthor Man
uscr
ipt
A
uthor Man
uscr
ipt
A
uthor Man
uscr
Highlights
• A global motion, random dot kinematogram touchscreen task for freely moving mice.
• Mice reliably learned, and performed hundreds of trials per session.
• Quantitative psychometric curves were reproducible mouse-to-mouse.
• Parameter alterations measured effects of stimulus parameters on motion perception.
• This method can be used to measure higher visual functions in mice.
A
uthor Man
uscr
ipt
A
uthor Man
uscr
ipt
A
uthor Man
uscr
ipt
A
uthor Man
uscr
Figure 1. System layout and random dot kinematogram (RDK) visual stimuli
(a) Dimensions of the touchscreen based behavioral apparatus are given. On the left is the trapezoidal enclosure utilized and on the right is the screen insert used to delineate the two sides of the stimuli. (b) Examples for three coherence levels for the RDK are shown. Circles with the green outline belong to the coherent group and travel in the same direction. (c) Each subsequent frame the dot travels a given step size. After a given number of frames (dot lifetime) the dot disappears and appears in a new location. The example given is for a dot lifetime of 5 frames.
A
uthor Man
uscr
ipt
A
uthor Man
uscr
ipt
A
uthor Man
uscr
ipt
A
uthor Man
uscr
Figure 2. Training flowcharts
(a) In the Free Reward (FR) stage, the mouse associates the tone with a reward and learns the location of the reward. (b) In the Must Touch stage, the mouse learns to associate touching the screen with reward delivery. In this stage, touching either side of the screen results in a reward. (c) In the Image Discrimination (IM) stage of training, the mouse is only rewarded for touching the side of the screen presenting the target static image stimulus. In Random Dot Kinematogram (RDK) training, the task is identical to IM except both stimuli are moving dot kinematograms.
A
uthor Man
uscr
ipt
A
uthor Man
uscr
ipt
A
uthor Man
uscr
ipt
A
uthor Man
uscr
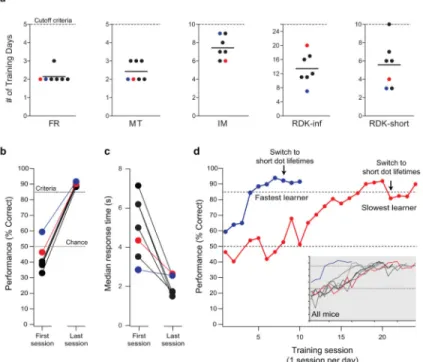
Figure 3. RDK discrimination learning
(a) The number of training days for each mouse until performance criteria were met for progression to the next stage (solid line indicates the population mean). The “cutoff criteria” (dotted line) is the maximum number of training days allowed for a stage. (b) Initial and final performance during training on the RDK task. On the first day of training the mice were close to chance level (dotted line at 50%). After 10-24 days of training, all mice had acquired the task to the criteria level (dotted line at 85%). (c) The median response time (time from the presentation of the stimulus until the selection of a stimulus) for each animal on both the initial and final days of RDK training indicates that there is a significant decrease (p = 0.004, paired t-test) the in response time after the mice learned the task. (d) RDK training curves of the fastest (blue) and slowest (red) mice to reach the criteria. Acquisition of the RDK task occurred over 10-24 days of training (one training session per day). The arrow indicates the switch from infinite dot lifetime to finite dot lifetime. Due to the decrease in coherence level created by the change in dot lifetime, the performance of the mice decreased. In the inset, the RDK training curves for all mice showing performance across training sessions are shown. Criteria level (85%) and chance level (50%) are
indicated. The tick marks on the inset plot have the same values as those shown on the larger plot.
A
uthor Man
uscr
ipt
A
uthor Man
uscr
ipt
A
uthor Man
uscr
ipt
A
uthor Man
uscr
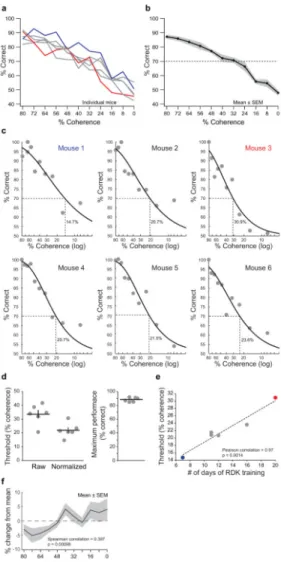
Figure 4. Psychometric curves
(a) Coherence curves were obtained for six mice by interleaving testing and training blocks. During testing blocks, mice were presented stimulus pairs of coherence levels between 80% and 0% in random order, allowing us to sample the full range of coherence values for each animal. Feedback was not given on trial performance during testing blocks as all answers were rewarded as if correct. Training blocks with performance feedback using stimuli at 80% coherence were given after a testing block and served as an internal control. The fastest (blue) and slowest (red) learners are labeled. (b) The average (black line) and s.e.m. (gray shading) for the six mice tested in (a). The threshold for performance was considered 70% correct and is plotted as a dotted line. (c) Weibull curves were fit to the data normalized to maximum performance for each animal. The coherence threshold for each mouse is labeled in the corresponding graph and denoted with a dotted line. The fastest (blue) and slowest (red) learners are labeled. (d) Parameters from the Weibull curve fits yielded the coherence threshold (percent coherence at 70% accuracy) for both the raw and data normalized (left) and the maximum performance (right). The horizontal bar indicates the mean and the vertical bar is the S.E.M. (e) The number of days of training a mouse required on the infinite dot lifetime RDK task correlated with the psychophysical measure of coherence threshold.
A
uthor Man
uscr
ipt
A
uthor Man
uscr
ipt
A
uthor Man
uscr
ipt
A
uthor Man
uscr
The fastest (blue) and slowest (red) learners are labeled. (f) Mean of the fastest 50% of response times (measured from the start of the stimulus presentation until the selection occurred) for each coherence level for each mouse was normalized to their mean and was then averaged. The mean of the six mice show a positive Spearman correlation (Spearman correlation = 0.397; p = 0.00098).
A
uthor Man
uscr
ipt
A
uthor Man
uscr
ipt
A
uthor Man
uscr
ipt
A
uthor Man
uscr
Figure 5. Comparing stimulus parameters and performance
After training and coherence testing were successfully completed, a separate testing day was used to examine mouse performance with changes in either dot diameter (a, b) or speed (step size) (c, d). Both dot diameter and speed were tested under a constant coherence of 48% to avoid a ceiling effect. (a) Individual mouse performance as dot size was varied. (b) The mean (black) and S.E.M. (gray) of the 4 mice from (a). (c) Individual mouse
performance as the speed (resulting in changes in the step size) was varied. (d) The mean (black) and S.E.M. (gray) of the 4 mice from (c). The arrows in a-d indicate the values used for training. (e) Apparent size and speed of a dot (in degrees of visual field) changes as a function of viewing distance along the normal to the screen and along the perpendicular direction. As the animal approaches the screen along the midline, the relative dot size and speed increases for the dots closest to the midline (blue), and increases until a maximum is reached before decreasing again for the dots further from the midline (red, yellow). Viewing angles for the three screen location for a 76 mm viewing distance (along the central axis of the chamber) are indicated. (f) Panels (b) and (d) have been plotted with the x-axis converted to mm and mm/s assuming a viewing distance of 76 mm and angle of 28.1°.
A
uthor Man
uscr
ipt
A
uthor Man
uscr
ipt
A
uthor Man
uscr
ipt
A
uthor Man
uscr
A
uthor Man
uscr
ipt
A
uthor Man
uscr
ipt
A
uthor Man
uscr
ipt
A
uthor Man
uscr
ipt
Table 1 Training ProtocolSummary of the various phases of training as described in ‘2.4 Behavioral Training’. “Cutoff criteria” refers to the maximum number of possible training days allowed per mouse for a given stage. If a mouse failed to reach the criteria for progression in that number of days or fewer, the mouse was cut from training. No mice were cut from training during this study. “Criteria for progression” details the minimum number of initiated trials, performance level (if applicable), and minimum number of consecutive days at the specified
performance level are required to advance to the next stage. The duration of a training session under each stage as well as the duration of the timeout used for punishment (if applicable) are also given.
Phase
Training days Cutoff
Criteria
Mean +/− S.D. Days to criteria Criteria for progression Session duration Punishment time out
Free Reward (FR) 5 2.1 +/− 0.4
200 trials per hour 2 consecutive
days
60 min NA
Must Touch (MT) 5 2.4 +/− 0.5
200 trials per hour 2 consecutive
days
60 min NA
Image Discrimination (IM) 10
7.4 +/− 1.3
85% performance 200 trials per
hour 2 consecutive
days
60 min 10 sec
IM + Screen 2
85% performance 200 trials per
hour 2 consecutive
days
60 min 10 sec
Random Dot Kinematogram – infinite
dot lifetime (RDK-Inf)
NA
13.4 +/− 4.4
2 days on task 60 min 10 sec
RDK - Inf NA 2 days on task 90 min 30 sec
RDK - Inf NA 2 days on task 120 min 60 sec
RDK - Inf 20
85%+ performance 2 consecutive
days
150 min 90 sec
Random Dot Kinematogram – short dot
lifetime (RDK-short)
10+ 5.6 +/− 2.5
85%+ performance 2 consecutive
days